. 2024 Mar;627(8003):407-415.
doi: 10.1038/s41586-024-07079-8. Epub 2024 Feb 21.

B cells orchestrate tolerance to the neuromyelitis optica autoantigen AQP4

Affiliations

B cells orchestrate tolerance to the neuromyelitis optica autoantigen AQP4

Ali Maisam Afzali et al. Nature. 2024 Mar.

Abstract

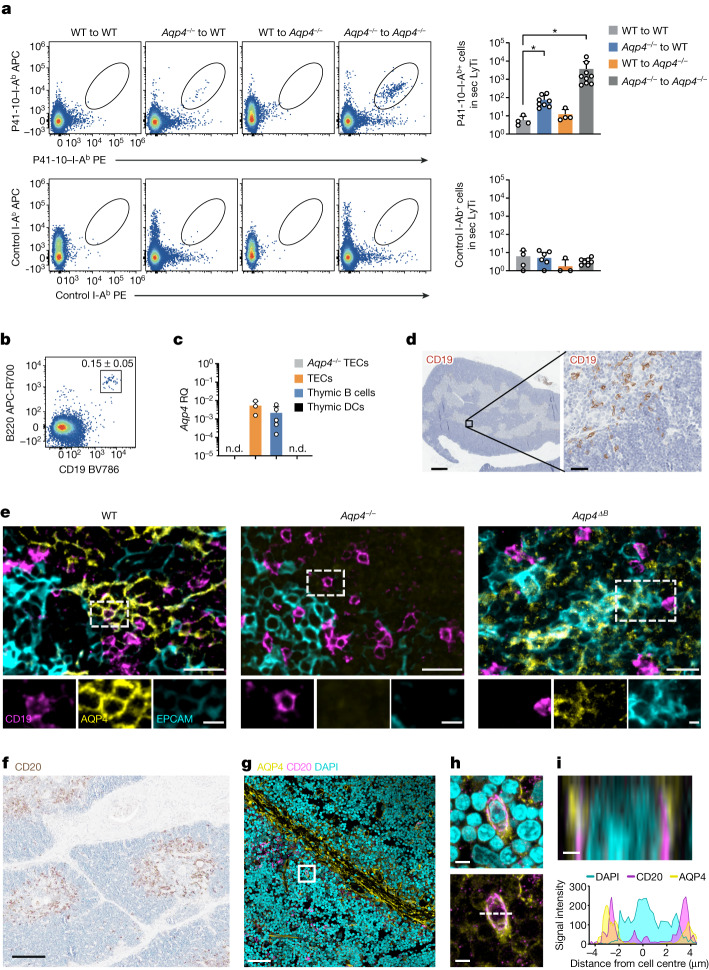
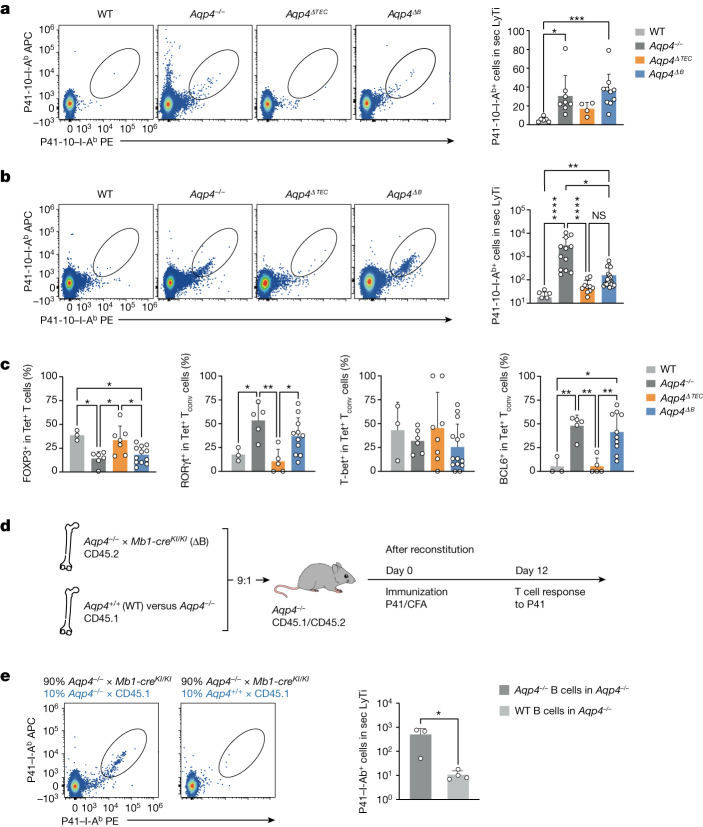
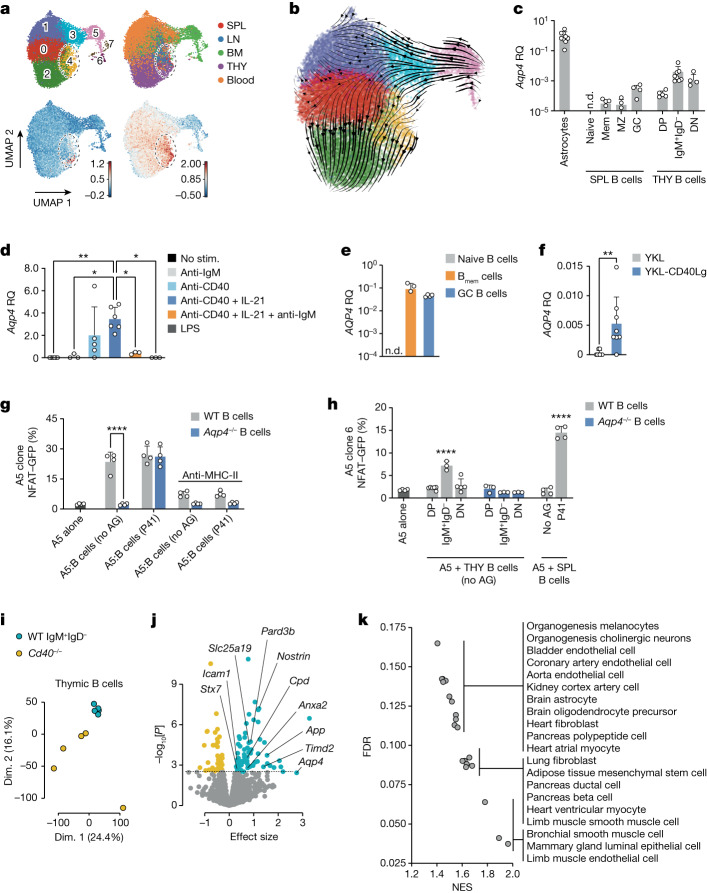
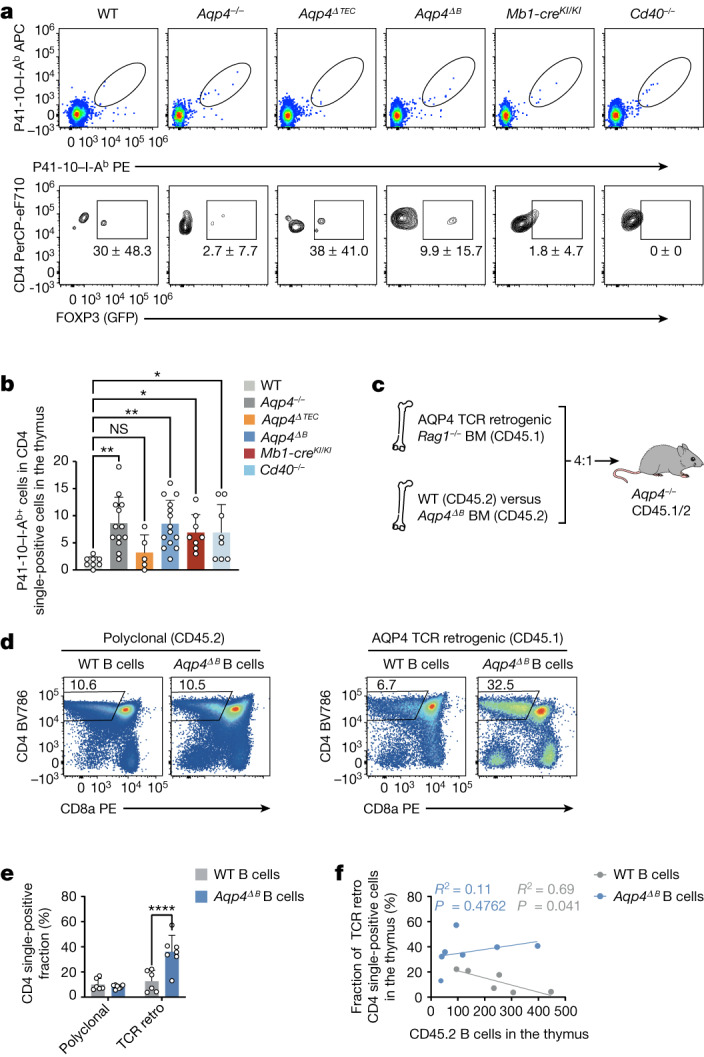
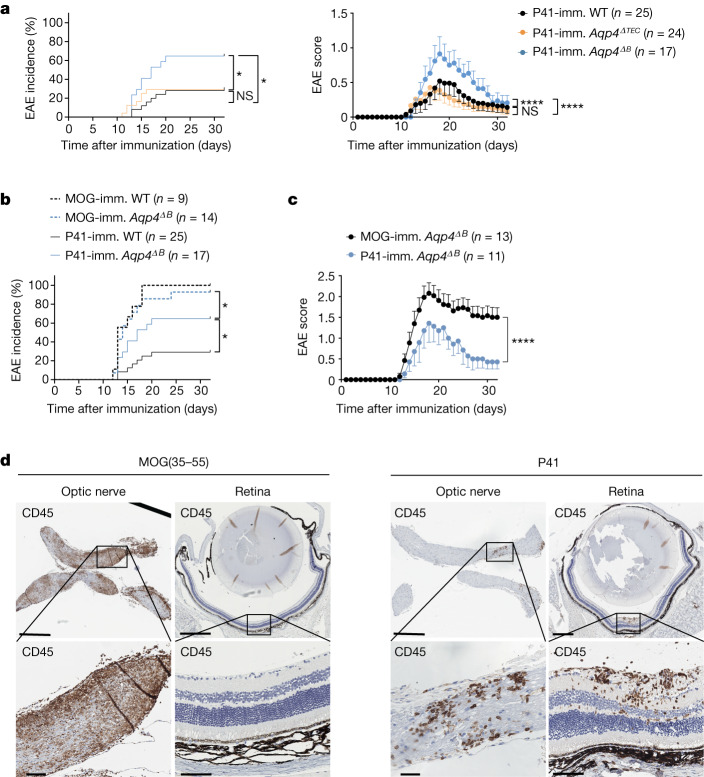
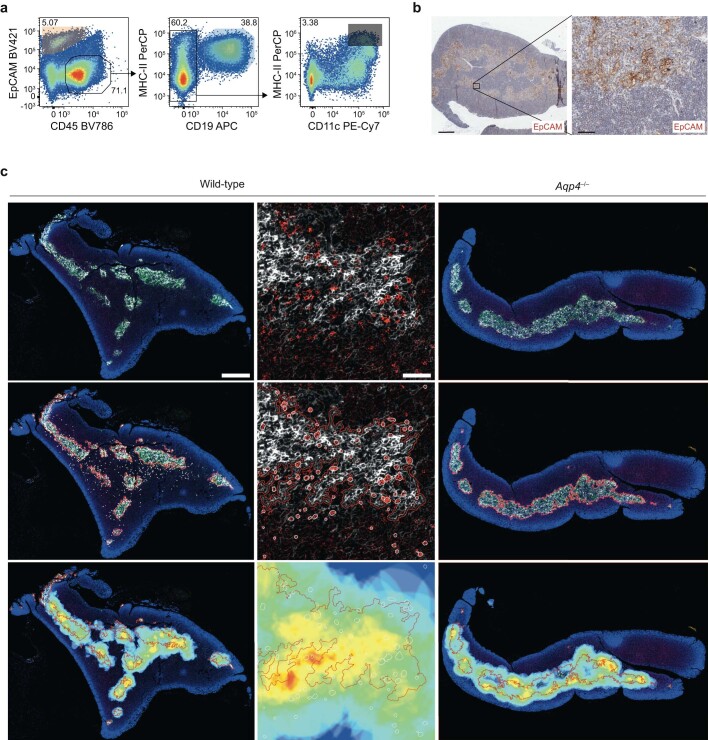
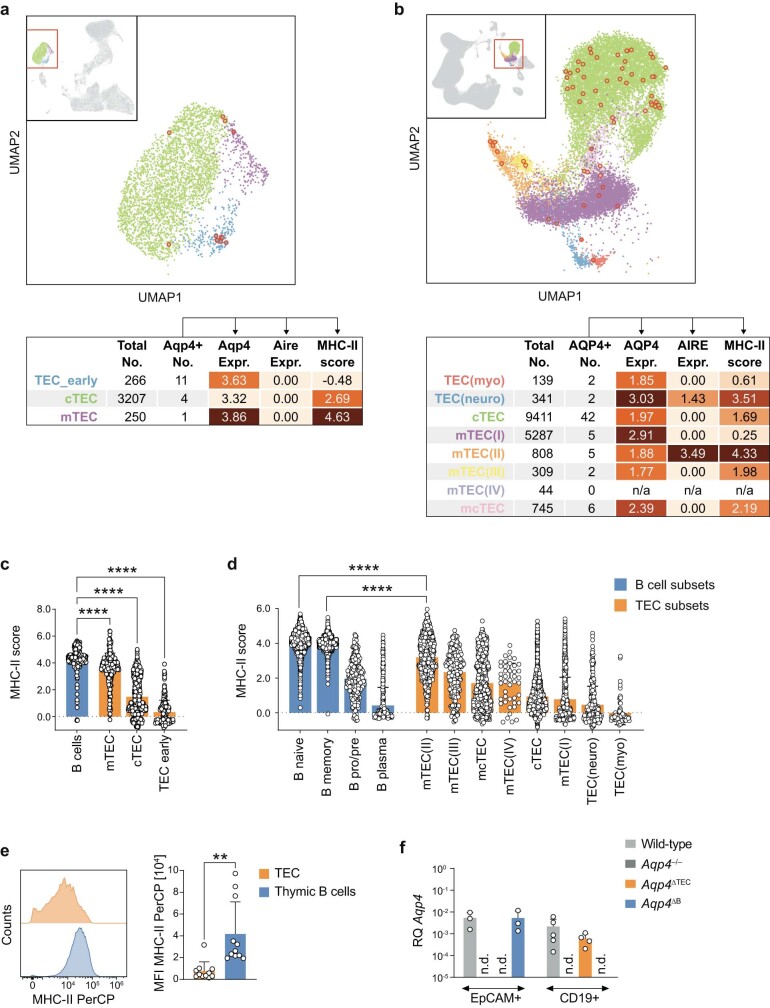
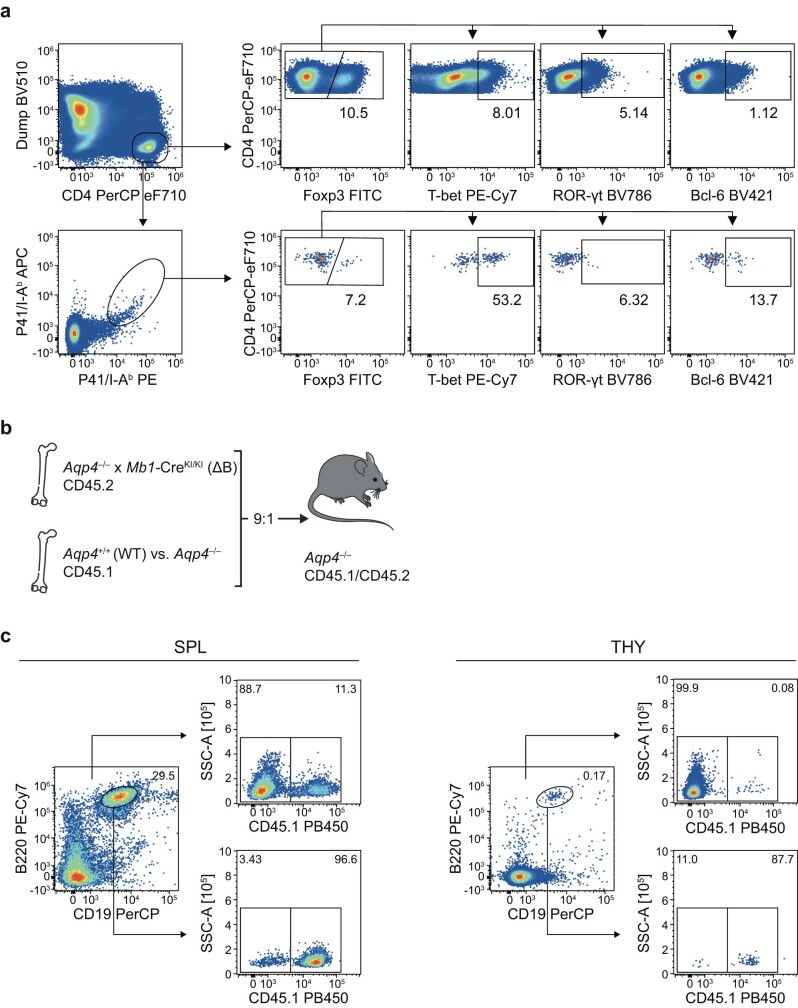
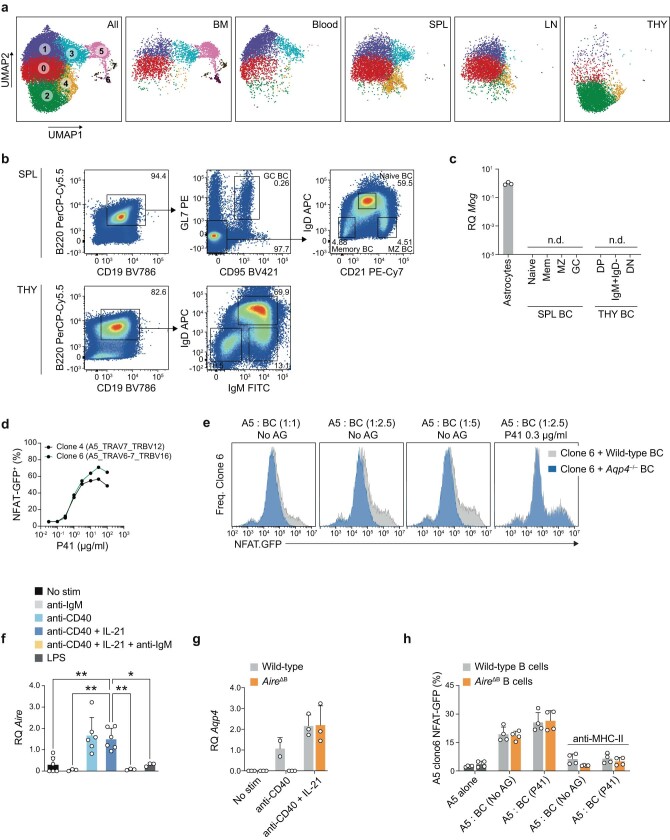
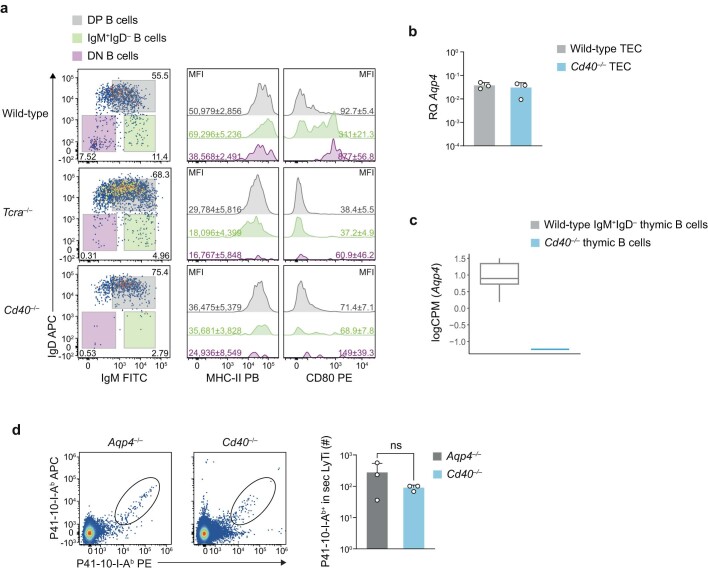
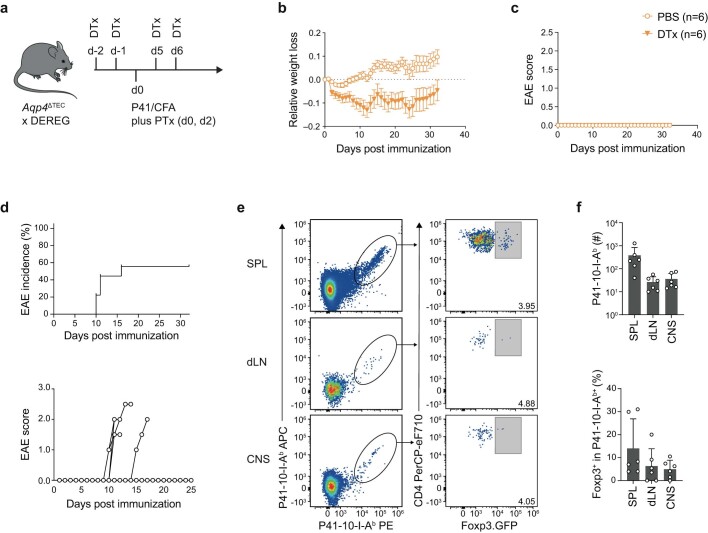
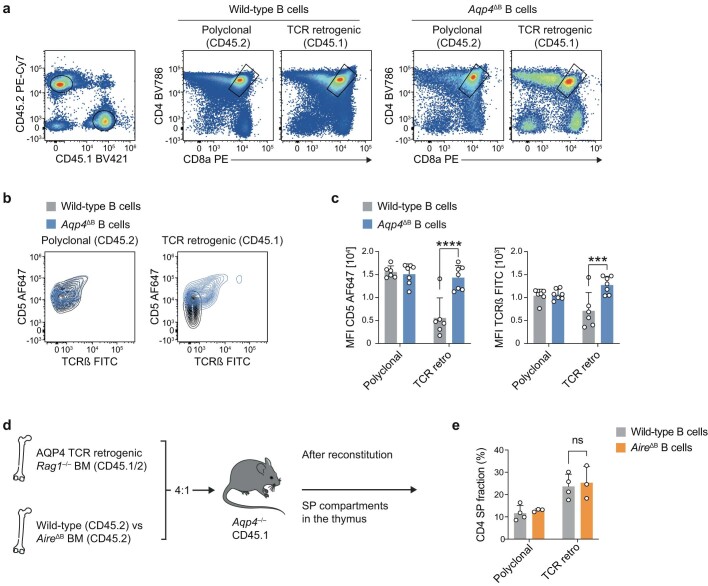
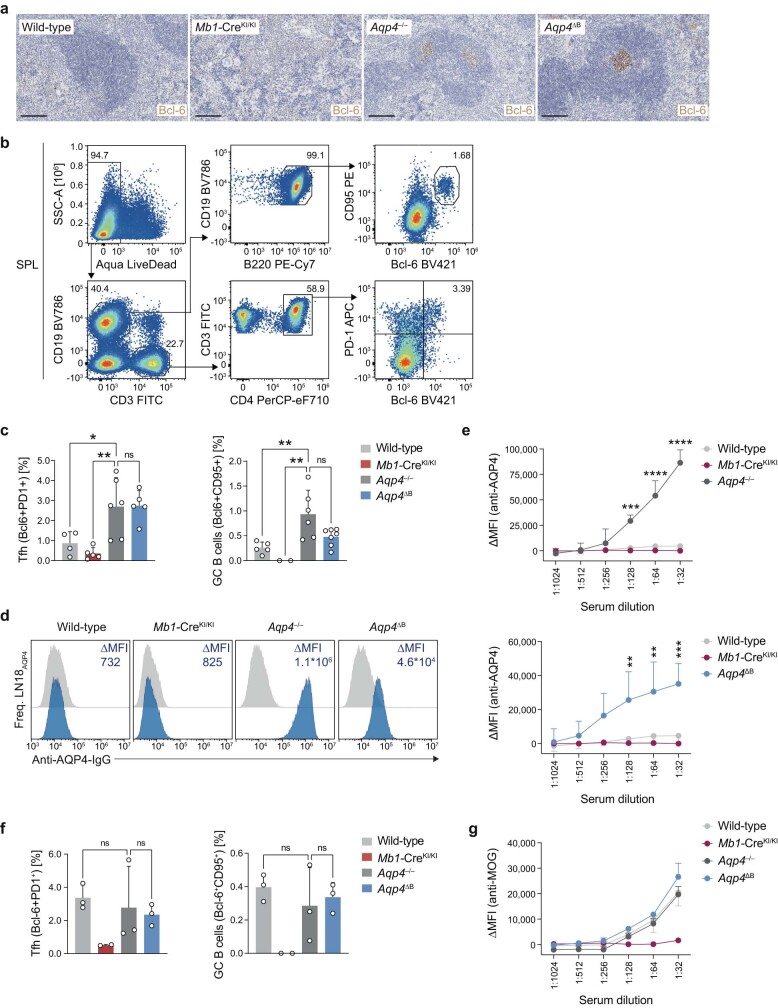
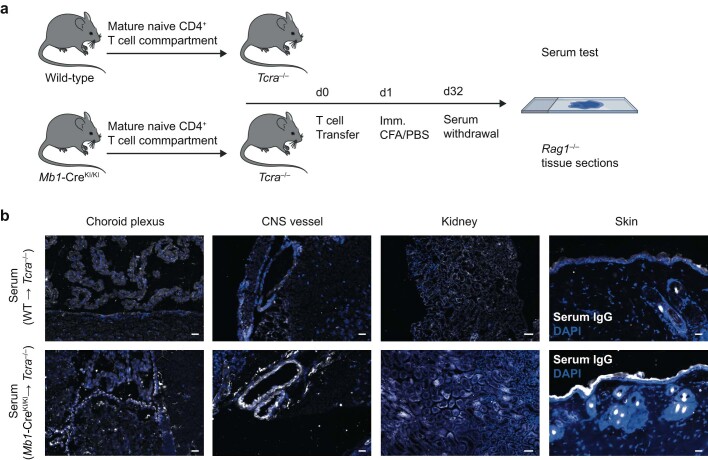
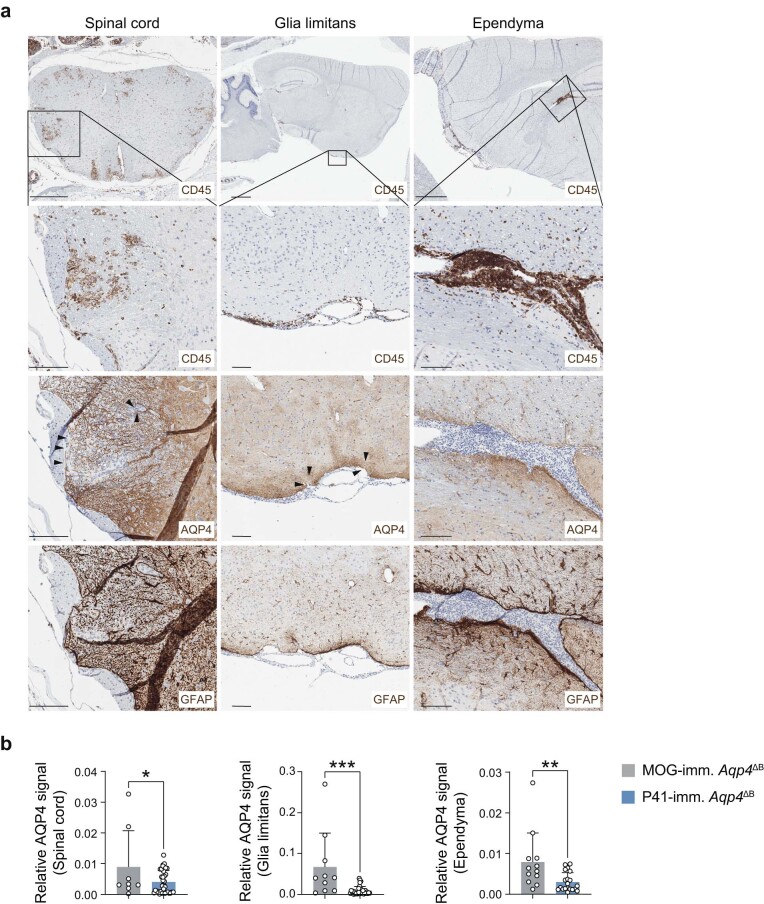
Neuromyelitis optica is a paradigmatic autoimmune disease of the central nervous system, in which the water-channel protein AQP4 is the target antigen1. The immunopathology in neuromyelitis optica is largely driven by autoantibodies to AQP42. However, the T cell response that is required for the generation of these anti-AQP4 antibodies is not well understood. Here we show that B cells endogenously express AQP4 in response to activation with anti-CD40 and IL-21 and are able to present their endogenous AQP4 to T cells with an AQP4-specific T cell receptor (TCR). A population of thymic B cells emulates a CD40-stimulated B cell transcriptome, including AQP4 (in mice and humans), and efficiently purges the thymic TCR repertoire of AQP4-reactive clones. Genetic ablation of Aqp4 in B cells rescues AQP4-specific TCRs despite sufficient expression of AQP4 in medullary thymic epithelial cells, and B-cell-conditional AQP4-deficient mice are fully competent to raise AQP4-specific antibodies in productive germinal-centre responses. Thus, the negative selection of AQP4-specific thymocytes is dependent on the expression and presentation of AQP4 by thymic B cells. As AQP4 is expressed in B cells in a CD40-dependent (but not AIRE-dependent) manner, we propose that thymic B cells might tolerize against a group of germinal-centre-associated antigens, including disease-relevant autoantigens such as AQP4.


Conflict of interest statement

The authors declare no competing interests.

Figures

Fig. 1
Fig. 1. AQP4-competent haematopoietic cells contribute to the negative selection of AQP4-specific T cells.
a, Criss-cross bone marrow (BM) chimeras of WT and Aqp4/ mice were immunized with the I-Ab-restricted epitope of AQP4 (P41) and tested for the frequency of AQP4-specific T cells with an AQP4(205–215)–I-Ab tetramer (P41-10–I-Ab) compared to a control I-Ab tetramer (PLP(9–20)–I-Ab; control I-Ab). Representative cytograms and quantification of absolute P41-10–I-Ab+ T cell counts determined in the spleen and draining lymph nodes (secondary lymphoid tissue (sec LyTi)). Data are mean ± s.d. Statistical analysis was performed using two-tailed t-tests, with WT into WT chimeras used as the reference; *P < 0.05. The symbols indicate biological replicates. Zero values are not depicted in the bar graph due to logarithmic scaling. b, The fraction of thymic B cells. The mean ± s.d. thymic B cell fraction (%) is shown at the top right. n = 7 biological replicates. c, Aqp4 expression in fluorescence-activated cell sorting (FACS)-sorted TECs (live CD45EPCAM+), thymic B cells (live CD45+EPCAMCD19+) and thymic dendritic cells (live CD45+EPCAMCD19CD11c+MHC-IIhigh) normalized to Aqp4 expression in astrocytes. Data are mean ± s.d. relative gene expression (RQ). The symbols indicate biological replicates; zero values are not depicted in the graph due to logarithmic scaling. n.d., not detected in three biological replicates. d, Representative CD19 immunostaining in WT thymus. n = 2 independent experiments. Scale bars, 500 µm (left) and 50 µm (right). e, Triple immunofluorescence staining of CD19, AQP4 and EPCAM in mouse thymus from WT, Aqp4/ and Aqp4ΔB mice. n = 2 independent experiments. Individual channels aligned below a larger merged microphotograph. Scale bars, 5 μm (bottom) and 20 μm (top). f, B cell staining (CD20) in newborn human thymus. Scale bar, 200 μm. gi, Double immunofluorescence staining for CD20 and AQP4 in the human thymus. Scale bars, 50 μm (g), 5 µm (h) and 1 µm (i). g, Overview. h, Magnification of the area marked by the rectangle in g. i, z-axis cross-section along the dashed line indicated in h (top). Bottom, the corresponding signal intensity profile of the immunofluorescence for CD20, AQP4 and DAPI in relation to the distance from the cell centre in µm is shown. n = 2 independent experiments. Source Data
Fig. 2
Fig. 2. B cells are essential in purging the T cell repertoire of AQP4-specific clones.
Aqp4 was genetically ablated in mTECs (Aqp4ΔTEC) and in B cells (Aqp4ΔB) to identify the relevant cellular source of endogenous AQP4 expression for the negative selection of AQP4-specific T cell clones. a,b, Representative cytograms and quantification of absolute P41-10–I-Ab+ T cell counts determined in pooled single-cell suspensions from WT, Aqp4/, Aqp4ΔTEC and Aqp4ΔB spleen and draining lymph nodes (secondary lymphoid tissue, sec LyTi). The symbols indicate pools from individual mice. a, AQP4-specific T cells in the naive repertoire. b, AQP4-specific T cells in P41-immunized mice. Values below 101 are not shown due to logarithmic scaling. c, Quantification of the frequencies of transcription factors FOXP3, RORγt, T-bet and BCL6 in AQP4-specific (Tet+) T cells isolated from the draining lymph nodes (dLN) of P41-immunized WT, Aqp4/, Aqp4ΔTEC and Aqp4ΔB mice as measured using intracellular flow cytometry. Data are mean ± s.d. (the symbols indicate individual mice). Statistical analysis was performed using Kruskal–Wallis tests with Dunn’s post test (a and b) and one-way analysis of variance (ANOVA) with Tukey’s post test (c); **P < 0.01, ***P < 0.001, ****P < 0.0001. Tconv, conventional T cells. d, Generation of mixed bone marrow chimeras in an AQP4-deficient environment, in which the B cell compartment was either deficient (ΔB) or sufficient for AQP4. The diagram was created using Servier Medical Art under a Creative Commons license CC BY 3.0. e, The fraction and quantification of AQP4-specific T cells in the systemic immune compartment in P41-immunized AQP4-deficient mice with AQP4-deficient (n = 3 biological replicates) or AQP4-sufficient (n = 4 biological replicates) B cells. Data are mean ± s.d. Statistical analysis was performed using two-tailed unpaired t-tests. *P < 0.05. Source Data
Fig. 3
Fig. 3. Thymic B cells upregulate AQP4 in a CD40-dependent manner and present it to T cells in the context of MHC-II.
a,b, Uniform manifold approximation and projection (UMAP) representation of scRNA-seq data of B cells sorted from the spleen (SPL), lymph node (LN), bone marrow (BM), thymus (THY) and blood of young adult naive WT mice. a, Annotated Leiden clusters with a resolution of r = 0.7 (top left). Top right, cells colour-coded by organ (a detailed breakdown is provided in Extended Data Fig. 4a). Bottom left, the gene score based on a published gene signature associated with early CD40 responses in B cells. Bottom right, the gene score based on a published gene signature of GC light-zone B cells,. The colour scale indicates relative gene score expression. Leiden cluster 4 is highlighted in all of the panels. b, RNA trajectory inference derived from spliced and unspliced mRNA ratios, as determined by UniTVelo. c, Quantification of the relative gene expression of Aqp4 normalized to primary naive astrocytes. B cell subsets were sorted from unmanipulated WT mice. DN, double negative (IgMIgD); DP, double positive (IgM+IgD+); mem, memory; MZ, marginal zone; n.d., not detected. d, FACS-sorted CD19+ B cells from WT spleens were cultured and stimulated (stim.) for 2 days as indicated. Relative gene expression was normalized to control stimulation with goat anti-human IgG (H+L). e, Human naive (CD19+CD27CD38, naive B cells), memory (CD19+CD27+CD38, Bmem cells) and GC (CD19+CD27+CD38+) B cells were FACS-sorted from human tonsil tissue (n = 4 biological replicates) and AQP4 expression was analysed using qPCR. The symbols represent biological replicates. f, Naive human B cells were sorted from peripheral blood mononuclear cells and stimulated with control fibroblastic feeder cells (YKL) or YKL cells equipped with membrane-bound CD40L (CD40Lg) (n = 8 biological replicates) before assessment of AQP4 expression using qPCR. g,h, Quantification of NFAT–GFP expression in a coculture system with a T cell hybridoma cell line (A5 cells) engineered to express an AQP4-specific TCR and either B cells prestimulated with anti-CD40 plus IL-21 for 2 days (g) or thymic B cell subsets derived from WT and Aqp4/ mice at a ratio of 1:2.5 (h). AG, antigen. For ch, data are mean ± s.d. Statistical analysis was performed using one-way ANOVA with Tukey’s post test (d), two-tailed unpaired t-tests (f) and two-way ANOVA with Sidak’s post test (g and h). The symbols indicate biological replicates. ik, Total RNA was isolated from thymic B cells that were FACS-sorted from WT and Cd40/ mice (n = 5 biological replicates) and processed for bulk RNA-seq analysis. i, PCA analysis. Dim., dimension. j, Volcano plot of genes encoding membrane proteins. Differentially upregulated and downregulated genes in WT versus Cd40/ B cells are highlighted in blue and orange, respectively. Gene labels correspond to the differentially upregulated genes in thymic WT IgM+IgD B cells, which encode structural proteins with known membrane localization. k, Gene set enrichment analysis for cell type signature genes (MSigDB M8) in WT IgM+IgD thymic B cells versus Cd40/ thymic B cells. A selection of significantly (P < 0.05, false-discovery rate (FDR) < 0.25) enriched gene sets (normalized enrichment score (NES)) is shown. Source Data
Fig. 4
Fig. 4. The negative selection of AQP4-specific thymocytes is dependent on AQP4-sufficient B cells in the thymus.
a, Representative cytograms of P41-10–I-Ab+CD4+ single-positive thymocytes in naive WT, Aqp4/, Aqp4ΔTEC, Aqp4ΔB, Mb1-creKI/KI and Cd40/ mice (top). Bottom, corresponding fractions of FOXP3 in AQP4-specific CD4+ single-positive thymocytes. Data are mean ± s.d. b, Quantification of the absolute numbers of P41-10–I-Ab+ CD4+ single-positive thymocytes. Data are mean ± s.d. (symbols indicate biological replicates). Statistical analysis was performed using one-way ANOVA with Dunnett’s post test. c, Mixed bone marrow chimeras were generated by grafting congenically marked Rag1/ bone marrow engineered to retrogenically express an AQP4-specific TCR (clone 6) along with bone marrow from either WT or Aqp4ΔB mice (4:1) into lethally irradiated Aqp4/ recipients and tested 6 weeks after engraftment. The diagram was created using Servier Medical Art under a Creative Commons license CC BY 3.0. d,e, Representative cytograms of the polyclonal and the retrogenic (retro; AQP4-specific) thymic compartment facing a thymic environment equipped with either WT (n = 6 biological replicates) or AQP4-deficient B cells (n = 7 biological replicates) (d) and quantification of the thymic CD4+ single-positive thymocyte fraction (e). Data are mean ± s.d. Statistical analysis was performed using two-way ANOVA with Sidak’s post test. f, Correlation of thymic CD45.2 B cell counts with the retrogenic AQP4-specific TCR clone 6 CD4+ single-positive fraction in the thymus. Statistical analysis was performed using Pearson’s R2 and simple linear regression. The individual symbols represent biological replicates. Source Data
Fig. 5
Fig. 5. AQP4-specific T cell precursor frequencies in Aqp4ΔB mice, but not in Aqp4ΔTEC mice, are sufficient to cause overt autoimmune disease in response to an antigen-specific trigger.
In contrast to WT mice and Aqp4ΔTEC mice, Aqp4ΔB mice were susceptible to EAE after immunization with P41 in CFA (see also Extended Data Fig. 6a–c). a, EAE incidence (left) and mean ± s.e.m. disease severity (right) in all P41-immunized WT, Aqp4ΔTEC and Aqp4ΔB mice. b, EAE incidence in all MOG(35–55)-immunized and P41-immunized WT mice and Aqp4ΔB mice. c, The mean ± s.e.m. disease severity in clinically sick MOG(35–55)-immunized and clinically sick P41-immunized Aqp4ΔB mice. Statistical analysis was performed using Mantel–Cox log-rank tests and two-way ANOVA with Sidak’s post test to compare incidences and disease course, respectively. Only the relevant tests are indicated in b for legibility. d, Representative CD45 stainings of the optic nerve and retina in MOG(35–55)-immunized (left) and P41-immunized Aqp4ΔB mice (right) at the peak of EAE. n = 2 independent experiments. Scale bars, 500 µm (top) and 50 µm (bottom). Source Data
Extended Data Fig. 1
Extended Data Fig. 1. B cells in the thymus.
(a) Gating strategy of Thy1-depleted wild-type thymus for FACS-sorting of thymic epithelial cells (TECs, live CD45EpCAM+), thymic B cells (live CD45+EpCAMCD19+), and thymic dendritic cells (live CD45+EpCAMCD19CD11c+MHC-IIhigh). (b) Representative EpCAM immunostaining in wild-type thymus samples (n = 3 independent experiments, scale bar left 500 µm and right 50 µm). (c) CD19+ B cells (red) in relation to EpCAM-expressing cells (white) in wild-type (leftmost columns) and Aqp4–/– thymus (right column). Middle row: EpCAM-expressing areas (red outlines) and CD19+ B cells (white outlines) are detected in DAPI-stained (blue) wild-type (left columns) and Aqp4–/– thymi (right column). Bottom row: The density of B cells is depicted as a 5-colour heatmap within a radius of 50 μm around CD19+ cells and overlayed on the area of EpCAM-expressing cells. n = 2 independent experiments.
Extended Data Fig. 2
Extended Data Fig. 2. AQP4 and MHC-II expression in thymic B cells and thymic epithelial cells.
(a-d) Analysis of previously published mouse (a, c) and human (b, d) thymic scRNAseq datasets. (a, b) Upper panel: UMAP representation of TEC subsets as selected from the total dataset shown in the upper-left quadrant. The red square indicates the magnified region, and the red circles indicate Aqp4- and AQP4-expressing cells for mouse (a) and human data (b), respectively. Colour code of cells in UMAP as annotated in the table row titles below. Lower panel: Table showing the total population size in the dataset along with the number of Aqp4- and AQP4-expressing cells and (only for these positive cells) their mean expression level of Aqp4 and AQP4, as well as Aire and AIRE, and mean MHC-II score for mouse (a) and human subsets (b), respectively. (c, d) Comparison of MHC-II scores from B cell and TEC subsets irrespective of their Aqp4 or AQP4 status in mouse (c) and human (d). Each circle represents a cell in the dataset. Data shown as mean ± SD. **** P < 0.0001 following one-way ANOVA, specifically Dunnett’s multiple comparison test to compare B cells (n = 207) with all TEC subsets (N as indicated in the corresponding table above) in mouse (c) and Sidak’s multiple comparison test to compare all B cell subsets (n = 2161 for memory, n = 2152 for naive, n = 479 for plasma and n = 290 for pro/pre B cells) with all TEC subsets (n as indicated in the corresponding table above) in human (d). To maintain legibility, only two representative tests were indicated in (d), with naive and memory B cells also outranking all other TEC subsets at the same significance level. (e) Representative histogram overlay of MHC-II expression in TECs and thymic B cells and corresponding quantification. Data are shown as mean fluorescence intensity (MFI) ± SD, two-tailed unpaired t-test, ** P < 0.01. Symbols represent biological replicates. (f) Aqp4 expression in TECs and thymic B cells FACS-sorted from wild-type, Aqp4–/–, Aqp4ΔTEC, and Aqp4ΔB mice. Total RNA was isolated and probed for Aqp4. Aqp4 expression was normalized to astrocytes. Mean relative RQ ± SD. Symbols indicate biological replicates; zero-values are not depicted due to logarithmic scaling. n.d., not detected. Source Data
Extended Data Fig. 3
Extended Data Fig. 3. Gating strategy for the characterization of AQP4-specific T cell phenotypes.
(a) Representative cytograms of stainings for transcription factors Foxp3, ROR-γt, T-bet, and Bcl-6 in all vs. AQP4-specific CD4+ T cells isolated from the spleens of P41-immunized Aqp4–/– mice. A dump channel contained the markers CD11b, CD19, NK1.1, and F4/80. (b,c) Chimerism of the B cell compartment in mixed bone marrow chimeras harbouring AQP4-sufficient or AQP4-deficient B cells. Bone marrow cells from B cell-deficient (ΔB) homozygous Mb1-CreKI/KI x Aqp4–/– mice (CD45.2) and either AQP4-competent wild-type or AQP4-deficient Aqp4–/– mice (CD45.1) (9:1) were grafted into Aqp4–/– mice (CD45.1+/–) to generate mixed bone marrow chimeras (MBMC), in which only B cells were competent in AQP4 expression in an otherwise AQP4-deficient environment. After six weeks, the lymphoid compartments (SPL, spleen; THY, thymus) were fully reconstituted, with the B cell compartment largely derived from the CD45.1+ AQP4-competent or deficient donors, respectively. The diagram in (b) was created using Servier Medical Art under a Creative Commons licence CC BY 3.0.
Extended Data Fig. 4
Extended Data Fig. 4. Thymic B cells are distinct from naïve peripheral B cells and express and present AQP4.
(a) UMAP representation of single-cell RNA sequencing data of B cells sorted from bone marrow (BM), blood, spleen (SPL), lymph nodes (LN), and thymus (THY) of naïve wild-type mice. Left panel: Clusters as determined by Leiden with resolution r = 0.7, shown for cells of all organs. Other panels: Only cells from the respective organs are depicted as indicated. (b) Splenic and thymic B cell subsets were sorted from naïve wild-type mice according to the indicated gating strategy, and total RNA was isolated for quantitative PCR. (c) Relative gene expression (RQ) of myelin oligodendrocyte glycoprotein (MOG) in thymic and splenic B cell subsets (n = 2 biological replicates), normalized to astrocytes (n = 3). Data are shown as mean RQ ± SD. Symbols indicate biological replicates; zero-values are not depicted due to logarithmic scaling. n.d., not detected. (d) NFAT-GFP response as a measure of TCR triggering to titrated P41-concentrations in a coculture system of antigen-presenting cells (APC) and the T cell hybridoma cell line A5 transfected with either AQP4 TCR clone 4 or clone 6 (both n = 2). (e) Representative histogram overlays of NFAT-GFP responses in a coculture system of AQP4-specific TCR clone 6-transfected A5 cells and either wild-type or AQP4-deficient B cells in the absence or presence of exogenous P41. (f) Aire in wild-type and (g) Aqp4 in AireΔB splenic CD19+ B cells stimulated for two days under conditions as indicated. RQ was normalized to control stimulation with goat anti-human IgG (H + L). (h) Quantification of NFAT-GFP expression in a coculture system with a T cell hybridoma cell line (A5 cells) engineered to express an AQP4-specific TCR and B cells prestimulated with anti-CD40 plus IL-21 for two days, derived from wild-type or AireΔB mice (n = 4 biological replicates). All data in (f-h) are shown as mean ± SD and tested with (f) one-way ANOVA and Tukey’s post-test or (g, h) two-way ANOVA and Sidak’s post-test. * P < 0.05, ** P < 0.01. Unless otherwise specified, symbols represent biological replicates. Source Data
Extended Data Fig. 5
Extended Data Fig. 5. CD40 is essential in licensing APC properties in thymic B cells.
(a) Thymic B cells from wild-type, Tcra–/–, and Cd40–/– mice (all n = 5 biological replicates) were characterized for their expression of surface markers IgD, IgM, MHC class II, and CD80. Representative cytograms and histograms of thymic B cell subsets (DP = double positive IgM+IgD+, IgM+IgD, and DN = double negative IgMIgD) are shown along with mean fluorescence intensities (MFI) ± SD of MHC class II and CD80 next to the corresponding histograms. (b) Aqp4 expression in EpCAM+ thymic epithelial cells (TECs) isolated from wild-type and Cd40–/– mice (n = 3 biological replicates). Mean RQ ± SD normalized to astrocytes. (c) Expression of Aqp4 in wild-type IgM+IgD thymic B cells vs. Cd40–/– thymic B cells. Box plot derived from the RNAseq data in Fig. 3i, with the median as the centre, the first and third quartiles as the boundaries of the box, and 1.5 times the IQR as the whiskers. (d) Representative cytograms and quantification of P41/I-Ab-reactive T cells isolated from secondary lymphoid tissue (sec LyTi, spleen plus draining lymph nodes) of P41-immunized Aqp4–/– and Cd40–/– mice (both n = 3 biological replicates) on day 10 after immunization. Data are shown as mean ± SD tested with a two-tailed unpaired t-test, ns = not significant. Source Data
Extended Data Fig. 6
Extended Data Fig. 6. Mature AQP4-specific T cells are not eliminated but expanded in the systemic immune compartment of AQP4-sufficient host mice.
(a-c) Foxp3+ Treg cells were depleted in Aqp4ΔΤΕC x DEREG mice through sequential intraperitoneal (i.p.) injection of diphtheria toxin (DTx) or PBS as a negative control as indicated (both n = 6 biological replicates). Mice were concomitantly immunized with P41 in CFA plus PTx as indicated (a). Immunized mice were weighed (b) and scored (c) daily for 32 days. (d-f) The mature T cell repertoire of Aqp4ΔB mice was transferred into Tcra–/– mice, followed by immunization with full-length AQP4 (n = 10 mice). (d) Incidence and individual disease courses of immunized recipient mice. (e) Representative P41/I-Ab tetramer and Foxp3 stainings in CD4+ T cells isolated from secondary lymphoid tissues (SPL, spleen; dLN, draining lymph node) and the CNS of AQP4-immunized recipient mice with an EAE phenotype. (f) Quantification of the absolute number of P41/I-Ab reactive T cells and the fraction of Foxp3+ cells among antigen-specific T cells shown as mean ± SD. Symbols indicate biological replicates; zero-values are not depicted due to logarithmic scaling (n = 6 biological replicates). The diagram in (a) was created using Servier Medical Art under a Creative Commons licence CC BY 3.0. Source Data
Extended Data Fig. 7
Extended Data Fig. 7. The negative selection of AQP4-specific thymocytes is independent of Aire.
(a-c) Mixed bone marrow chimeras (MBMC) were generated by grafting congenically marked Rag1–/– bone marrow engineered to retrogenically express AQP4-specific TCR clone 6 mixed with bone marrow from either wild-type or Aqp4ΔB mice (4:1) into lethally irradiated Aqp4–/– recipients and tested 6 weeks after engraftment. (a) Representative cytograms of the polyclonal and the retrogenic (AQP4-specific) thymic compartment facing a thymic environment equipped with either wild-type (n = 6 biological replicates) or AQP4 deficient B cells (n = 7 biological replicates). (b, c) CD5 and TCR-β expression in CD4+CD8+ double positive (DP) thymocytes. (b) Representative cytogram overlays and (c) quantification of DP thymocytes from the polyclonal and the retrogenic (AQP4-specific) thymic compartments. Symbols represent biological replicates. (d) MBMCs were generated as described in (a-c) with wild-type (n = 4 biological replicates) and AireΔB (n = 3 biological replicates) donor mice (4:1). (e) Quantification of the thymic CD4+ single positive (SP) fraction. Data in (c, e) are shown as mean ± SD and tested with two-way ANOVA and Sidak’s post-test. *** P < 0.001, **** P < 0.0001. ns = not significant. The diagram in (d) was created using Servier Medical Art under a Creative Commons licence CC BY 3.0. Source Data
Extended Data Fig. 8
Extended Data Fig. 8. Characterization of germinal centre responses to full-length AQP4 immunization.
Wild-type, B cell-deficient (Mb1-CreKI/KI), Aqp4–/–, and Aqp4ΔB mice were immunized with full-length AQP4 or human recombinant full-length MOG protein and tested for germinal centre (GC) responses on d12 after immunization. (a) Representative immunostainings of Bcl-6 in spleens of full-length AQP4-immunized mice (n = 2 independent experiments, scale bar 100 µm). (b) Representative cytograms and gating strategy of splenic Tfh cells (live CD19CD3+CD4+Bcl-6+PD-1+) and GC B cells (live CD19+CD3B220+Bcl-6+CD95+). (c) Flow cytometric quantification of splenic Tfh cell and GC B cell frequencies in spleens of AQP4-immunized wild-type, B cell-deficient (Mb1-CreKI/KI), Aqp4–/–, and Aqp4ΔB mice. (d, e) The AQP4-specific serum response was tested with serial dilutions in a cell-based assay with sera isolated prior to (d-1) and on d21 after immunization with full-length AQP4. (d) Representative histograms of the anti-AQP4-serum response tested in LN18AQP4 cells at d-1 (grey histograms) and d21 (blue histograms). (e) Quantification of the anti-AQP4-serum response for Aqp4–/– (n = 2, upper panel) and Aqp4ΔB (n = 3, lower panel) alongside wild-type (n = 4) and Mb1-CreKI/KI (n = 2, depicted in both panels for reference), tested in serial dilutions as indicated on the x-axis. (f) Quantification of Tfh cell and GC B cell frequencies in secondary lymphoid tissues of MOG protein-immunized wild-type (n = 3), B cell-deficient Mb1-CreKI/KI (n = 2), Aqp4–/– (n = 3), and Aqp4ΔB (n = 3) mice. (g) The MOG-specific serum response was tested with serial dilutions in a cell-based assay with sera isolated on d-1 and d21 after immunization with full-length MOG protein. Quantification of the anti-MOG-serum response tested in serial dilutions as indicated on the x-axis. Data in (c, f) are shown as mean ± SD and tested by one-way ANOVA with Tukey’s post-test. Data in (e, g) are shown as delta mean fluorescence intensity (ΔMFI = MFId21 – MFId-1) ± SD and tested by two-way ANOVA with Sidak’s post-test. * P < 0.05, ** P < 0.01, *** P < 0.001, **** P < 0.0001. ns = not significant. Symbols indicate biological replicates. Source Data
Extended Data Fig. 9
Extended Data Fig. 9. The T cell compartment educated in B cell-deficient mice facilitates the generation of autoantibodies.
(a) Mature CD4+ cells from either wild-type or B cell-deficient Mb1-CreKI/KI mice were transferred intravenously (i.v.) into Tcra–/– recipient mice (d0) followed by subcutaneous immunization with PBS and CFA on the day after transfer (d1). Sera were collected on d32 after immunization and tested for autoantibodies (IgG) on cryosections of different organs dissected from Rag1–/– mice using a secondary anti-mouse IgG (H + L) antibody. (b) Representative immunofluorescence stainings from various anatomical niches (choroid plexus, CNS vessel, kidney, skin) of n = 3 independent wild-type-educated sera and n = 4 independent Mb1-CreKI/KI-educated sera. Scale bar = 20 µm (except kidney: 50 μm). The diagram in (a) was created using Servier Medical Art and BioRender under a Creative Commons licence CC BY 3.0.
Extended Data Fig. 10
Extended Data Fig. 10. AQP4-directed autoimmunity in mice recapitulates histological hallmarks of NMOSD.
(a) Representative CD45, AQP4, and GFAP stainings of the spinal cord, cerebellum, and ependyma of P41-immunized Aqp4ΔB mice at the peak of EAE (scale bars top row 1 mm except for spinal cord 200 µm, all other rows 100 µm). (b) AQP4 loss was determined in a semi-quantitative approach normalized to the extent of adjacent CNS lesions defined by CD45+ immunoreactivity. The AQP4 signal was calculated by QuPath’s positive pixel count algorithm in the adjacent area with a defined radius of 100 µm with respect to CD45+ infiltrates (region of interest). Data are shown as mean ± SD and tested with a two-tailed unpaired t-test. * P < 0.05, ** P < 0.01, *** P < 0.001. Symbols represent individual CNS lesions detected in two biological replicates for each group. Source Data

References

    1. Lennon, V. A., Kryzer, T. J., Pittock, S. J., Verkman, A. S. & Hinson, S. R. IgG marker of optic-spinal multiple sclerosis binds to the aquaporin-4 water channel. J. Exp. Med.202, 473–477 (2005). 10.1084/jem.20050304 - DOI - PMC - PubMed
    1. Papadopoulos, M. C. & Verkman, A. S. Aquaporin 4 and neuromyelitis optica. Lancet Neurol.11, 535–544 (2012). 10.1016/S1474-4422(12)70133-3 - DOI - PMC - PubMed
    1. Damato, V. et al. Rituximab abrogates aquaporin-4-specific germinal center activity in patients with neuromyelitis optica spectrum disorders. Proc. Natl Acad. Sci. USA119, e2121804119 (2022). 10.1073/pnas.2121804119 - DOI - PMC - PubMed
    1. Zephir, H. et al. Is neuromyelitis optica associated with human leukocyte antigen? Mult. Scler.15, 571–579 (2009). 10.1177/1352458508102085 - DOI - PubMed
    1. Varrin-Doyer, M. et al. Aquaporin 4-specific T cells in neuromyelitis optica exhibit a Th17 bias and recognize Clostridium ABC transporter. Ann. Neurol.72, 53–64 (2012). 10.1002/ana.23651 - DOI - PMC - PubMed

MeSH terms