. 2024 Mar;627(8004):594-603.
doi: 10.1038/s41586-024-07067-y. Epub 2024 Feb 21.

WNT signalling control by KDM5C during development affects cognition

Affiliations

WNT signalling control by KDM5C during development affects cognition

Violetta Karwacki-Neisius et al. Nature. 2024 Mar.

Abstract

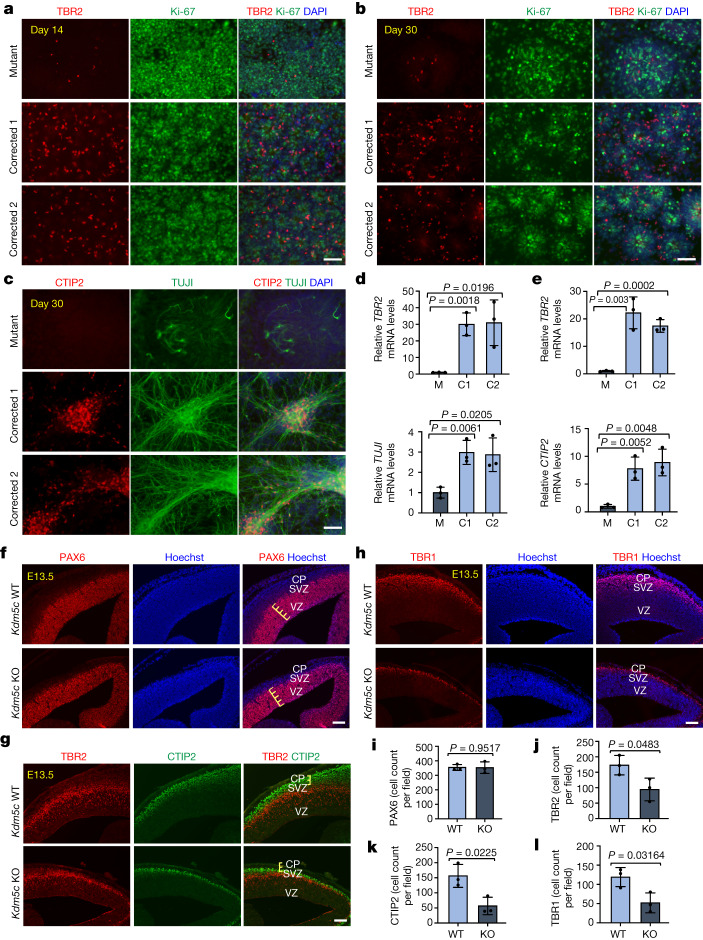
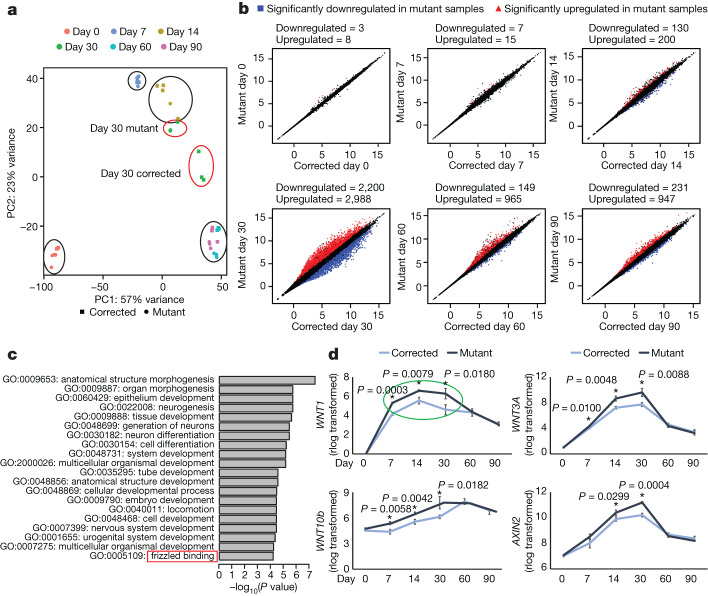
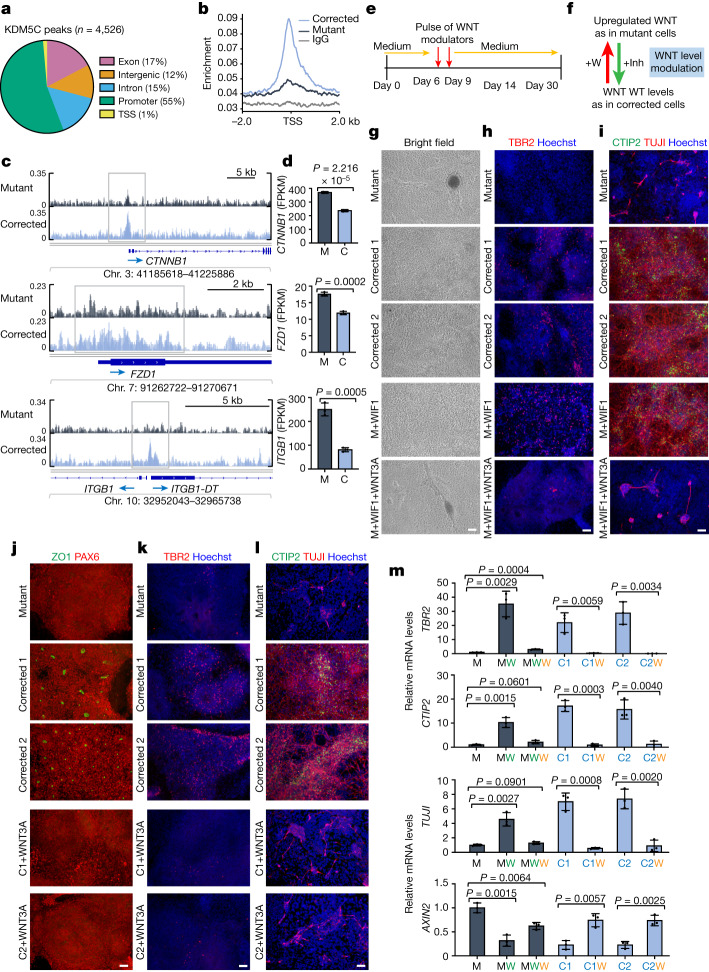
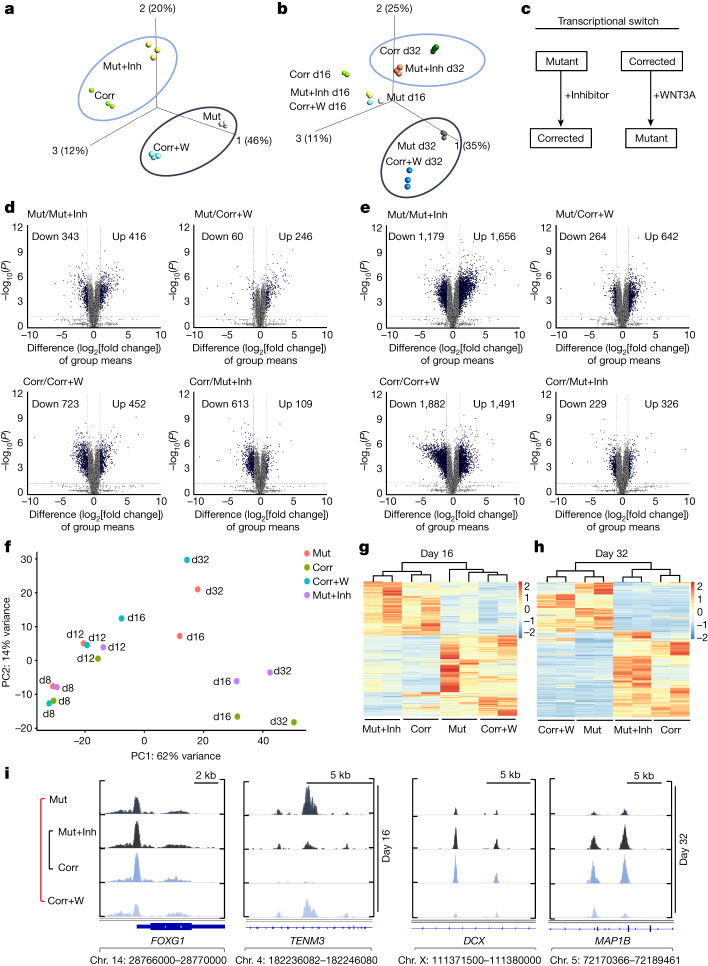
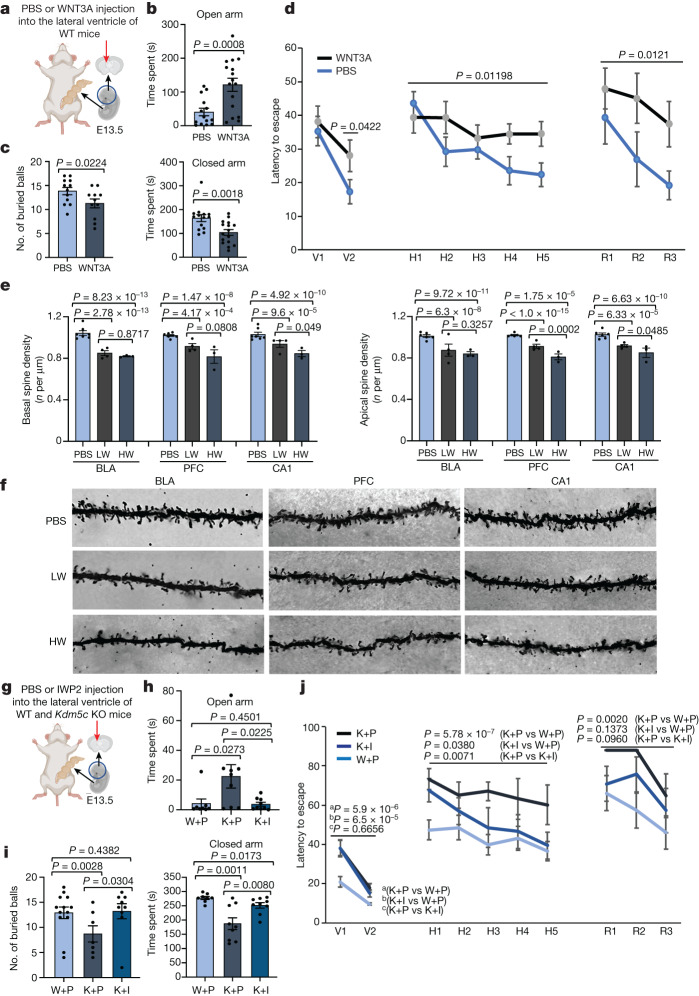
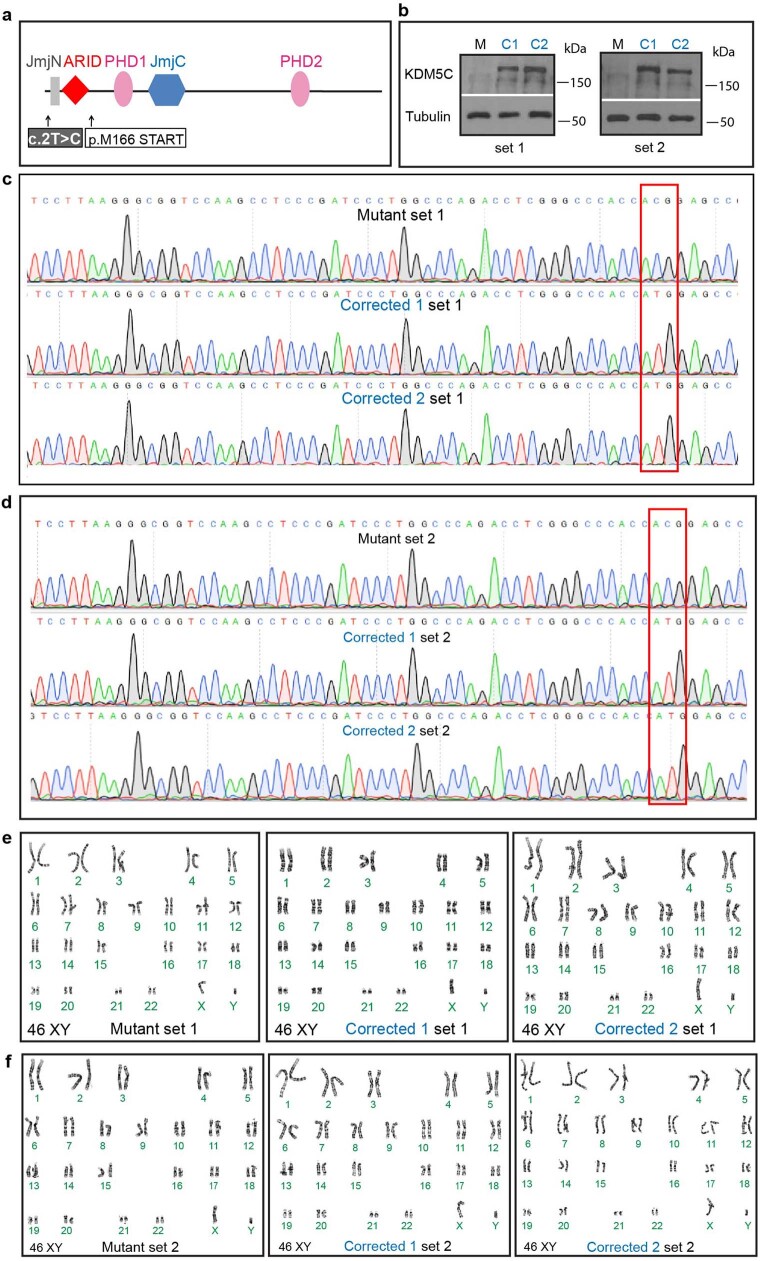
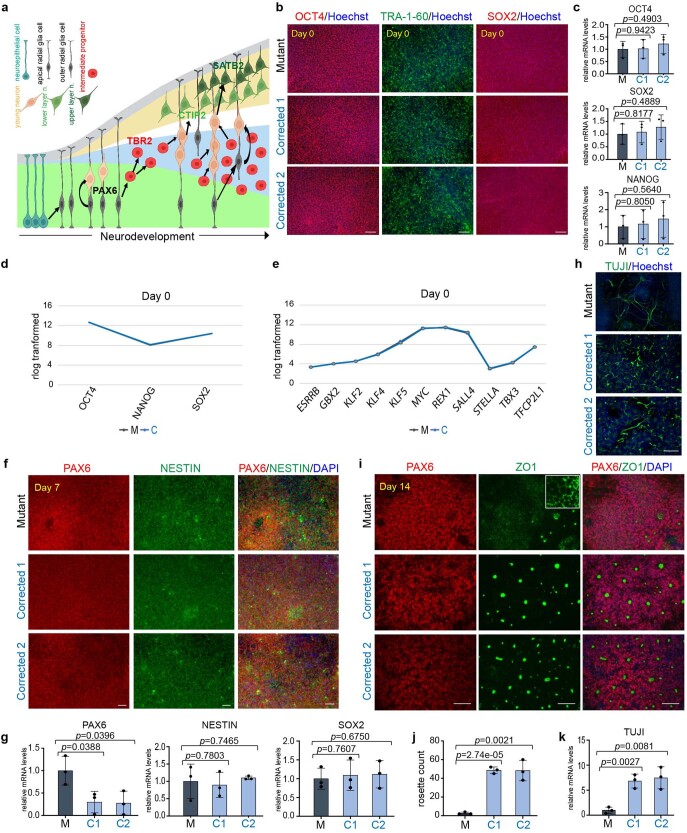
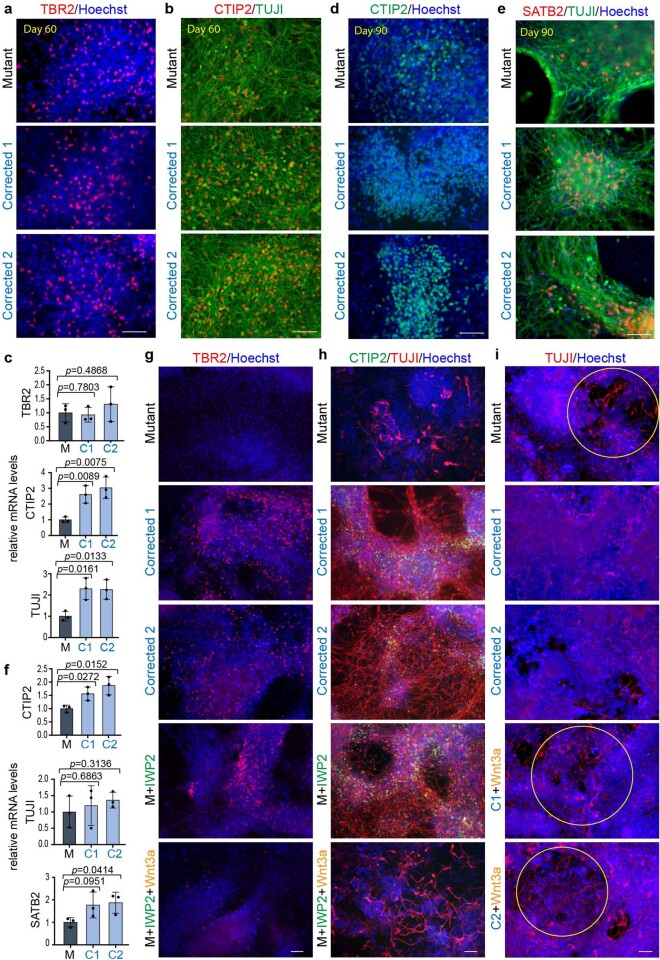
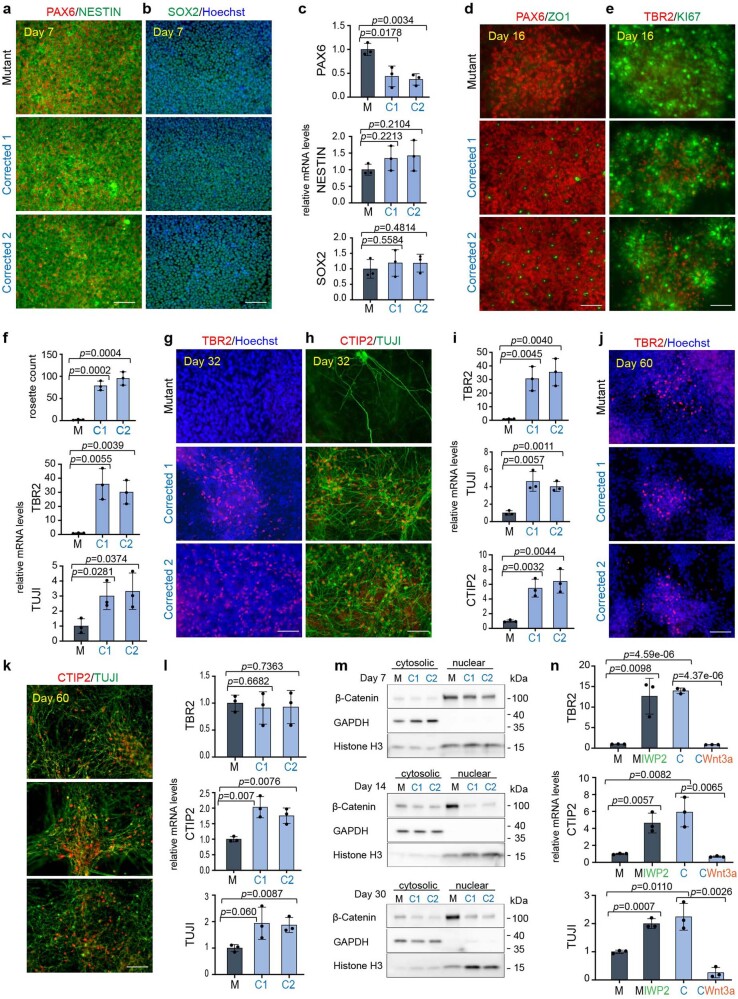
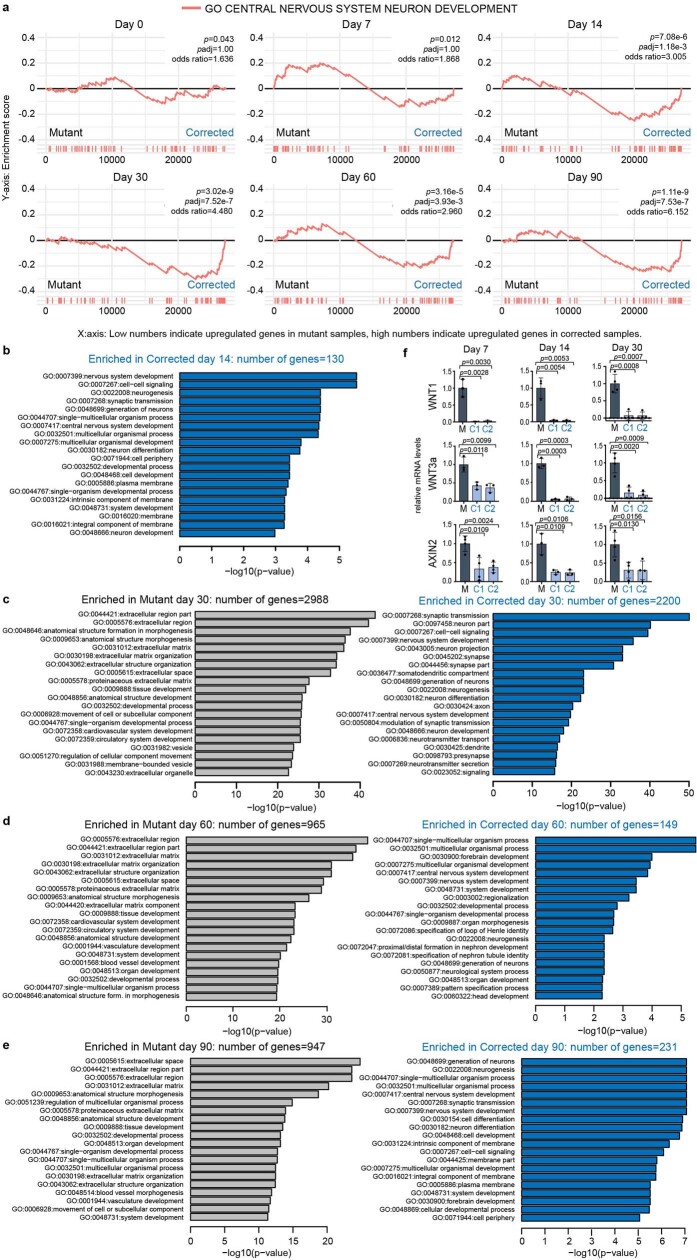
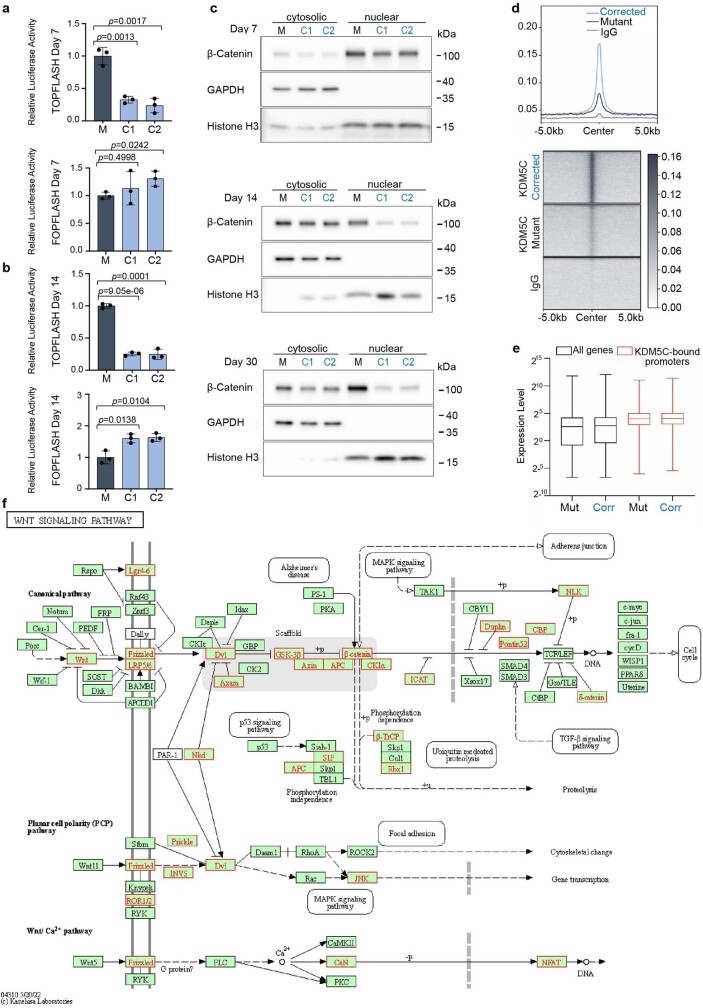
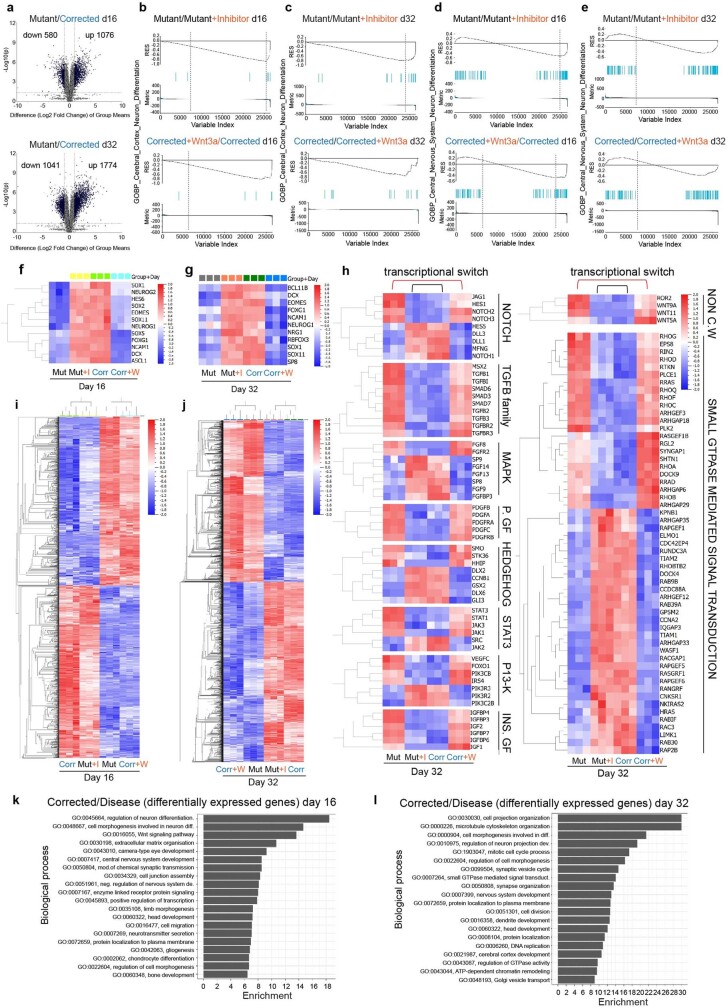
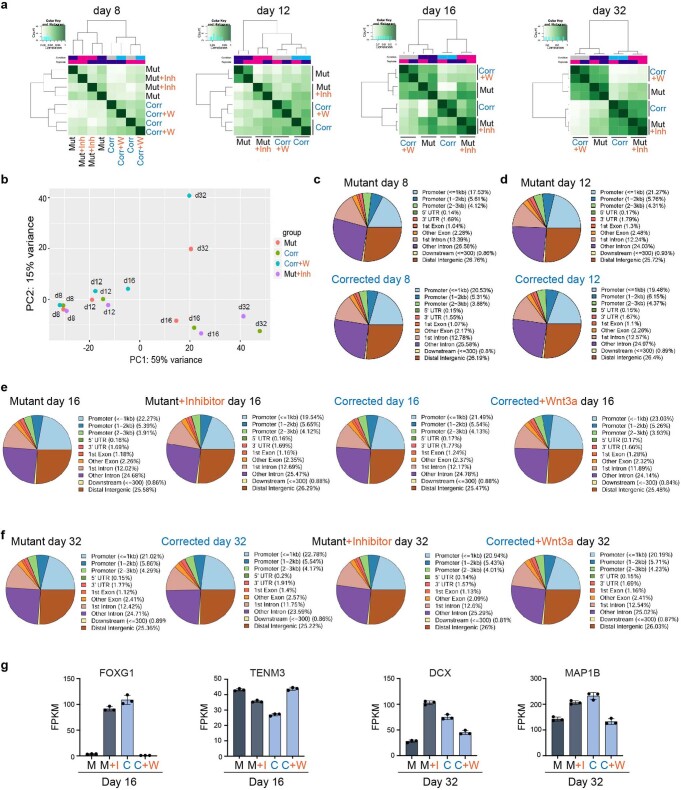
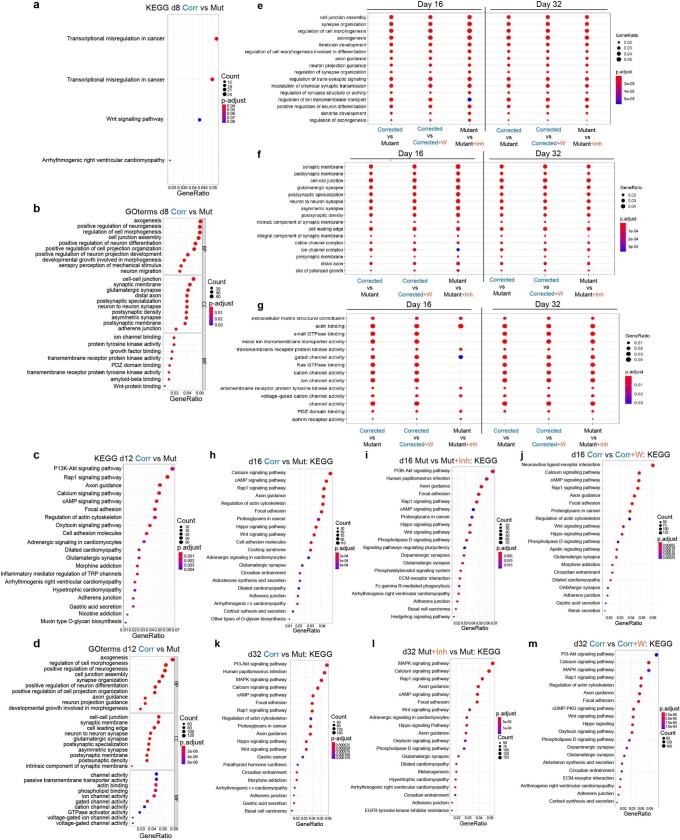
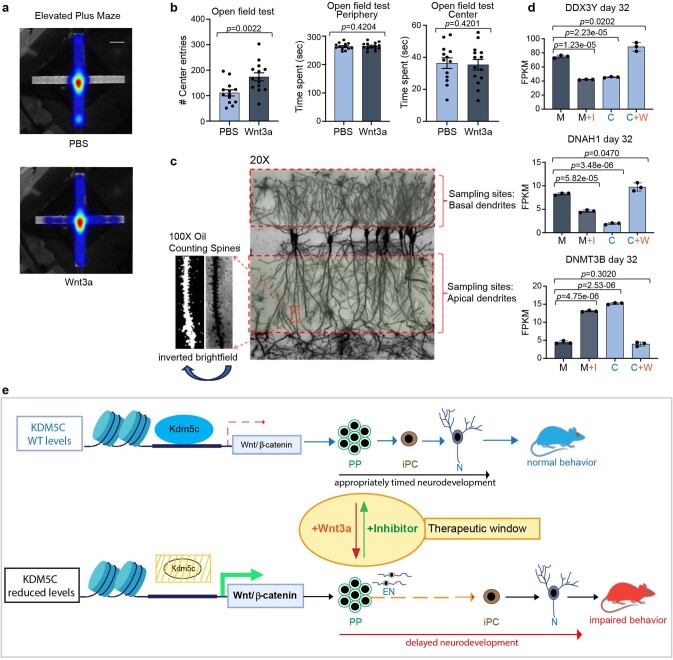
Although KDM5C is one of the most frequently mutated genes in X-linked intellectual disability1, the exact mechanisms that lead to cognitive impairment remain unknown. Here we use human patient-derived induced pluripotent stem cells and Kdm5c knockout mice to conduct cellular, transcriptomic, chromatin and behavioural studies. KDM5C is identified as a safeguard to ensure that neurodevelopment occurs at an appropriate timescale, the disruption of which leads to intellectual disability. Specifically, there is a developmental window during which KDM5C directly controls WNT output to regulate the timely transition of primary to intermediate progenitor cells and consequently neurogenesis. Treatment with WNT signalling modulators at specific times reveal that only a transient alteration of the canonical WNT signalling pathway is sufficient to rescue the transcriptomic and chromatin landscapes in patient-derived cells and to induce these changes in wild-type cells. Notably, WNT inhibition during this developmental period also rescues behavioural changes of Kdm5c knockout mice. Conversely, a single injection of WNT3A into the brains of wild-type embryonic mice cause anxiety and memory alterations. Our work identifies KDM5C as a crucial sentinel for neurodevelopment and sheds new light on KDM5C mutation-associated intellectual disability. The results also increase our general understanding of memory and anxiety formation, with the identification of WNT functioning in a transient nature to affect long-lasting cognitive function.


Conflict of interest statement

Y.S. is a co-founder and board member of Alternative Bio (ABio). Y.S. is also a board member of Epigenica and a member of the Scientific Advisory Board of Epic Bio, the School of Life Sciences and Westlake Laboratory of Life Sciences and Biomedicine, Westlake University, China, and the Centre for Embryology and Healthy Development, Norway. Y.S. holds equity in Active Motif, K36 Therapeutics, Epic Bio, ABio and Epigenica. All other authors declare no competing interests.

Figures

Fig. 1
Fig. 1. KDM5C mutations lead to inefficient entry into the intermediate progenitor state and delayed neuron generation.
ac, Immunofluorescence images of TBR2 and Ki-67 at day 14 (a) and day 30 (b) and of CTIP2 and TUJI at day 30 (c) of neuronal differentiation in mutant (M) and two corrected cell lines (C1 and C2). More than three independent experiments were performed with similar results. d,e, qPCR analysis of TBR2 and TUJI at day 14 (d) and TBR2 and CTIP2 at day 30 (e). Data represent the mean ± s.d. of three independent experiments. fh, Immunofluorescence images of PAX6 (f), TBR2 and CTIP2 (g) and TBR1 (h) in WT (Kdm5c WT) and Kdm5c KO mouse cortices at E13.5 of development. Cells were counterstained with Hoechst. Three independent experiments were performed with similar results. CP, cortical plate; SVZ, subventricular zone; VZ, ventricular zone. il, Positive cell count for PAX6 (i), TBR2 (j), CTIP2 (k) and TBR1 (l) in Kdm5c WT and Kdm5c KO mouse cortices. Three independent fields were assessed and reproduced in three Kdm5c WT and three Kdm5c KO animals. Data represent the mean ± s.d. For d,e,il, P values were calculated using two-tailed unpaired Student’s t-test; P < 0.05 was considered significant. Scale bars, 100 µm (ac,fh). Source Data
Fig. 2
Fig. 2. Transcriptome profiling and GSEA during neuronal differentiation.
a, PCA of gene expression data from mutant and corrected cells using the top 1,000 genes with the highest variance across samples. Samples collected from different days during the 90-day differentiation protocol are indicated with different colours. Day 30 samples are highlighted with red circles. b, Scatter plots of normalized (rlog transformed) gene expression estimates for days 0, 7, 14, 30, 60 and 90. The numbers of significantly downregulated or upregulated genes are indicated on the top (log2(fold change) ≥ 1, P ≤ 0.05). c, GO enrichment analysis showing genes that are upregulated in mutant cells at day 14. P values were obtained using goseq and adjusted for multiple testing. Red box highlights the GO term ‘frizzled binding’. d, rlog-transformed expression (y axis) levels of WNT1, WNT3A, WNT10B and AXIN2 extracted from RNA-seq data at the indicated days (x axis) in mutant and corrected cells. Data represent the mean ± s.d. of three independent experiments. P values were calculated using two-tailed unpaired Student’s t-test; P < 0.05 was considered significant. Source Data
Fig. 3
Fig. 3. Delayed neuronal differentiation was mimicked or rescued by transient WNT–β-catenin modulation.
a, Genomic distribution of KDM5C-binding events in corrected cells (CUT&RUN analysis on day 16). TSS, transcription start site. b, KDM5C enrichment profiles at promoter regions of genes. c, Integrative genomic viewer (IGV) snapshot of KDM5C-binding peaks at WNT-associated genes. d, Fragments per kilobase of transcript per million fragments mapped (FPKM) expression values extracted from RNA-seq data at day 16 for the presented WNT-associated genes. e, Scheme of the treatment strategy. Compounds were added on day 6 and day 9. On day 12, cells were washed and supplied with standard medium (Medium) that does not contain compounds. f, Schematic of the goal of treatment. Addition of WNT3A (+W) to corrected cells aimed to mimic WNT levels observed in mutant cells, surpassing WT levels that were considered optimal. Addition of a WNT inhibitor (+Inh) sought to reduce WNT to WT levels in mutant cells. gi, Brightfield images (g) and immunofluorescence images of TBR2 (h) and for CTIP2 and TUJI (i) in mutant cells and corrected cells at day 30, which were treated transiently with vehicle (mutant (M), corrected 1 and corrected 2), WIF1 (1 µg ml–1; M+WIF1) or a combination of WIF1 (1 µg ml–1) and WNT3A (200 ng ml–1) (M+WIF1+WNT3A). jl, Immunofluorescence analyses at day 30 of ZO1 and PAX6 (j), TBR2 (k) and CTIP2 and TUJI (l) and Hoechst. Corrected clones (C1 and C2) were transiently treated with recombinant WNT3A. m, qPCR analyses of TBR2, CTIP2, TUJI and AXIN2 mRNA levels at day 30. Green W, WIF1; orange W, WNT3A. For d and m, data represent the mean ± s.d. of three independent experiments. P values were calculated using two-tailed unpaired Student’s t-test; P < 0.05 was considered significant. For gl, more than three independent experiments were performed with similar results. Scale bars, 100 µm (gl). Source Data
Fig. 4
Fig. 4. Transient modulation of the WNT–β-catenin signalling pathway reprograms the transcriptomic and chromatin landscapes.
a,b, PCA plots of gene expression data from mutant cells (Mut), mutant cells treated with the WNT inhibitor IWP2 (1 µM (first pulse) and then 0.25 µM (second pulse)) (Mut+Inh), corrected cells (Corr) and corrected cells treated with WNT3A (200 ng ml–1) (Corr+W) using all 26,830 genes (iGenome UCSC hg38) in our dataset at day 16 (a) and day 32 (d32) (day 16 (d16) results also included) (b) of neuronal differentiation. c, Mutant cells exhibit a global transcriptomic change, referred to as reprogramming, towards the profile of corrected cells after brief WNT inhibitor treatment. Conversely, corrected cells undergo transcriptional reprogramming to mirror the mutant cell transcriptome following transient treatment with recombinant WNT3A protein. d,e, Volcano plots at day 16 (d) and day 32 (e) (log2(fold change) ≥ 1 and P ≤ 0.01) for transcripts detected by RNA-seq analysis. Top, mutant lines are compared with either mutant + inhibitor cells (left) or corrected + WNT3A cells (right). Bottom, corrected cells are compared either to corrected + WNT3A cells or mutant + inhibitor cells. Cut-off at P value = 0.05 and log2(fold change) = ±1. P values for two-group comparison were calculated using two-sided Student’s t-test. f, PCA of ATAC–seq data from mutant cells, mutant cells treated with the WNT inhibitor IWP2 (1 µM (first pulse) then 0.25 µM (second pulse)), corrected cells and corrected cells treated with WNT3A (200 ng ml–1) using all peaks in the genome at days 8, 12, 16 and 32 of neuronal differentiation. g,h, Heatmaps representing open chromatin regions (false discovery rate (FDR) ≤ 0.05) between the indicated cell lines at day 16 (g) and day 32 (h). i, IGV snapshot of open chromatin peaks (ATAC–seq) between the indicated cell lines at days 16 and 32 of differentiation.
Fig. 5
Fig. 5. A single WNT3A injection induces and WNT inhibition rescues KDM5C-associated ID phenotypes.
a, Schematic of the experiment. PBS or recombinant WNT3A (50 ng) was injected into the lateral ventricle of WT E13.5 embryos. b, Elevated-plus maze anxiety test. n = 14 (PBS treated) and n = 16 (WNT3A treated) mice. c, Marble-burying test in PBS-injected mice (n = 12) and WNT3A-injected mice (n = 11). Data for b and c represent the mean ± s.e.m. P values calculated using one-tailed unequal variance t-test. d, Morris water maze escape latency test. One-tailed unequal variance t-test for results from the visible platform condition (V1 and V2) and two-way analysis of variance (ANOVA) for the hidden platform (H1–H5) and reversal (R1–R3) conditions were performed. P values are indicated. Data are presented as the mean ± s.e.m. n = 15 (PBS injected) and n = 17 (WNT3A injected) mice. e, At E13.5, WT embryos were injected with PBS, a low dose of WNT3A (33 ng; LW) or a high dose of WNT3A (50 ng; HW). Spine density in the basolateral amygdala (BLA), prefrontal cortex (PFC) and CA1 of the hippocampus was analysed (number of spines per µm). One-way ANOVA followed by Tukey’s multiple comparison test is presented based on single measurements averaged for each group. P values are indicated. Data are expressed as the mean ± s.e.m. of average values for each mouse. n = 7 (PBS) mice for basal spine density, n = 6 (PBS) mice for apical spine density, n = 4 mice for LW treatment and n = 3 mice for HW treatment. f, Representative dendritic segments from BLA, PFC, and CA1 regions in mice treated with PBS or with a high or low dose of WNT3A. g, Schematic of injections in E13.5 WT (PBS) and Kdm5c KO embryos (PBS or the WNT inhibitor IWP2 (9.34 ng)). h, Elevated plus maze anxiety test. Number of mice analysed: 8 WT + PBS (W+P), 9 KO + PBS (K+P) and 9 KO + IWP2 (K+I). i, Marble-burying test. Number of mice analysed: 13 WT + PBS, 7 KO + PBS and 9 KO + IWP2. Data for h and i are presented as the mean ± s.e.m. P values were calculated using one-tailed unequal variance t-test. j, Morris water maze escape latency test. Two-way ANOVA for V1–V2, H1–H5 and R1–R3 was performed. P values are indicated. Data are expressed as the mean ± s.e.m. n = 12 WT + PBS, 7 KO + PBS and 9 KO + IWP2 mice. P < 0.05 was considered significant. Details provided in the Methods. Illustrations in a and g were created using BioRender (https://www.biorender.com). Source Data
Extended Data Fig. 1
Extended Data Fig. 1. Isogenic correction of the c.2T>C in patient iPSC lines.
a, Schematic representation of the KDM5C protein structure. Domains and the location of patient c.2T>C mutation are indicated. M166 is the predicted, alternative translational start codon for patients with the c.2T>C mutation. b, Western Blot analysis for KDM5C protein in patient Mutant (M) and Corrected (C1 and C2) cells in brother 1 (left, set 1) and brother 2 (right, set 2). 2 independent experiments with similar results were performed. Gels were run separately to see the entire lane stained with the KDM5C antibody in order to determine if there are any non-specific cross-reactivities of the KDM5C antibodies by comparing the Corrected cells with Mutant cells. For gel source data see Supplementary Fig. 1. c, Sanger sequencing results showing correction (red box) of the Mutation sequence (ACG) to the WT sequence (ATG) in Corrected 1 and Corrected 2 lines of brother 1 (set 1) and (d) brother 2 (set 2). e, Karyotype analysis of Mutant and Corrected 1 and Corrected 2 cells of brother 1 (set 1) and (f) brother 2 (set 2).
Extended Data Fig. 2
Extended Data Fig. 2. KDM5C mutation leads to a delay in neuronal differentiation.
a, Simplified schematics depicting the temporal and spatial appearance of main neuronal cell types during early cortex development. Arrows indicate lineage relationships. Neuroepithelial cells give rise to apical radial glia cells (Pax6+) that initially divide symmetrically to generate daughter cells. During the neurogenic phase however, most apical radial glia cells divide asymmetrically and give rise to a neuron or to intermediate progenitor cells. Intermediate progenitor cells divide symmetrically in the subventricular zone to generate two daughter cells that migrate towards the CP to generate neurons. Depending on the stage of development intermediate progenitor cells can give rise to either lower layer (CTIP2+) or upper layer (SATB2+) neurons. Graph was adapted from and created with BioRender. b, Immunofluorescence analysis for OCT4, TRA-1-60 and SOX2 in Mutant and Corrected lines at day 0 of neuronal differentiation. Cells were counterstained with Hoechst. More than 3 independent experiments were performed with similar results. c, qPCR analysis of OCT4, SOX2 and NANOG mRNAs in Mutant (M) and Corrected lines (C1 and C2). Data are represented as mean ± SD of 3 independent experiments. The p-values by two-tailed unpaired Student’s t-test are indicated. P < 0.05 was considered statistically significant. d, Rlog transformed expression intensities for OCT4, NANOG and SOX2 mRNAs and (e) eleven further pluripotency-related genes in the Mutant (M) and Corrected (C) line, extracted from RNA-seq data. f, Immunofluorescence for PAX6 and NESTIN at day 7 of neuronal differentiation in Mutant and two Corrected lines. Cells were counterstained with Dapi. More than 3 independent experiments were performed with similar results. g, qPCR analysis for PAX6, NESTIN and SOX2 mRNAs at day 7. Elevation of PAX6 levels together with the phenotype described in (h) were the first phenotypic difference observed in our data set. Data are represented as mean ± SD of 3 independent experiments. The p-values by two-tailed unpaired Student’s t-test are indicated. P < 0.05 was considered statistically significant. h, Immunofluorescence for TUJI at day 11 of neuronal differentiation in Mutant and Corrected lines. Cells were counterstained with Hoechst. At day 11, a transient increase in neuronal processes was observed in the early neurons that appeared in Mutant cells. This was a short and transient phenotype that lasted for about 3 days and that affected a small number of cells. More than 3 independent experiments were performed with similar results. This data is related to Extended Data Fig. 3i that shows that this phenotype is dependent on Wnt/β-catenin signaling. i, Immunofluorescence for PAX6 and ZO1 at day 14 of neuronal differentiation in Mutant and two Corrected lines. Cells were counterstained with Dapi. More than 3 independent experiments were performed with similar results. j, rosette count in Mutant (M) and Corrected lines (C1 and C2). Data are represented as mean ± SD of 3 independent experiments. The p-values by two-tailed unpaired Student’s t-test are indicated. P < 0.05 was considered statistically significant. k, qPCR analysis of TUJI mRNAs in Mutant (M) and Corrected lines (C1 and C2). Data are represented as mean ± SD of 3 independent experiments. The p-values by two-tailed unpaired Student’s t-test are indicated. P < 0.05 was considered statistically significant. Scale bars, 100 µm. Source Data
Extended Data Fig. 3
Extended Data Fig. 3. KDM5C patient mutation leads to a delay in neuronal differentiation and delayed differentiation can be rescued by transient downregulation of WNT/β-catenin signaling in patient Mutant cells.
a, Immunofluorescence for TBR2 and (b) CTIP2 and TUJI at day 60 of neuronal differentiation in patient Mutant and Corrected lines. Cells were counterstained with Hoechst. More than 3 independent experiments were performed with similar results. Scale bars, 100 µm. c, qPCR analysis of TBR2, CTIP2 and TUJI mRNAs in Mutant (M) and Corrected lines (C1 and C2) at day 60. Data are represented as mean ± SD of 3 independent experiments. The p-values by two-tailed unpaired Student’s t-test are indicated. P < 0.05 was considered statistically significant. d, Immunofluorescence for CTIP2 and (e) SATB2 and TUJI at day 90 of neuronal differentiation in Mutant and Corrected lines. Cells were counterstained with Hoechst. More than 3 independent experiments were performed with similar results. Scale bars, 100 µm. f, qPCR analysis of CTIP2, TUJI and SATB2 mRNAs in Mutant (M) and Corrected lines (C1 and C2) at day 90. Data are represented as mean ± SD of 3 independent experiments. The p-values by two-tailed unpaired Student’s t-test are indicated. P < 0.05 was considered statistically significant. g, Immunofluorescence analysis for TBR2 and (h) CTIP2 and TUJI in patient Mutant and Corrected lines at day 30 of neuronal differentiation, which have been treated transiently either with vehicle (Mutant (M), Corrected 1 and Corrected 2), IWP2 (1 mM (first pulse)/0.25 mM (second pulse)) or a combination of IWP2 (1 mM) and Wnt3a (200 ng/ml). More than 3 independent experiments were performed with similar results. i, Immunofluorescence for TUJI at day 11 of neuronal differentiation in Mutant and Corrected lines. Cells were counterstained with Hoechst. Corrected cells cultured with Wnt3a (200 ng/ml) show regions of greater axonal outgrowth similarly as observed in Mutant cells at this time of differentiation. More than 3 independent experiments were performed with similar results. This data is related to Extended Data Fig. 2h. Abbreviations: C1=Corrected 1, C2=Corrected. Source Data
Extended Data Fig. 4
Extended Data Fig. 4. KDM5C mutation leads to a delay in neuronal differentiation and can be rescued and induced by canonical Wnt signaling manipulation in the second brother.
a, Immunofluorescence for PAX6, NESTIN and (b) SOX2 at day 7 of neuronal differentiation in Mutant and two Corrected lines of brother 2. Cells were counterstained with Hoechst. 3 independent experiments were performed with similar results. c, qPCR analysis for PAX6, NESTIN and SOX2 mRNAs at day 7 in the second brother. Data are represented as mean ± SD of 3 independent experiments. The p-values by two-tailed unpaired Student’s t-test are indicated. P < 0.05 was considered statistically significant. d, Immunofluorescence for PAX6, ZO1 and (e) TBR2 and KI67 at day 16 of neuronal differentiation in Mutant and two Corrected lines of brother 2. 3 independent experiments were performed with similar results. f, Rosette count in Mutant (M) and Corrected lines (C1 and C2) (top) and qPCR analysis for TBR2 and TUJI mRNAs at day 16 in the second brother. Data are represented as mean ± SD of 3 independent experiments. The p-values by two-tailed unpaired Student’s t-test are indicated. P < 0.05 was considered statistically significant. g, Immunofluorescence for TBR2 and (h) CTIP2 and TUJI at day 32 of neuronal differentiation in Mutant and two Corrected lines of brother 2. Cells were counterstained with Hoechst. 3 independent experiments were performed with similar results. i, qPCR analysis for TBR2, TUJI and CTIP2 mRNAs at day 32 in the second brother. Data are represented as mean ± SD of 3 independent experiments. The p-values by two-tailed unpaired Student’s t-test are indicated. P < 0.05 was considered statistically significant. j, Immunofluorescence for TBR2 and (k) CTIP2 and TUJI at day 60 of neuronal differentiation in Mutant and two Corrected lines of brother 2. Cells were counterstained with Hoechst. 3 independent experiments were performed with similar results. l, qPCR analysis for TBR2, TUJI and CTIP2 mRNAs at day 60 in the second brother. Data are represented as mean ± SD of 3 independent experiments. The p-values by two-tailed unpaired Student’s t-test are indicated. P < 0.05 was considered statistically significant. m, Western blotting of nuclear and cytoplasmatic fractions in Mutant and Corrected lines of brother 2 at day 7, 14 and 30 of neuronal differentiation. GAPDH and Histone H3 were used to mark the cytosolic and nuclear fraction respectively. β-Catenin expression in the cytoplasm and nucleus is indicated. At day 14, 3 independent experiments, and at day 7 and day 30, 2 independent experiments were performed. GAPDH, Histone H3 and β-Catenin were run on the same gel. For gel source data see Supplementary Fig. 1. n, q-PCR analysis of TBR2, CTIP2 and TUJI mRNAs at day 30 of neuronal differentiation after treatment regime according to Fig. 3e with the Wnt inhibitor IWP2 in Mutant cells and Wnt induction with recombinant Wnt3a in Corrected cells of brother 2. Data are represented as mean ± SD of 3 independent experiments. The p-values by two-tailed unpaired Student’s t-test are indicated. P < 0.05 was considered statistically significant. Abbreviations: M=Mutant; C1 and C2=Corrected 1 and Corrected 2. Source Data
Extended Data Fig. 5
Extended Data Fig. 5. GO enrichment analysis in patient Mutant and Corrected cells.
a, Gene Set Enrichment Analysis (GSEA) plots showing the enrichment of up and downregulated genes in the set of genes annotated as GO “central nervous system neuron development”. Genes are ordered based on the differential expression values obtained from DESeq2. P-values were calculated using Fisher’s exact test (two-sided). Exact p-values and multiple testing adjusted p-values are indicated. b, GO enrichment analysis showing GO terms that are upregulated in Mutant samples (enriched in Mutant) and downregulated in Mutant samples (enriched in Corrected) at day 14, (c) day 30, (d) day 60 and (e) day 90. b-e: P-values were calculated using goseq and adjusted for multiple testing. f, qPCR analysis of WNT1, WNT3a and AXIN2 mRNAs at day 7 (left), 14 (middle) and 30 (right) of neuronal differentiation in Mutant and Corrected lines confirms RNA-seq data. Data are represented as mean ± SD of 3 (WNT1 day 7 and day 14, WNT3a day 7 and day 14 and AXIN2 day 14) and as mean ± SD of 4 (AXIN2 day 7 and WNT1, WNT3a and AXIN2 day 30) independent experiments. The p-values by two-tailed unpaired Student’s t-test are indicated. P < 0.05 was considered statistically significant. Source Data
Extended Data Fig. 6
Extended Data Fig. 6. KDM5C binds directly to Wnt signaling genes.
a, The relative luciferase activity in Mutant and Corrected cells (C1 and C2) transfected with Top-flash and Fop-flash vectors at day 7 and (b) day 14 of neuronal differentiation. Data are represented as mean ± SD of 3 independent experiments. The p-values by two-tailed unpaired Student’s t-test are indicated. P < 0.05 was considered statistically significant. Abbreviations: M=Mutant; C1 and C2=Corrected 1 and Corrected 2. c, Western blotting of nuclear and cytoplasmatic fractions isolated from Mutant and Corrected lines of brother 1 at day 7, 14 and 30 of neuronal differentiation. GAPDH and Histone H3 were used to mark the cytosolic and nuclear fraction respectively. β-Catenin expression in the cytoplasm and nucleus is indicated. 3 independent experiments were performed with similar results. GAPDH, Histone H3 and β-Catenin were run on the same gel. For gel source data see Supplementary Fig. 1. d, Profile plot and heat map of KDM5C enrichment at the 4,526 KDM5C peaks called in Corrected cells. e, Box plot representing gene expression levels in Mutant (Mut) and Corrected (Corr) cells for all genes and KDM5C bound promoters. Bounds of box indicate 25th and 75th percentiles. Centre line denotes median and bounds of whiskers indicate minima and maxima values. f, KEGG pathway highlighting genes in the Wnt signaling pathway directly bound by KDM5C (KEGG (hsa04310)). Genes directly bound by KDM5C are marked in red. Source Data
Extended Data Fig. 7
Extended Data Fig. 7. Transient modulation of the Wnt/β-catenin signaling pathway reprograms the transcriptomic landscape.
a, Volcano plot showing differential gene expression (log2 fold change ≥ 1) between patient Mutant and Corrected cells at day 16 (top) and day 32 (bottom). P-values for a two-group comparison were calculated using a two-sided Student’s t-test. b, Gene Set Enrichment Analysis (GSEA) plots showing the enrichment of up and downregulated genes in the set of genes annotated as GO “Cerebral Cortex Neuron Differentiation” at day 16 and (c) day 32. Mutant versus Mutant+Inhibitor IWP2 (1 mM (first pulse)/0.25 mM (second pulse)) are shown at the top and Corrected versus Corrected+Wnt3a (200 ng/ml) are shown at the bottom. Genes are ordered based on the differential expression values obtained from DESeq2. d, Gene Set Enrichment Analysis (GSEA) plots showing the enrichment of up and downregulated genes in the set of genes annotated as GO “Central Nervous System Neuron Differentiation” at day 16 and (e) day 32. Mutant versus Mutant+Inhibitor (IWP2) are shown at the top and Corrected versus Corrected+Wnt3a are shown at the bottom. Genes are ordered based on the differential expression values obtained from DESeq2. f, Heatmaps showing gene expression for critical neuronal genes in Mutant (Mut), Mutant+Inhibitor (IWP2) (Mut+I), Corrected (Corr) and Corrected+Wnt3a (Corr+W) at day 16 and (g) day 32. h, Heatmaps for differential gene expression (q = 0.01) of transcripts for signaling pathways, growth factors (GF) and genes that are members of the GO enrichment term “small GTPase mediated signal transduction” at day 32 of differentiation that are sensitive to Wnt signaling perturbations. Abbreviations: PDGF = PDGF growth factors; INS=insulin; NON.C.W= non canonical WNT. i, Heatmaps for differential gene expression (q = 0.01) (log2fold change, q = 0.01) of transcripts between the disease group (Mutant and Corrected+Wnt3a) and the Corrected group (Corrected and Mutant+Inhibitor (IWP2)) at day 16 and (j) day 32 of neuronal differentiation. k, Gene ontology (GO) analysis of genes differentially expressed (q ≤ 0.01) between the Corrected group (Corrected and Mutant+Inhibitor) and the disease group (Mutant and Corrected+Wnt3a) at day 16 (top) and (l) day 32 (bottom). Extracted from i and j.
Extended Data Fig. 8
Extended Data Fig. 8. Modulation of the Wnt/β-catenin signaling pathway reprograms the chromatin landscape.
a, Correlation heatmap of open chromatin regions (i.e. ATAC-seq peaks) at day 8, 12, 16 and 32. b, Principal component analysis (PCA) of ATAC-seq signals using all peaks in the genome at day 8, 12, 16 and 32 of neuronal differentiation representing all samples from the second biological replicate. c, Pie charts showing the genomic distribution of open chromatin regions (i.e. ATAC-seq peaks) in patient Mutant and Corrected cells at day 8 and (d) day 12. e, Pie charts showing the genomic distributions of open chromatin regions in Mutant, Mutant+Inhibitor (IWP2) (1 mM (first pulse)/0.25 mM (second pulse)), Corrected and Corrected+Wnt3a (200 ng/ml) cells at day 16 and (f) day 32. g, FPKM expression values for selected genes as extracted from RNA-seq data at day 16 and day 32. Data are represented as mean ± SD of 3 independent experiments. Abbreviations in the Figure: M or Mut=Mutant; C or Corr=Corrected; I or Inh=Wnt Inhibitor; W=Wnt3a. Source Data
Extended Data Fig. 9
Extended Data Fig. 9. Transient modulation of the Wnt/β-catenin signaling pathway reprograms the chromatin landscape.
a and b, KEGG and Gene ontology (GO) analysis in patient Mutant and Corrected cells at day 8 and c and d, day 12. Abbreviations: BP=Biological Processes; CC=Cellular Components; MF=Molecular Function. e, Most enriched Gene ontology (GO) terms for Biological Process, f, Cellular Components and g, Molecular Function for differentially accessible chromatin regions between three cellular comparisons (Corrected versus Mutant, Corrected versus Corrected+Wnt3a (+ W) (200 ng/ml) and Mutant versus Mutant+Inhibitor (+ Inh) cells (IWP2, 1 mM (first pulse)/0.25 mM (second pulse)) at day 16 and day 32 (FDR ≤ 0.05). h-j, KEGG analysis at day 16 and, k-m, day 32 between the same three cellular comparisons as in e-g (FDR ≤ 0.05). a-m, One-sided Fisher exact tests with multiple comparison correction were performed.
Extended Data Fig. 10
Extended Data Fig. 10. A single Wnt3a injection induces and Wnt signaling inhibition rescues KDM5C-associated ID phenotypes, respectively.
a, Representative heatmaps in the Elevated Plus Maze for PBS and Wnt3a injected mice. b, Number of entries into the center in the Open field test (left), time spent in the periphery (middle) and the center (right) in the Open field test. Data are represented as mean ± SEM. 13 PBS and 14 Wnt3a injected mice were investigated. The p-values by one-tailed unequal variance t-test are indicated. P < 0.05 was considered statistically significant. c, Animation of sampling sites for spine density analysis provided by Neurodigitech. d, Expression of the germ line genes DDX3Y, DNAH1 and the DNA methyltransferase DNMT3b at day 32 in the indicated cell lines extracted from RNA-seq data. Data are represented as mean ± SD of 3 independent experiments. The p-values by two-tailed unpaired Student’s t-test are indicated. P < 0.05 was considered statistically significant. e, Model: KDM5C does not efficiently bind to Wnt signaling genes in Mutant cells, which have significantly reduced KDM5C levels. Subsequently, early premature neurons (EN) are briefly increased but more importantly the transition from primary progenitor cells (PP) to intermediate progenitors (iPC) is delayed, which results in a significant delay of neuron (N) expression and proper inter-neuronal connectivity with reduced spine density. During this particular time period of neuronal development, Wnt sensitivity is elevated such that only transient Wnt perturbation is sufficient to have either therapeutic effects when Wnt is inhibited in Mutant cells or can induce disease phenotypes when Wnt3a is added to Corrected cells resulting in persistent cognitive impairments in adult mice. Model was in part created with BioRender.com. Source Data

References

    1. Gonçalves TF, et al. KDM5C mutational screening among males with intellectual disability suggestive of X-linked inheritance and review of the literature. Eur. J. Med. Genet. 2014;57:138–144. doi: 10.1016/j.ejmg.2014.02.011. - DOI - PubMed
    1. Greig LC, Woodworth MB, Galazo MJ, Padmanabhan H, Macklis JD. Molecular logic of neocortical projection neuron specification, development and diversity. Nat. Rev. Neurosci. 2013;14:755–769. doi: 10.1038/nrn3586. - DOI - PMC - PubMed
    1. Lui JH, Hansen DV, Kriegstein AR. Development and evolution of the human neocortex. Cell. 2011;146:18–36. doi: 10.1016/j.cell.2011.06.030. - DOI - PMC - PubMed
    1. Götz M, Huttner WB. The cell biology of neurogenesis. Nat. Rev. Mol. Cell Biol. 2005;6:777–788. doi: 10.1038/nrm1739. - DOI - PubMed
    1. Lilja T, Heldring N, Hermanson O. Like a rolling histone: epigenetic regulation of neural stem cells and brain development by factors controlling histone acetylation and methylation. Biochim. Biophys. Acta. 2013;1830:2354–2360. doi: 10.1016/j.bbagen.2012.08.011. - DOI - PubMed

MeSH terms