. 2024 Feb;626(8001):1094-1101.
doi: 10.1038/s41586-024-07029-4. Epub 2024 Feb 21.

Prevalence of persistent SARS-CoV-2 in a large community surveillance study

Affiliations

Prevalence of persistent SARS-CoV-2 in a large community surveillance study

Mahan Ghafari et al. Nature. 2024 Feb.

Abstract

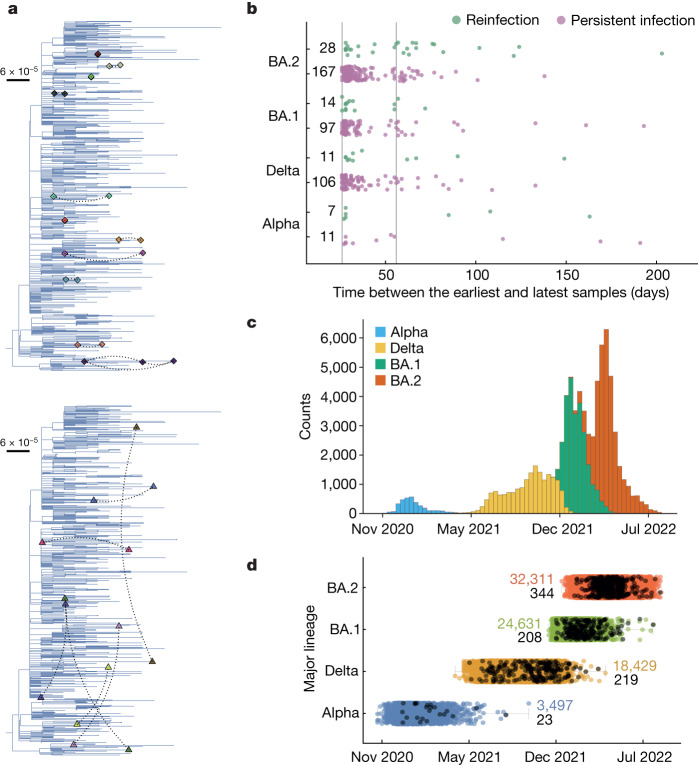
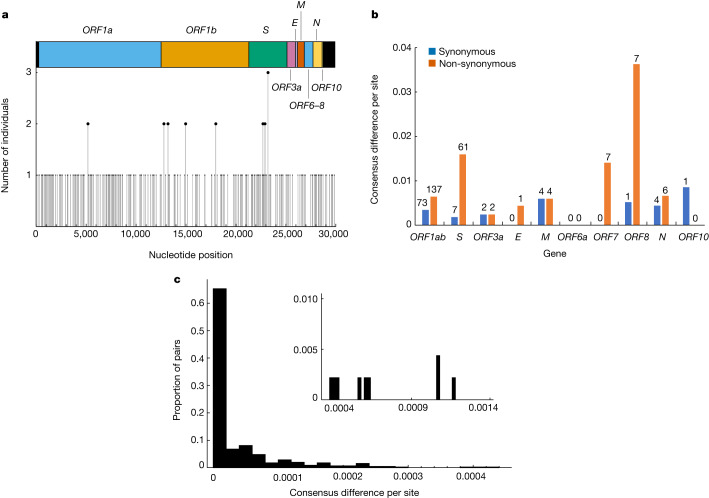
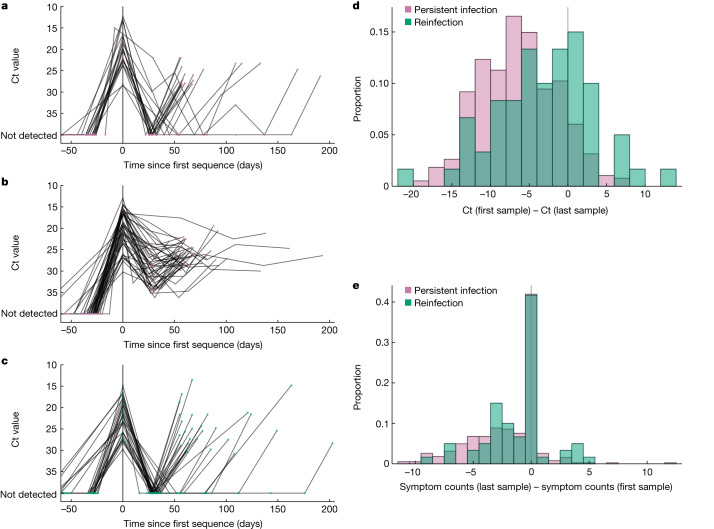
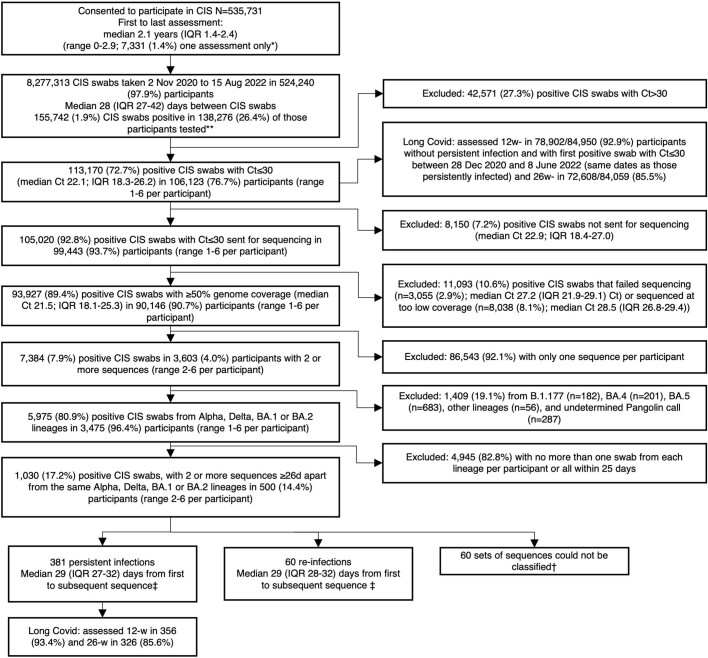
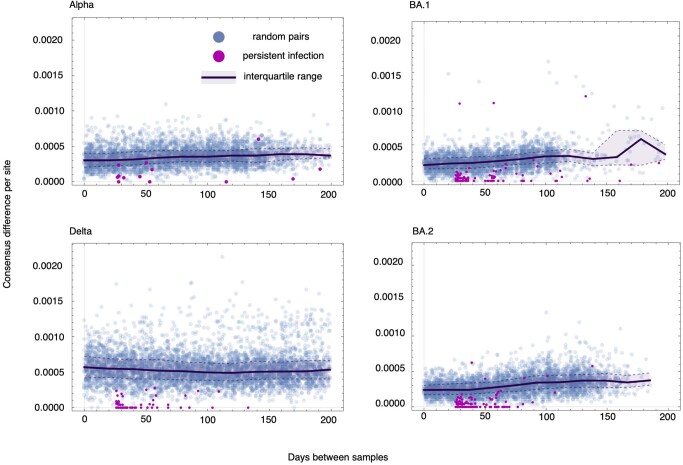
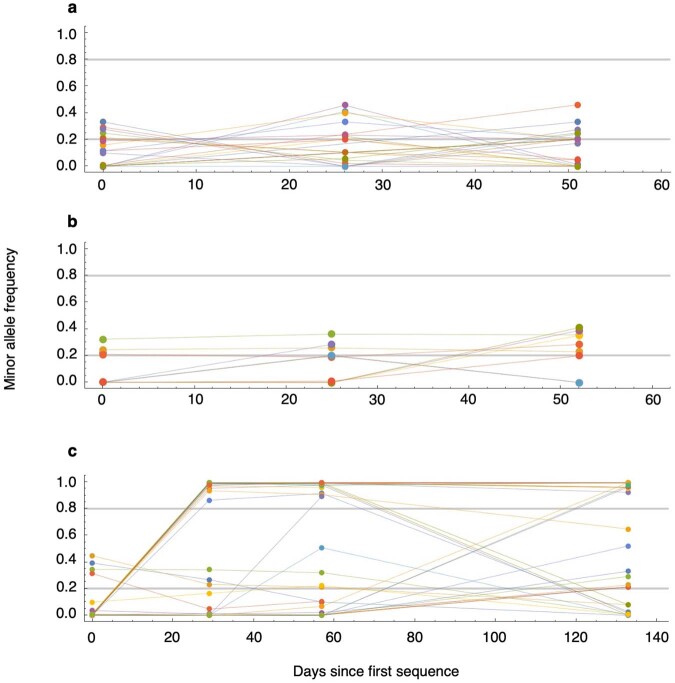
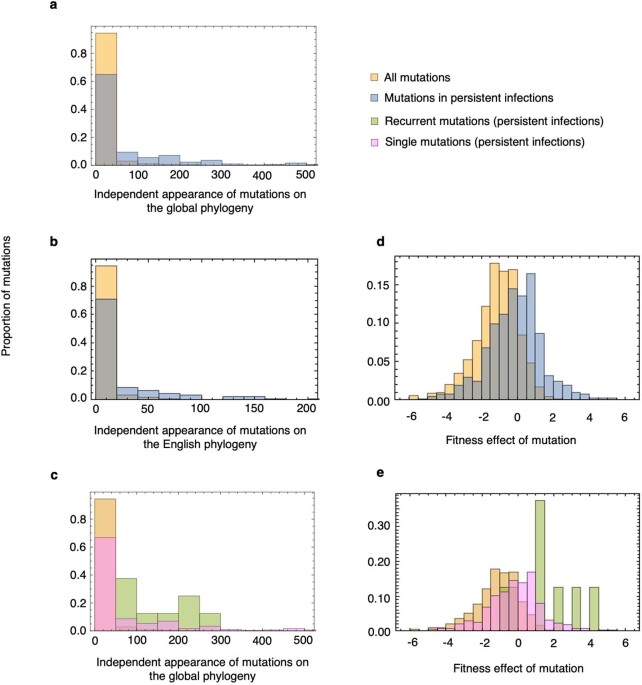
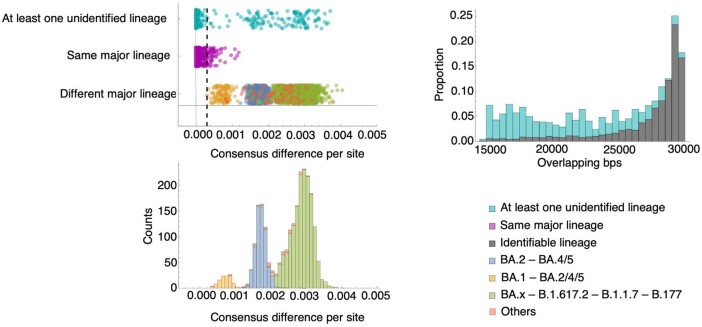
Persistent SARS-CoV-2 infections may act as viral reservoirs that could seed future outbreaks1-5, give rise to highly divergent lineages6-8 and contribute to cases with post-acute COVID-19 sequelae (long COVID)9,10. However, the population prevalence of persistent infections, their viral load kinetics and evolutionary dynamics over the course of infections remain largely unknown. Here, using viral sequence data collected as part of a national infection survey, we identified 381 individuals with SARS-CoV-2 RNA at high titre persisting for at least 30 days, of which 54 had viral RNA persisting at least 60 days. We refer to these as 'persistent infections' as available evidence suggests that they represent ongoing viral replication, although the persistence of non-replicating RNA cannot be ruled out in all. Individuals with persistent infection had more than 50% higher odds of self-reporting long COVID than individuals with non-persistent infection. We estimate that 0.1-0.5% of infections may become persistent with typically rebounding high viral loads and last for at least 60 days. In some individuals, we identified many viral amino acid substitutions, indicating periods of strong positive selection, whereas others had no consensus change in the sequences for prolonged periods, consistent with weak selection. Substitutions included mutations that are lineage defining for SARS-CoV-2 variants, at target sites for monoclonal antibodies and/or are commonly found in immunocompromised people11-14. This work has profound implications for understanding and characterizing SARS-CoV-2 infection, epidemiology and evolution.


Conflict of interest statement

The authors declare no competing interests.

Figures

Fig. 1
Fig. 1. Individuals identified with persistent SARS-CoV-2 and reinfections with the same major lineage within the ONS-CIS.
a, Phylogenetic relationship between samples from individuals with persistent SARS-CoV-2 RNA (hereafter referred to as persistent infections) (top), and reinfections with a representative background population of Alpha (B.1.1.7; see Extended Data Fig. 2 for the analysis on the other three major lineages) (bottom). The dashed lines connect every pair of sequences from the same individual. Pairs from individuals with persistent infections cluster closely together, whereas reinfections do not. All sequences from the same individual are given the same colour. b, Number of days between the earliest and latest genomic samples from persistent infections and reinfections. Each point represents a single individual. The solid vertical lines show the 26-day and 56-day cut-offs. The numbers on the side of each bar show the total counts per category for each major lineage. c, Total number of sequences in the ONS-CIS per major lineage over time. d, Timing of persistent infections (black) during the UK epidemic. Some individuals with persistent infections can be identified up to weeks after the lineage has been replaced at the population level. The coloured boxes indicate the interquartile range, which spans from the 25th to the 75th percentile, with the centre being the median calendar date corresponding to each major lineage. The medians for Alpha, Delta, BA.1 and BA.2 are 13 January 2021, 16 October 2021, 20 January 2022 and 30 March 2022, respectively. The extremities (displayed as grey horizontal lines) denote the minimum and maximum values within each category. The coloured numbers on the side of each box show the total number of sequences within the ONS-CIS for each major lineage. The black numbers represent the total number of sequences from persistent infections corresponding to each major lineage. Source Data
Fig. 2
Fig. 2. Distribution of SNPs and non-synonymous versus synonymous mutations detected in individuals with persistent SARS-CoV-2.
a, Number of mutations that resulted in a consensus change identified in one or more individuals with persistent SARS-CoV-2 RNA (hereafter referred to as persistent infections). E, envelope protein; M, membrane protein; N, nucleocapsid protein. b, Number of synonymous (blue) and non-synonymous (orange) mutations per site during persistent infections. The numbers above each column show the total counts of consensus changes in each category of mutations. c, Distribution of consensus differences per site between sequences from all persistent infections. Nearly 65% of all pairs of sequences from the same infection (corresponding to 70% of persistent infections) had zero consensus differences and most others had below 0.0004 differences per site. The inset shows the remaining pairs with a high number of consensus differences. Source Data
Fig. 3
Fig. 3. Comparison of RNA viral load dynamics and the number of reported symptoms in individuals with persistent SARS-CoV-2 and reinfections with the same major lineage.
ac, RNA viral load trajectories of individuals with persistent SARS-CoV-2 RNA (hereafter referred to as persistent infections) with rebounding (that is, a negative RT–PCR test during the infection) (purple; a) and chronic persistent viral load (purple; b) and reinfections with at least three PCR tests taken over the course of infection or until reinfection (cyan; c). For ac, only individuals with three or more RT–PCR tests during the course of infection were included. d,e, Change in Ct value (d) and total number of symptoms reported between the first and last time points (e) with sequenced samples for all 381 persistent infections and 60 reinfections. Source Data
Extended Data Fig. 1
Extended Data Fig. 1. Flow diagram of COVID-19 Infection Survey (CIS) participant in this study.
*At enrolment, participants could choose to have one assessment only, or 5 assessments over the first month only, or to continue approximately monthly follow-up until the end of the study. **158,719 (1.9%) CIS swabs failed testing. †One participant is classed as having both a persistent infection and reinfection with the same major lineage. ‡ Two-sided ranksum p = 0.53.
Extended Data Fig. 2
Extended Data Fig. 2. Number of persistent infections identified with a shared rare SNP as a function of the threshold number of cases for calling a rare SNP.
A threshold value of 1 for a rare SNP means the rare SNP is only found in one sequence of that lineage in the ONS-CIS dataset, excluding sequences from any persistently infected individuals. The number of persistent infections identified gives the number of persistent infections lasting at least 26 days we would identify as persistent in the ONS-CIS using the given threshold (black). The false positive percentage gives the percentage of times two random samples of the same major lineage taken from the ONS-CIS would be falsely identified as belonging to the same persistent infection (magenta; 1,000 pairs of samples were considered). As the threshold value for calling a rare SNP increases, the number of persistent infections identified (black) increases, but so does the false positive rate. We chose a threshold number of 400 (vertical dashed line) in this study for identifying persistent infections, since for this threshold the percentage of false positives were 0% for BA.1 and BA.2 and 3% for Alpha and Delta, but the number of persistent infections identified has begun to plateau. The total number of candidate persistent infections (that have at least a pair of sequence that are ≥26 days apart) we considered for each lineage equals the number of infections identified when there is a false positive rate of 100% (18 Alpha, 122 Delta,130 BA.1, and 230 BA.2). The exception is a single individual with two BA.2 sequences which do not have a shared SNP relative to the BA.2 population-level consensus.
Extended Data Fig. 3
Extended Data Fig. 3. Phylogenetic relationship between samples from persistent infections and a representative background population per major lineage.
Dashed lines connect every pair of sequences from the same individual. All sequences from the same individual are given the same colour. Pairs of sequences for (a) Alpha, (b) Delta, (c) Omicron BA.1, and (d) Omicron BA.2 that belong to persistent infections cluster closely together while reinfections do not. However, some of the sequences in 2 (out of 97) persistent infections with BA.1 and 5 (out of 167) persistent infections with BA.2 have poor bootstrap support (<80) and do not cluster together or cluster in a basal sister relationship. In all of these 7 cases, at least one of the sequences from each individual had a Ct value close to 30 with poor coverage. On the other hand, all sequences that belong to the same individual and have strong bootstrap support (>80) cluster together. Source Data
Extended Data Fig. 4
Extended Data Fig. 4. Days between all pairs of sequences from the same individual with two or more sequences.
Pairs of sequences are classified as (i) pairs with at least one unidentified Pango lineage (green), (ii) pairs with identical major lineage (orange), and (iii) pairs from different major lineages (blue). The boxes indicate the interquartile range (IQR), which spans from the 25th to the 75th percentile, with the centre being the median and marked by a black vertical line. The medians for categories (i), (ii), and (iii) are 58, 9, and 180 days, with IQRs of 28–163 days, 7–28 days, and 123–280 days, respectively. The extremities (displayed as grey horizontal lines) denote the minimum and maximum values within each category. Bottom panel shows the counts of pairs in each of these three categories for the first 200-day time span (highlighted in a dashed rectangle in the top panel). Pairs include all possible combinations of sequences from the same individual, including sequences that are less than 26 days apart from each other. The number of pairs peaks at the 7-, 30-, and 60-day periods due to the sampling frequency of ONS-CIS (see Methods). Note that pairs with identical major lineage may not necessarily have identical Pango lineages (see Methods).
Extended Data Fig. 5
Extended Data Fig. 5. RNA viral load dynamics of individuals identified with persistent infections and reinfections stratified by duration and viral activity.
RNA viral load activities of individuals, with 3 or more PCR tests taken during infection/until reinfection, identified as having (a) persistent infections and (b) reinfections with rebounding (i.e., a negative RT-PCR test during the infection) (left column) and persistent chronic (right column) trajectories. Three reinfections (two occurring in <60 days and one between 60 to 90 days since first sequence) with persistent chronic viral load dynamics are excluded from the reinfection group as they are deemed potential persistent infections which do not have rare SNPs.
Extended Data Fig. 6
Extended Data Fig. 6. Number of single nucleotide polymorphisms detected in pairs of sequences from persistent infections vs. random pairs from a representative background population.
Number of consensus nucleotide differences per site between all the sequences collected from persistent infections (purple) and random pairs from individuals with only a single sequence within the ONS-CIS (blue) as a function of the number of days between each pair. For each major lineage, a pool of sequences from individuals with only one sequence within the ONS-CIS was sub-sampled and 500 random pairs generated for every 20 additional days between samples. For some major lineages where there were fewer than 500 pairs available beyond a certain time point, all possible random pairs within that 20-day period are used. Solid line and shaded area show the median and interquartile range, respectively, for random pairs over time. Note that the line and shaded area in each graph does not represent the rate of evolution but can be deemed as a measure of lineage diversity as a function of time difference between samples.
Extended Data Fig. 7
Extended Data Fig. 7. Dynamics of intra-host Single Nucleotide Variants (iSNVs) over time.
Temporal frequencies of iSNVs over time for (a,b) two persistent infections with zero consensus change and (c) a persistent infection with accelerated within-host evolution. iSNV trajectories in a and b show substantial sub-consensus activity whereby de novo mutations reach up to 40% frequency. In panel c, at the second time point (29 days since the first sequence), 30 consensus change mutations are detected. At the first time point, 4 iSNVs that are above 20% frequency are shared across at least one later time point. Each line represents a unique iSNV and the two horizontal grey lines represent the 20% and 80% frequency thresholds. The minimum frequency and number of bases to call an iSNV is 20% and 10 bases, respectively, and all iSNVs crossing the 20% threshold at least one more time point are included.
Extended Data Fig. 8
Extended Data Fig. 8. Counting the number of independent appearances of mutations in persistently infected individuals and their fitness effect on a global phylogeny.
(ac) Comparing the number of independent appearances of all SARS-CoV-2 mutations (orange) on global and English phylogenies of representative samples from Alpha, Delta, BA.1, and BA.2 major lineages with mutations that are found in persistently infected individuals (blue) that only emerged in one (pink) or two (green) individuals. (d,e) Distribution of fitness effects of mutations on a globally representative phylogeny of the four major lineages of Alpha, Delta, BA.1, and BA.2. Mutations from persistent infections have an overall higher fitness than other mutations on the global phylogeny. Recurrent mutations also generally have a higher fitness than those that are found in only a single individual. Independent appearances of mutations on the global and English phylogenies are taken from https://github.com/jbloomlab/SARS2-mut-fitness/blob/main/results/mutation_counts/aggregated.csv and the fitness effect of mutations are taken from https://github.com/jbloomlab/SARS2-mut-fitness/blob/main/results/aa_fitness/aamut_fitness_by_clade.csv.
Extended Data Fig. 9
Extended Data Fig. 9. Pairwise differences between sequences from individuals with two or more sequences.
(Left column) Number of consensus differences per site between pairs of sequences from each individual with two or more sequences, including sequences that are less than 26 days apart. Pairs include all possible combinations of sequences from the same individual. Only sites where a nucleotide difference could be called were included. Vertical dashed line shows the lowest number of SNPs per base for pairs with different major lineages. Any pair with at least one unidentified lineage with a SNP per base smaller than the dashed line is selected as a candidate pair from a persistent infection as long as the pair is at least 26 days apart from each other. Pairs with different major lineages are coloured based on their number of SNPs per base into three groups: (i) pairs with one BA.1 and one BA.2 or BA.4 or BA.5 sequence (orange; n = 115); (ii) pairs with one BA.2 and one BA.4 or BA.5 sequence (blue; n = 628); and (iii) pairs with one Omicron (including all BA.x lineages) and one Delta (B.1.617.2), Alpha (B.1.1.7), or B.1.177 sequence (green; 1673) and (iv) all other possible combinations (red; n = 70). There was a total of 286 pairs with at least one unidentified lineage (cyan), 1470 pairs with the same major lineage (magenta), and 2486 pairs with different major lineages. (Right column) Proportion of sequences (shown in the stacked form) with different number overlapping base pairs. Those with at least one unidentified lineage (n = 286) have a lower number of overlapping base pairs relative to pairs with identifiable lineage (i.e. pairs with identical or different major lineage; n = 3956) mainly due to having lower coverage.

Similar articles

Cited by

References

    1. Dennehy JJ, Gupta RK, Hanage WP, Johnson MC, Peacock TP. Where is the next SARS-CoV-2 variant of concern? Lancet. 2022;399:1938–1939. doi: 10.1016/S0140-6736(22)00743-7. - DOI - PMC - PubMed
    1. Otto SP, et al. The origins and potential future of SARS-CoV-2 variants of concern in the evolving COVID-19 pandemic. Curr. Biol. 2021;31:R918–R929. doi: 10.1016/j.cub.2021.06.049. - DOI - PMC - PubMed
    1. Gonzalez-Reiche, A. S. et al. Sequential intrahost evolution and onward transmission of SARS-CoV-2 variants. Nat. Commun.14, 3235 (2023). - PMC - PubMed
    1. Hill V, et al. The origins and molecular evolution of SARS-CoV-2 lineage B.1.1.7 in the UK. Virus Evol. 2022;8:veac080. doi: 10.1093/ve/veac080. - DOI - PMC - PubMed
    1. Ghafari, M., Liu, Q., Dhillon, A., Katzourakis, A. & Weissman, D. B. Investigating the evolutionary origins of the first three SARS-CoV-2 variants of concern. Front. Virol.10.3389/fviro.2022.942555 (2022).

MeSH terms

Supplementary concepts