. 2024 Mar;627(8004):628-635.
doi: 10.1038/s41586-024-07098-5. Epub 2024 Feb 21.

IL-10 constrains sphingolipid metabolism to limit inflammation

Affiliations

IL-10 constrains sphingolipid metabolism to limit inflammation

Autumn G York et al. Nature. 2024 Mar.

Abstract

Interleukin-10 (IL-10) is a key anti-inflammatory cytokine that can limit immune cell activation and cytokine production in innate immune cell types1. Loss of IL-10 signalling results in life-threatening inflammatory bowel disease in humans and mice-however, the exact mechanism by which IL-10 signalling subdues inflammation remains unclear2-5. Here we find that increased saturated very long chain (VLC) ceramides are critical for the heightened inflammatory gene expression that is a hallmark of IL-10 deficiency. Accordingly, genetic deletion of ceramide synthase 2 (encoded by Cers2), the enzyme responsible for VLC ceramide production, limited the exacerbated inflammatory gene expression programme associated with IL-10 deficiency both in vitro and in vivo. The accumulation of saturated VLC ceramides was regulated by a decrease in metabolic flux through the de novo mono-unsaturated fatty acid synthesis pathway. Restoring mono-unsaturated fatty acid availability to cells deficient in IL-10 signalling limited saturated VLC ceramide production and the associated inflammation. Mechanistically, we find that persistent inflammation mediated by VLC ceramides is largely dependent on sustained activity of REL, an immuno-modulatory transcription factor. Together, these data indicate that an IL-10-driven fatty acid desaturation programme rewires VLC ceramide accumulation and aberrant activation of REL. These studies support the idea that fatty acid homeostasis in innate immune cells serves as a key regulatory node to control pathologic inflammation and suggests that 'metabolic correction' of VLC homeostasis could be an important strategy to normalize dysregulated inflammation caused by the absence of IL-10.


Conflict of interest statement

R.A.F. is an advisor to Glaxo Smith Kline. The other authors declare no competing interests.

Figures
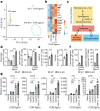
Fig. 1
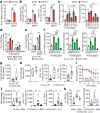
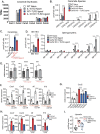
Fig. 1. IL-10 signalling regulates sphingolipid metabolism.
a, Principal component analysis (PCA) of individual lipids quantified by mass spectrometry from naive or TLR2-activated (50 ng ml−1 Pam3CysK4) wild-type and Il10-KO BMDMs for 48 h. The percentage of total variance explained by individual principal components (PC1 and PC2) is indicated. Prediction ellipses are set at 95% probability (n = 3–4). b, Heat map of individual lipid species measured by direct infusion mass spectrometry from naive BMDMs (left two columns) or TLR2-activated BMDMs (right two columns) stimulated as in a. Scaled by row (lipid species). Bolded text indicates *P < 0.05 between TLR2-activated wild-type and Il10-KO BMDMs. CE, cholesteryl esters; Cer, ceramides; DAG, diacylglycerols; FFA, free fatty acids; HCer, hexosyl ceramides; LCer, lactosyl ceramides; LPC, lysophosphatidylcholine; LPE, lysophosphatidylethanolamine; PC, phosphatidylcholine; PE, phosphatidylethanolamine; SM, sphingomyelins; TAG, triglycerides. c, Simplified schematic of sphingolipid metabolism. Ceramides are generated by de novo synthesis pathway at the endoplasmic reticulum. Ceramides can be further modified to generate hexosyl and lactosyl ceramides (modified ceramides), which can be broken back down into ceramides. Ceramides serve as the building blocks for all sphingomyelin species, which can also be broken down into ceramides. d, Total ceramides and sphingomyelin species measured by direct infusion mass spectrometry from BMDMs stimulated as in a (n = 3–4). e, Ceramide species measured by direct infusion mass spectrometry from ex vivo peritoneal macrophages collected from wild-type and Il10-KO mice after 48 h TLR2 ligand (50 μg Pam3CysK4 per mouse) administered via intraperitoneal injection (n = 6). f, LC–MS analysis of total and labelled sphinganine in 48 h TLR2-activated wild-type and Il10-KO BMDMs. (n = 4). g, Quantitative PCR (qPCR) analysis of inflammatory gene expression in naive BMDMs or BMDMs activated with TLR2 ligand (50 ng ml−1 Pam3CysK4) for 24 h. TLR2-activated macrophages were incubated with cholesteryl:phosphatidylcholine (cholPC) alone or with cholPC loaded with Cer16:0 or Cer24:0 or cholPC plus neutralizing anti-IL-10R (5 μg ml−1) for the last 20 h of the activation (n = 3 for each group). All lipids administered at a final concentration of 30 μM. All data are mean of biological replicates ± s.d. *P < 0.05, **P < 0.01, ***P < 0.005 (two-tailed unpaired Student’s t-test). Source Data
Fig. 2
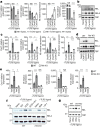
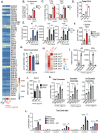
Fig. 2. Genetic inhibition of VLC ceramide synthesis limits inflammation.
a, qPCR analysis of Inflammatory gene expression in 48 h TLR2-activated (50 ng ml−1 Pam3CysK4) wild-type or Cers2-KO BMDMs (n = 3 per group). b, qPCR analysis of Il12b and Il1b gene expression in 48 h TLR2-activated (50 ng ml−1 Pam3CysK4) wild-type, Il10rb-KO or Il10rb/Cers2-DKO peritoneal macrophages supplemented with cholPC (vehicle), Cer16:0 or Cer24:0 for the last 44 h of activation (n = 3 per group). All lipids administered at a final concentration of 30 μM. c, Macrophages (CD11c+MHCII+), monocytes (CD11b+Ly6C+) and neutrophils (Cd11b+Ly6G+) from flow cytometry-based immune cell profiling of the colonic lamina propria (LP) from control (Il10rb-heterozygous), Il10rb-KO and Il10rb/Cers2-DKO chimeric mice (n = 10–13). Mann–Whitney t-test. d, Total macrophages (CD11c+MHCII+) and CD64+ macrophages from colonic lamina propria from wild-type and Cers2-KO chimeric mice (n = 4–5). e, UMAP analysis of single-cell RNA-seq (scRNA-seq) data from Il10rb-KO and Il10rb/Cers2-DKO macrophage clusters in cells sorted from the colon lamina propria. f, UMAP analysis of Cxcl2 and Il6 scRNA-seq data from sorted macrophages from the colon lamina propria of Il10rb-KO or Il10rb/Cers2-DKO chimeric mice. All experiments are reported as mean of biological replicates ± s.d. *P < 0.05, **P < 0.01, ***P < 0.005 (two-tailed unpaired Student’s t-test, unless noted otherwise). Source Data
Fig. 3
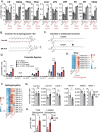
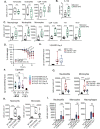
Fig. 3. IL-10-induced mono-unsaturated fatty acid synthesis constrains ceramide production.
a, qPCR analysis of Scd2 gene expression in naive or 24 h TLR2-activated wild-type or Il10-KO BMDMs (n = 3). b, Synthesized and total oleic acid (18:1) from naive or 48 h TLR2-activated wild-type or Il10-KO BMDMs (n = 4). c, qPCR analysis of Il12b and Il6 gene expression in 48 h TLR2-activated wild-type or Il10-KO BMDMs incubated with BSA, or 25 μM BSA–16:0, BSA–18:1, BSA–18:2 or BSA–24:1 for the last 44 h (n = 3). d, Saturated and unsaturated ceramide species from 48 h TLR2-activated wild-type or Il10-KO or Il10-KO BMDMs treated with 25 μM 18:1 for the last 44 h (n = 3–4). e, Total ceramides species in naive or TLR2-activated LysM-cre+ wild-type and Scd2-cKO BMDMs (n = 4). f, qPCR analysis of Cxcl1, Cxcl2 and Il6 gene expression in 48 h TLR2-activated cre+ wild-type BMDMs incubated with BSA, Scd2-cKO BMDMs incubated with BSA, and Scd2-cKO BMDMs incubated with 25 μM BSA–18:1, BSA–18:2 or BSA–24:1 for the last 44 h (n = 3). g, Enzyme-linked immunosorbent assay (ELISA) analysis of faecal lipocalin of control and Scd2-cKO male mice (n = 8–9). h, Flow cytometry-based immune cell profiling of the colonic lamina propria from naive control and Scd2-cKO male mice (n = 8–9). i, DSS-induced weight loss in control and Scd2-cKO female mice (n = 9). Data are mean ± s.e.m. j, Flow cytometry-based immune cell profiling of the colonic lamina propria from Il10rb-heterozygous (Het) male mice gavaged with BSA and Il10rb-KO male mice gavaged with BSA or BSA–24:1 (n = 8–10). k, ELISA analysis of IL-6 and IL-12β in colonic explants from Il10rb-heterozygous mice gavaged with BSA and Il10rb-KO male mice gavaged with BSA or BSA–24:1, incubated ex vivo for 24 h.(n = 10–11). All experiments are reported as mean of biological replicates ±  s.d. unless noted otherwise. *P < 0.05, **P < 0.01, ***P < 0.005 (two-tailed unpaired Student’s t-test). Source Data
Fig. 4
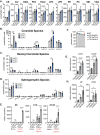
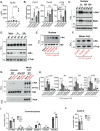
Fig. 4. REL is required for ceramide-mediated induction of inflammatory gene expression.
a, qPCR analysis of inflammatory gene expression in BMDMs pretreated with 30 μM Cer24:0 for 48 h, followed by 1 h activation with TLR2 ligand (50 ng ml−1 Pam3CSK4) versus 48 h TLR2 activation with 44 h 30 μM Cer24:0 treatment (n = 3). b, Western blot analysis of RELA, REL and TBP (loading control) from nuclear extracts from naive or 48 h TLR2-activated wild-type peritoneal macrophages plus cholPC (vehicle), Cer16:0, or Cer24:0 for the last 44 h of the activation. Representative of three individual experiments. c, qPCR analysis of inflammatory gene expression in 48 h TLR2-activated wild-type or Rel-KO BMDMs plus cholPC (vehicle) or 30 μM Cer24:0 for the last 44 h of activation (n = 3). d, Western blot analysis of RELA, REL and TBP (loading control) from nuclear extracts from naive or 48 h TLR2-activated wild-type or Rel-KO BMDMs plus cholPC (vehicle) or 30 μM Cer24:0 for the last 44 h of activation. RELA was blotted in parallel with REL and TBP. Representative of two individual experiments. e, qPCR analysis of inflammatory gene expression in 48 h TLR2-activated wild-type or Rel-KO BMDMs with or without 10 nM SCDi (Cay10566) for the last 44 h of activation (n = 3). Veh, vehicle. f, Western blot analysis of REL, RELA and TBP (loading control) in nuclear extracts from naive or 48 h TLR2-activated wild-type or Il10-KO BMDMs plus SCDi, BSA or 25 μM BSA–18:1 for the last 44 h of the activation. Representative of three individual experiments. g, Western blot analysis of nuclear extracts from naive or 48 h TLR2-activated wild-type or Il10rb-KO BMDMs plus BSA or 25 μM BSA–24:1 for the last 44 h of the activation for RELA, REL and TBP (loading control). Representative of two experiments. All experiments are reported as mean of biological replicates ± s.d. *P < 0.05, **P < 0.01, ***P < 0.005 (two-tailed unpaired Student’s t-test). Source Data
Extended Data Fig. 1
Extended Data Fig. 1. IL-10 signaling controls sphingolipid metabolism.
A) Total Cholesteryl Esters (CE), Diacylglycerols (DAG), Free Fatty Acids (FFAs), Hexosyl Ceramides (HCer), Lactosyl Ceramides (LCer), Lysophosphatidylcholine (LPCs), Lysophosphatidylethanolamine (LPE), phosphatidylcholine (PC), phosphatidylethanolamine (PE) and triglycerides (TAGs) measured by direct infusion MS from naïve or 48 h TLR2 activated WT and IL10 KO BMDMs (n = 3-4). B) Schematic of Ceramide 16:0 and Sphingomyelin (SM) 16:0. Both sphingolipids contain an 18 carbon long constant chain (top, black numbers), and a 16 carbon long variable chain (bottom, red numbers). Figure made with ChemDraw V22.2.0.3300. C) Schematic of saturated (Cer24:0) versus unsaturated (Cer24:1) ceramides. Double bond in 24:1 is located at the arrow. Figure made with ChemDraw V22.2.0.3300. D) Ceramide species measured by direct infusion MS from WT and IL10 KO BMDMs that are naïve or activated with TLR2 ligand (50 ng/mL Pam3CysK4) for 48 h. E) Heat map of individual hexosyl ceramide (HCer) species measured by direct infusion MS from WT and IL10 KO BMDMs that are naïve or activated with TLR2 ligand (50 ng/mL Pam3CysK4) for 48 h. Scaled by row (lipid species) * indicate significance of p < 0.05 between WT and IL-10 KO activated with TLR2. F) Heat map of individual sphingomyelin (SM) species measured by direct infusion MS from WT and IL10 KO BMDMs that are naïve or activated with TLR2 ligand (50 ng/mL Pam3CysK4) for 48 h. Scaled by row (lipid species) * indicate significance of p < 0.05 between WT and IL-10 KO activated with TLR2. G) Total Ceramide and Sphingomyelins (SM) measured by direct infusion MS from ex vivo peritoneal macrophage collected from WT and IL10 KO mice after 48 h TLR2 ligand (50ug/mouse Pam3CysK4) administered via IP injection (n = 6). H) LC-MS analysis of total and labeled sphinganine in 48 h TLR2-activated WT and IL-10R KO BMDMs (n = 3). All experiments are reported as means ± SD from 3 independent experiments, unless noted otherwise. *P < 0.05; **P < 0.01, ***P < 0.005 (two-tailed unpaired Student’s t test). Source Data
Extended Data Fig. 2
Extended Data Fig. 2. Exogenous very long chain ceramides induce inflammation.
A) Total Cholesteryl Esters (CE), Ceramides (Cer), Diacylglycerols (DAG), Free Fatty Acids (FFAs),Hexosyl Ceramides (HCer), Lysophosphatidylcholine (LPCs), Lysophosphatidylethanolamine (LPE), phosphatidylcholine (PC), phosphatidylethanolamine (PE) and triglycerides (TAGs) measured by direct infusion MS from naïve or 48 h TLR2 activated WT BMDMs treated with CholPC (vehicle), Cer16:0 or Cer24:0. All lipids are administered at final concentration of 30uM. B) Ceramide species measured by direct infusion MS from naïve or 48 h TLR2 activated WT BMDMs treated with CholPC (vehicle), Cer16:0 or Cer24:0. All lipids are administered at final concentration of 30uM. C) Hexosyl Ceramide species measured by direct infusion MS from naïve or 48 h TLR2 activated WT BMDMs treated with CholPC (vehicle), Cer16:0 or Cer24:0. All lipids are administered at final concentration of 30uM. D) Sphingomyelin species measured by direct infusion MS from naïve or 48 h TLR2 activated WT BMDMs treated with CholPC (vehicle), Cer16:0 or Cer24:0. All lipids are administered at final concentration of 30uM. E) qPCR analysis of Il6, Il1b and Il12b gene expression in naïve BMDMs treated with CholPC or Cer24:0 alone for 48 h versus TLR2-activated BMDMs treated with the same lipids (30uM for all treatments) (n = 3). F) Percent viability measured by AOPI staining for naïve or TLR2- activated BMDMs treated with CholPC, Cer16:0 or Cer24:0 (30uM for all lipids) for 48 h. G) qPCR analysis of Cxcl1 and Cxcl2 gene expression in BMDMs activated with TLR2 ligand (50 ng/mL Pam3CysK4) for 48 h. TLR2-activated macrophage were incubated with Cholesteryl:Phosphatidylcholine (CholPC) lipid sheets alone or with CholPC loaded with ceramide 22:0 (Cer22:0) or ceramide 24:0 (Cer24:0) for the last 44 h of the activation (n = 3 for each group). All lipids administered at a final concentration of 30uM. H) qPCR analysis of Il6 and Il12b gene expression in BMDMs activated with TLR2 ligand (50 ng/mL Pam3CysK4) for 48 h. TLR2-activated macrophage were incubated with Cholesteryl:Phosphatidylcholine (CholPC) lipid sheets alone or with CholPC loaded with ceramide 22:0 (Cer22:0) or ceramide 24:0 (Cer24:0) for the last 44 h of the activation (n = 3 for each group). All lipids administered at a final concentration of 30uM. All experiments are reported as means ± SD from 3 independent experiments, unless noted otherwise. *P < 0.05; **P < 0.01, ***P < 0.005 (two-tailed unpaired Student’s t test). Source Data
Extended Data Fig. 3
Extended Data Fig. 3. CerS2 is required for VLC ceramide production and inflammation.
A) RNAseq analysis of Ceramide synthase genes from naïve or TLR2 activated WT and IL10 KO BMDMs from RNAseq analysis from samples matched to lipidomics analysis in Fig. 1 (TPMs must be above 0 to be listed). (n = 2). B) Ceramide species measured by direct infusion MS from naïve or 48 h TLR2-activated WT or CerS2 KO BMDMs (n = 3). C) Total ceramides measured by direct infusion MS from naïve or 48 h TLR2-activated WT or CerS2 KO BMDMs (n = 3 per group). D) Sphingomyelin (SM) species measured by direct infusion MS from naïve or 48 h TLR2-activated WT or CerS2 KO BMDMs (n = 3). E) qPCR analysis of Cxcl1, Cxcl2, and Il1b gene expression in 48 h TLR2-activated (50 ng/mL Pam3CysK4) WT or CerS2 Heterzygous BMDMs (n = 3 per group). F) qPCR analysis of Cxcl1, Cxcl2, Il6, and I1b gene expression in 48 h TLR2-activated (50 ng/mL Pam3CysK4) WT or CerS2 KO BMDMs +/− anti-IL-10R neutralizing antibody (5ug/mL) for the last 44 h of the activation (n = 3 per group). G) qPCR analysis of Cxcl2 gene expression in 48 h TLR2-activated (50 ng/mL Pam3CysK4) WT (white bars), IL-10R KO (red bar) or IL-10R/CerS2 DKO (Blue bars) peritoneal macrophage supplemented with CholPC (vehicle), Cer16:0 or Cer24:0 for the last 44 h of activation. H) qPCR analysis of Cxcl1, Cxcl2, Il6, and Il1b gene expression in 48 h TLR4-activated (50 ng/mL LPS) WT (white bars), IL-10R KO (red bar) or IL-10R/CerS2 DKO (Blue bars) peritoneal macrophage for 48 h. I) ELISA analysis of lipocalin from feces of control (IL-10R Heterozygous), IL-10R KO and IL-10R/CerS2 DKO chimeric mice (n = 9−14) Statistical differences measured by two-sided Mann-Whitney tests. All experiments are reported as means ± SD from 3 independent experiments, unless noted otherwise. *P < 0.05; **P < 0.01, ***P < 0.005 (two-tailed unpaired Student’s t test). Source Data
Extended Data Fig. 4
Extended Data Fig. 4. CerS2 regulates colonic inflammation in vivo.
A) Flow cytometry-based immune cell profiling of the total CD4 T cells (Lin-/TCRB +/CD4 +) or IFNg+ or IL-17A + CD4 T cells from colonic lamina propria from control (IL-10R Heterozygous), IL-10R KO and IL-10R/CerS2 DKO chimeric mice. B) Flow cytometry-based immune cell profiling of the colonic lamina propria from WT and CerS2 KO chimera mice. C) scRNAseq UMAP analysis of macrophage markers and inflammatory genes from macrophage from IL-10R KO and IL-10R/CerS2 DKO colon LPs. D) scRNAseq gene expression analysis from all clusters of Fcgr1 (CD64), Cxcl2, Il1b and Cd38 from sorted macrophage from the colon LP of IL-10R KO or IL-10R/CerS2 DKO chimera mice. E) scRNAseq gene expression analysis from all clusters of Mrc1, CD83 and Mgl2 from sorted macrophage from the colon LP of IL-10R KO or IL-10R/CerS2 DKO chimera mice. F) scRNAseq UMAP analysis of macrophage tolerogenic and M2 markers as in S5E from macrophage from IL-10R KO and IL-10R/CerS2 DKO colon LPs. All experiments are reported as means ± SD from 3 independent experiments, unless noted otherwise. *P < 0.05; **P < 0.01, ***P < 0.005 (two-tailed unpaired Student’s t test). Source Data
Extended Data Fig. 5
Extended Data Fig. 5. IL-10 controls MUFA synthesis.
A) Heatmap of all sphingolipid metabolism pathway genes and Scd2 from naïve or TLR2 activated WT and IL10 KO BMDMs from RNAseq analysis from samples matched to lipidomics analysis in Fig. 1 (TPMs must be above 0 to be listed). Values not scaled. B) Net synthesis (nmol/million cells) of palmitic acid (16:0) as measured by metabolic flux isotope tracer analysis in naïve or 48 h TLR2-activated (50 ng/mL Pam3CSK4) WT (white bars) or IL-10R KO (red bars) BMDMs (n = 4 per group). C) Total cellular 16:0 and 18:2 as measured by GCMS analysis of naïve or 48 h TLR2-activated (50 ng/mL Pam3CSK4) IL-10 KO BMDMs + BSA or 25uM 18:1(n = 4 per group). D) Total 18:1 in measured by GCMS analysis of naïve or 48 h TLR2-activated (50 ng/mL Pam3CSK4) IL-10 KO BMDMs + BSA or 25uM 18:1(n = 4 per group). E) qPCR analysis of Il6, Il1b and Il12b gene expression in naïve or 48 h TLR2-activated (50 ng/mL Pam3CSK4) WT (white bars) or IL-10R KO (blue bars) BMDMs incubated with vehicle (BSA), or BSA-conjugated 18:1 or 18:2 for the last 44 h of activation. (n = 3 per group). All lipids administered at a final concentration of 25 uM. F) Labeled Sphinganine measured by MS from 48 h TLR2-activated WT + BSA (vehicle), IL-10 KO + BSA (vehicle) or IL-10 KO + 25 uM 18:1 BMDMs (n = 4 per group). G) Total ceramides species measured by direct infusion MS from 48 h TLR2- activated IL-10 KO BMDMs plus BSA or BSA-18:1 for the last 44 h (n = 3−4). H) Heat map of individual ceramide species measured by direct infusion MS from 48 h TLR2-activated WT + BSA (vehicle), IL-10 KO + BSA (vehicle) or IL-10 KO + 25 uM 18:1 BMDMs (n = 3 per group). Scaled by row (lipid species). I) qPCR analysis of Il6 and Il1b gene expression in 48 h TLR2-activated (50 ng/mL Pam3CysK4) WT BMDMs supplemented with CholPC (vehicle), Cer24:0 or Cer24:1 for the last 44 h of activation (n = 3 per group). All ceramides administered at a final concentration of 30uM. J) qPCR analysis of Cxcl1 gene expression in 48 h TLR2-activated (50 ng/mL Pam3CysK4) WT BMDMs +/− DMSO (vehicle), 10 nM SCDi (Cay10566) +/− BSA or 25 uM 18:1 for the last 44 h. K) Total, saturated and unsaturated ceramide species measured by direct infusion MS from naïve or 48 h TLR2- activated WT BMDMs +/− DMSO (vehicle), 10 nM SCDi (Cay10566) +/− BSA or 25uM 18:1 for the last 44 h. L) Ceramide species measured by direct infusion MS from naïve or 48 h TLR2- activated WT BMDMs +/− DMSO (vehicle), 10 nM SCDi (Cay10566) +/− BSA or 25 uM 18:1 for the last 44 h. All experiments are reported as means ± SD from 3 independent experiments, unless noted otherwise. *P < 0.05; **P < 0.01, ***P < 0.005 (two-tailed unpaired Student’s t test). Source Data
Extended Data Fig. 6
Extended Data Fig. 6. MUFAs regulates de novo ceramide synthesis.
A. Net synthesis (nmol/million cells) of oleic acid (18:1) and palmitic acid (16:0) as measured by metabolic flux isotope tracer analysis in naïve or 48 h TLR2-activated (50 ng/mL Pam3CSK4) WT (white bars) or SCD2 cKO (green bars) BMDMs (n = 4 per group). B. Total cellular (nmol/million cells) abundance of oleic acid (18:1), palmitic acid (16:0) and linoleic acid (18:2) as measured by GCMS analysis of naïve or 48 h TLR2-activated (50 ng/mL Pam3CSK4) WT (white bars) or SCD2 cKO (green bars) BMDMs (n = 4 per group). C. Labeled sphinganine measured by LC-MS from 48 h TLR2-activated WT (white bars) or SCD2 cKO (green bars) BMDMs (n = 4 per group). D. Total Saturated and unsaturated ceramides species measured by direct infusion MS from naïve or TLR2-activated Cre+ WT (LysM Cre + /− SCD2WT/WT) and SCD2 cKO (LysM Cre + /− Scd2flox/flox) BMDMs (n = 4 per group). E. Total sphinganine measured by LC-MS from 48 h TLR2-activated Control (white bars), SCD2 cKO (green bars) or SCD2 cKO + 10 nM Myriocin (blue bars) BMDMs. Myriocin was spiked into culture for last 24 h of 48 h stim. (n = 3−4 per group). F. Cer24:0 in measured by LC-MS from 48 h TLR2-activated Control (white bars), SCD2 cKO (green bars) or SCD2 cKO +10 nM Myriocin (blue bars) BMDMs. Myriocin was spiked into culture for last 24 h of 48 h stim. (n = 3−4 per group). G. qPCR analysis of inflammatory gene expression from 48 h TLR2 activated Control (white bars), SCD2 cKO (green bars) or SCD2 cKO + 10 nM Myriocin (blue bars) BMDMs. Myriocin was spiked into culture for last 24 h of 48 h stim. (n = 4 per group). All experiments are reported as means ± SD from 3 independent experiments, unless noted otherwise. *P < 0.05; **P < 0.01, ***P < 0.005 (two-tailed unpaired Student’s t test). Source Data
Extended Data Fig. 7
Extended Data Fig. 7. SCD2 and MUFAs regulate colonic inflammation.
A) Flow cytometry based immune cell profiling of the colonic lamina propria from Control (LysM Cre +/−) and SCD2 cKO (LysM Cre +/− Scd2flox/flox) naïve male mice (n = 8−9 per genotype). B) ELISA analysis of IL-12B (IL12p40) from colonic explants of naïve Control (LysM Cre +/−) and SCD2 cKO (LysM Cre +/− Scd2flox/flox) male mice incubated ex vivo for 24 h. (n = 6−9 per genotype). C) Flow cytometry based immune cell profiling of the colonic lamina propria from Control (LysM Cre +/−) and SCD2 cKO (LysM Cre +/− Scd2flox/flox) female mice harvested on day 12 of DSS challenge (n = 9 per genotype). D) Weight loss measured during DSS-induced colitis in Control (LysM Cre +/−), SCD2 conditional heterozygous (Het) (LysM Cre +/−, Scd2 flox/WT) and SCD2 cKO (LysM Cre +/− Scd2 flox/flox) female mice (n = 6-11 per group). Red stars indicated statistical differences between Control and SCD2 cKO mice, while black stars represent statistical differences between Control and Het mice. There is no statistical difference in weight loss between SCD2 cHet and SCD2 cKO animals. Error bars represent Standard Error of the Mean (SEM). E) ELISA analysis of lipocalin from feces of Day 0: heterozygous (het) vs IL-10R KO mice, (all male mice). F) ELISA analysis of lipocalin from feces of Day 0: IL-10 KO female mice versus Day 14: IL-10 KO mice gavaged with BSA or BSA-18:1 (all female mice). G) Flow cytometry based myeloid cell profiling of the colonic lamina propria from heterozygous (het) mice gavaged with BSA, IL-10R KO mice gavaged with BSA or IL-10R KO mice gavaged with BSA-24:1 (all male mice). H) Flow cytometry based myeloid cell profiling of the colonic lamina propria from WT mice gavaged with BSA, IL-10 KO mice gavaged with BSA or IL-10 KO mice gavaged BSA-18:1 (all female mice). I) Flow cytometry based myeloid cell profiling of the colonic lamina propria from heterozygous (het) mice gavaged with BSA, IL-10R KO mice gavaged with BSA or IL-10R KO mice gavaged with BSA-16:0 (all male mice). All experiments are reported as means ± SD from 3 independent experiments, unless noted otherwise. *P < 0.05; **P < 0.01, ***P < 0.005 (two-tailed unpaired Student’s t test). Source Data
Extended Data Fig. 8
Extended Data Fig. 8. c-Rel mediated ceramide induced inflammation.
A) ELISA analysis of IL-1B from the supernatants of WT BMDMs activated with TLR2 ligand, treated with CholPC (vehicle), Cer22:0, Cer24:0 for 48 h. Nigericin control was 1 h incubation after 48 h TLR2 ligand priming. All lipids were delivered at a final concentration of 30uM. B) qPCR analysis of inflammatory gene expression in WT or NLRP3 KO BMDMs activated with TLR2 ligand (50 ng/mL Pam3CysK4) for 48 h. TLR2-activated macrophage were incubated with Cholesteryl:Phosphatidylcholine (CholPC) lipid sheets alone or with CholPC loaded with ceramide 24:0 (Cer24:0) for the last 44 h of the activation (n = 3 for each group). All lipids administered at a final concentration of 30 uM. C) Western blot analysis of nuclear extracts from naïve, 1 h, 24 h, and 48 h TLR2-activated WT and IL-10R KO BMDMs for RelA, cRel and TBP (loading control). Representative of 2x individual experiments. D) Western blot analysis of whole cell lysates from naïve, 1 h or 24 h TLR2 activated WT and IL-10R KO BMDMs for c-Rel, Iκβα and β-tubulin (loading control). E) Western blot analysis of nuclear extracts from naïve or 24 h TLR2-activated WT peritoneal macrophage plus CholPC (vehicle), Cer16:0, Cer24:0 or anti-IL-10R neutralizing antibody (5 ug/mL) for the last 20 h of the activation for cRel and TBP (loading control). Representative of 4x individual experiments. F) Western blot analysis of whole cell lysates from 24 h TLR2 activated WT BMDMs treated with CholPC or 30 uM Cer24:0 or IL-10R KO BMDMs for Iκβα and β-tubulin (loading control). Representative of 2x individual experiments. G) Western blot analysis of nuclear extracts and whole cell lysates from naïve or 48 h TLR2-activated (indicated in Red) WT or c-Rel KO BMDMs plus CholPC (vehicle) or 30 uM Cer24:0 for the last 44 h of activation for RelA, c-Rel with B-Tubulin and TBP as loading controls. RelA was blotted in parallel with cRel and, B Tub and TBP. Representative of 2x individual experiments. H) qPCR analysis of inflammatory gene expression in 48 h TLR4-activated (50 ng/mL LPS) WT or cRel KO BMDMs plus CholPC (vehicle), 30 uM Cer22:0 or 30 uM Cer24:0 for the last 44 h of activation (n = 3 per group). I) Ceramide species in WT and c-Rel KO BMDMs activated with TLR2 ligand (50 ng/mL Pam3CysK4) for 48 h measured by direct infusion MS (n = 4). J) Total Cer24:0 after exogenous 30 uM Cer24:0 addback to WT or c-Rel KO BMDMs activated with TLR2 ligand (50 ng/mL Pam3CysK4 for 48 h measured by direct infusion MS (n = 3−4). All experiments are reported as means ± SD from 3 independent experiments, unless noted otherwise. *P < 0.05; **P < 0.01, ***P < 0.005 (two-tailed unpaired Student’s t test). Source Data
Extended Data Fig. 9
Extended Data Fig. 9. c-Rel is required for late stage inflammation in vitro and in vivo.
A. Western blot analysis of nuclear extracts from naïve or 48 h TLR2-activated Cre+ WT (LysM Cre +/− SCD2WT/WT) and SCD2 cKO (LysM Cre +/− Scd2flox/flox) plus BSA or BSA-18:1 for the last 44 h of the activation for cRel and TBP (loading control). Representative of 2x individual experiments. B. qPCR analysis of inflammatory gene expression in 1 h TLR2-activated (50 ng/mL Pam3CysK4) WT or c-Rel KO BMDMs (n = 3 per group). C. qPCR analysis of inflammatory gene expression in 48 h TLR2-activated (50 ng/mL Pam3CysK4) WT, IL-10 KO or IL-10/c-Rel DKO BMDMs (n = 3 per group). D. qPCR analysis of inflammatory gene expression in 48 h TLR2-activated WT or cRel KO BMDMs + anti-IL-10R neutralizing antibody (5 ug/mL), +/− Cer24:0 for the last 44 h of the activation (n = 3 per group). E. ELISA analysis of IL-12B (IL12p40) from colonic explants of WT, IL-10 KO or IL-10/cREL DKO male mice incubated ex vivo for 24 h. (n = 7−8). F. ELISA analysis of fecal lipocalin from WT, IL-10 KO and IL-10/c-Rel DKO mice (n = 7−8). G. Flow cytometry based Immune cell profiling of the colonic lamina propria from naive WT, IL-10 KO or IL-10/c-Rel DKO male mice (n = 7−8). All experiments are reported as means ± SD from 3 independent experiments, unless noted otherwise. *P < 0.05; **P < 0.01, ***P < 0.005 (two-tailed unpaired Student’s t test). Source Data

Update of

Similar articles

Cited by

References

    1. Saraiva M, O’Garra A. The regulation of IL-10 production by immune cells. Nat. Rev. Immunol. 2010;10:170–181. doi: 10.1038/nri2711. - DOI - PubMed
    1. Zhu L, et al. IL-10 and IL-10 receptor mutations in very early onset inflammatory bowel disease. Gastroenterology Res. 2017;10:65–69. doi: 10.14740/gr740w. - DOI - PMC - PubMed
    1. Glocker EO, Kotlarz D, Klein C, Shah N, Grimbacher B. IL-10 and IL-10 receptor defects in humans. Ann. NY Acad. Sci. 2011;1246:102–107. doi: 10.1111/j.1749-6632.2011.06339.x. - DOI - PubMed
    1. Li B, Alli R, Vogel P, Geiger TL. IL-10 modulates DSS-induced colitis through a macrophage–ROS–NO axis. Mucosal Immunol. 2014;7:869–878. doi: 10.1038/mi.2013.103. - DOI - PMC - PubMed
    1. Groux H, Cottrez F. The complex role of interleukin-10 in autoimmunity. J. Autoimmun. 2003;20:281–285. doi: 10.1016/S0896-8411(03)00044-1. - DOI - PubMed