. 2024 Mar;627(8002):221-228.
doi: 10.1038/s41586-024-07103-x. Epub 2024 Feb 21.

Mechanisms of action and resistance in histone methylation-targeted therapy

Affiliations

Mechanisms of action and resistance in histone methylation-targeted therapy

Makoto Yamagishi et al. Nature. 2024 Mar.

Abstract

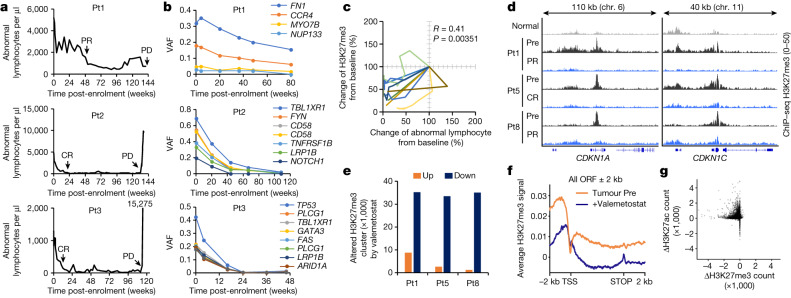
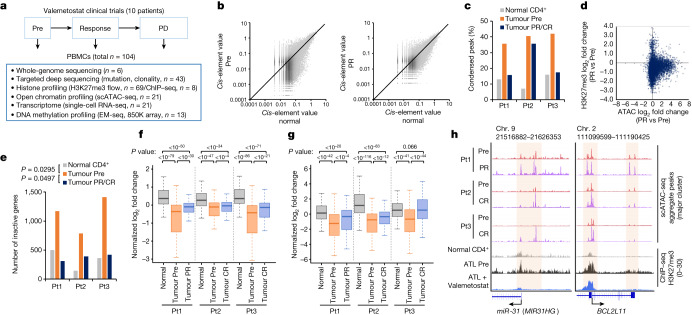
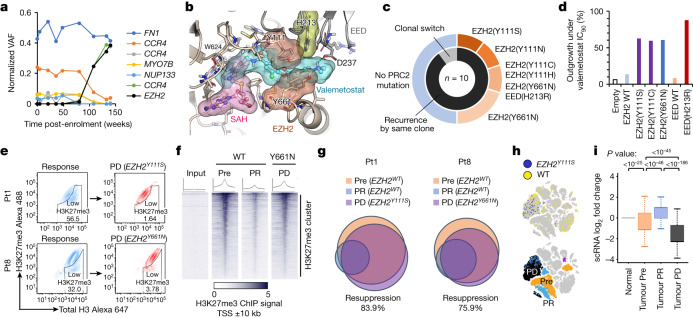
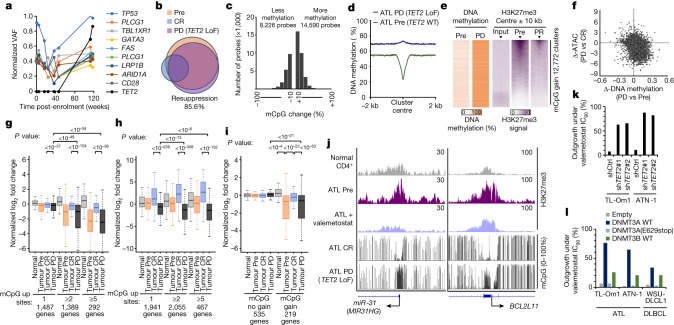
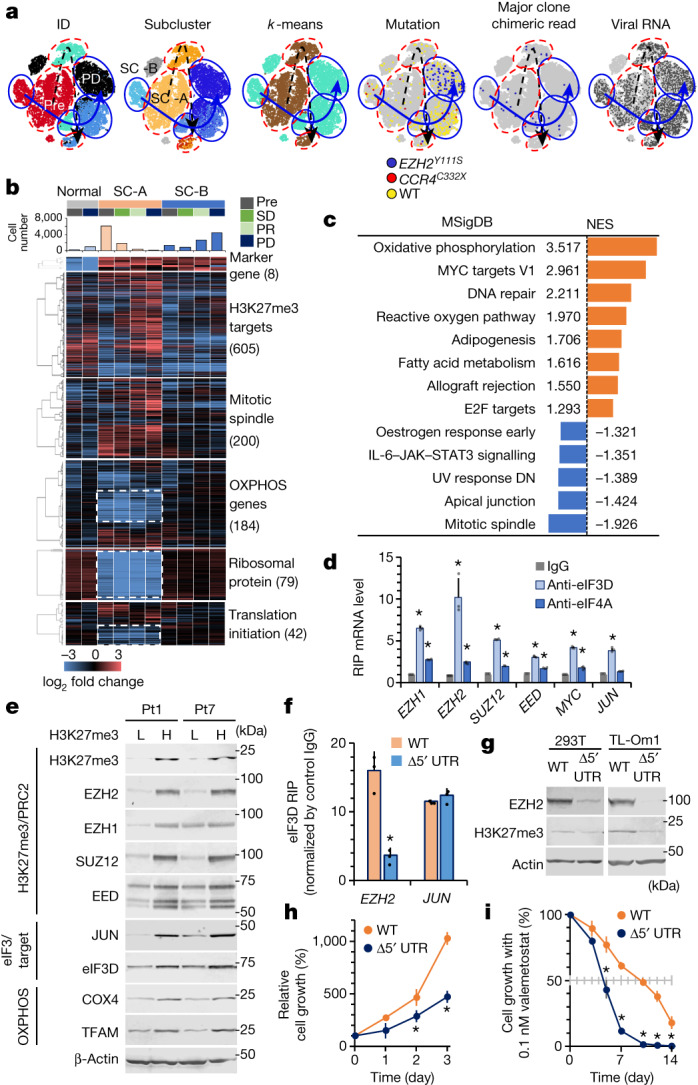
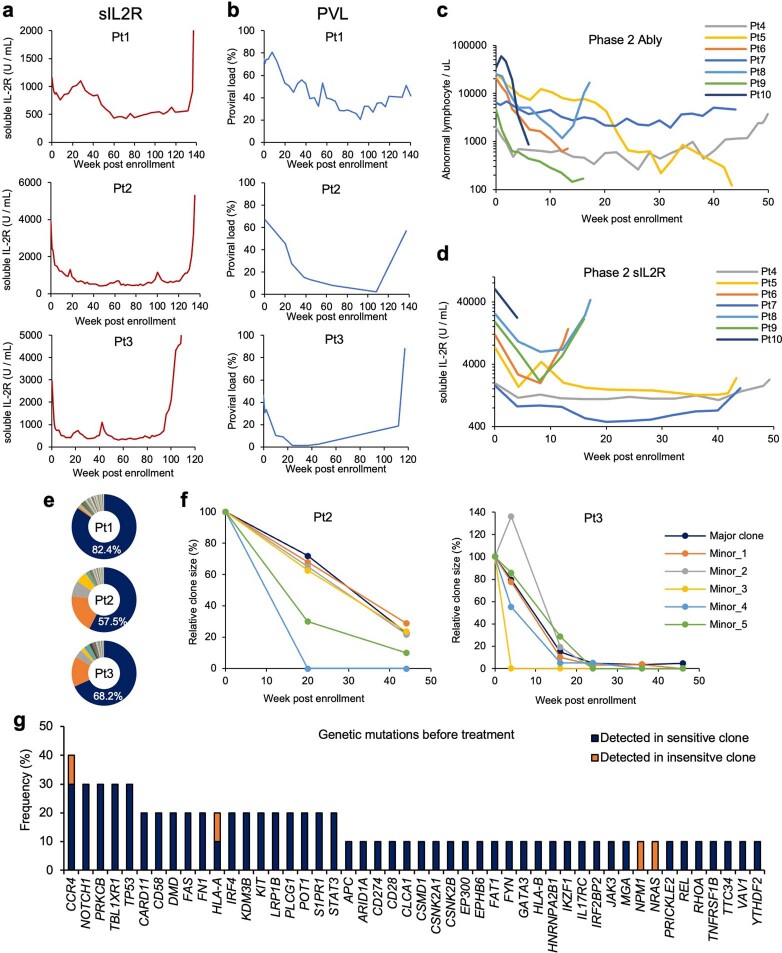
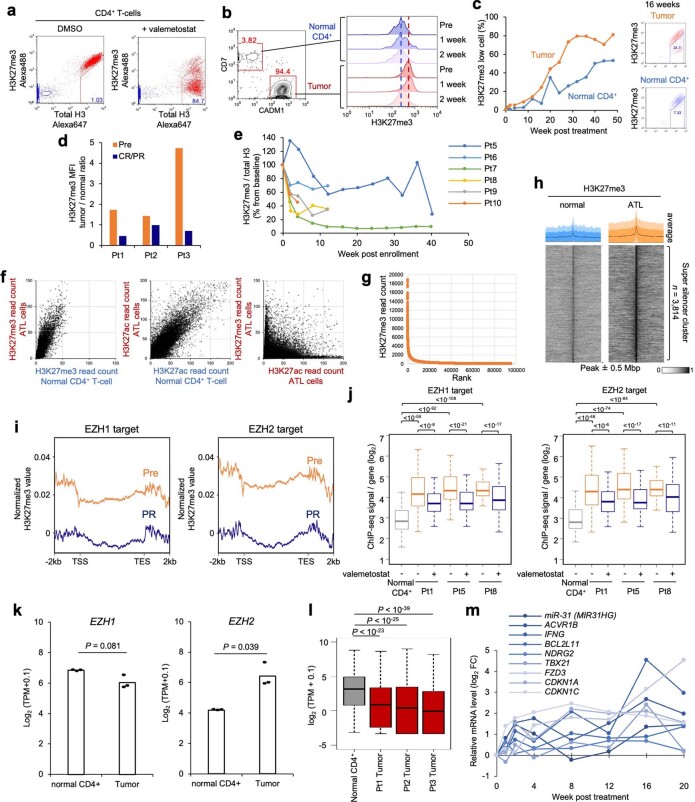
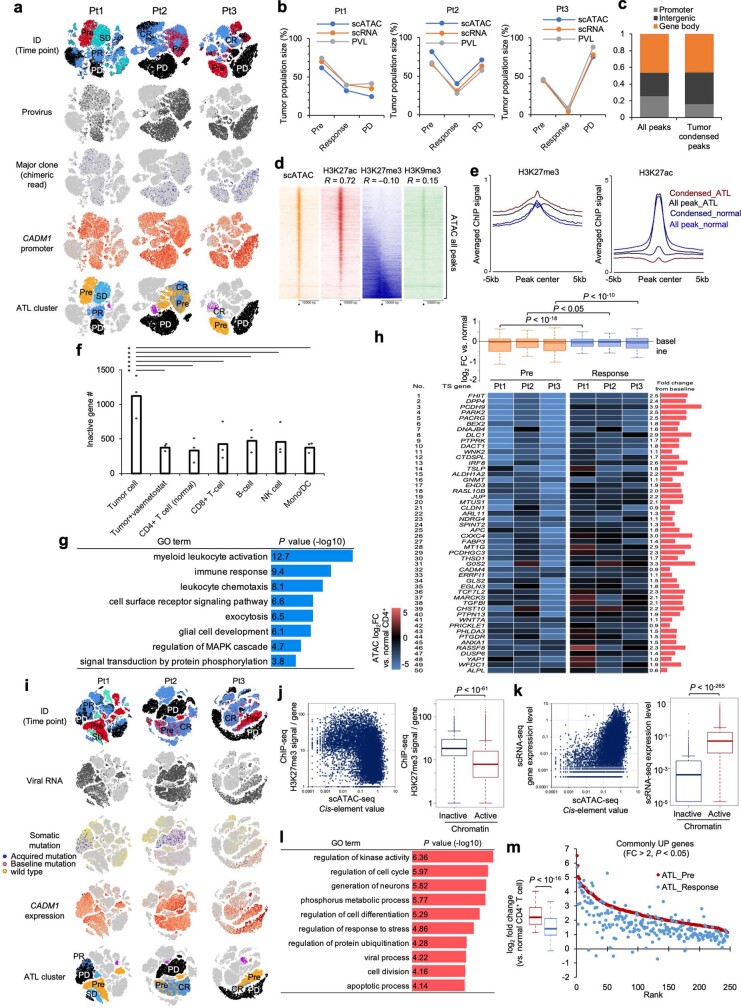
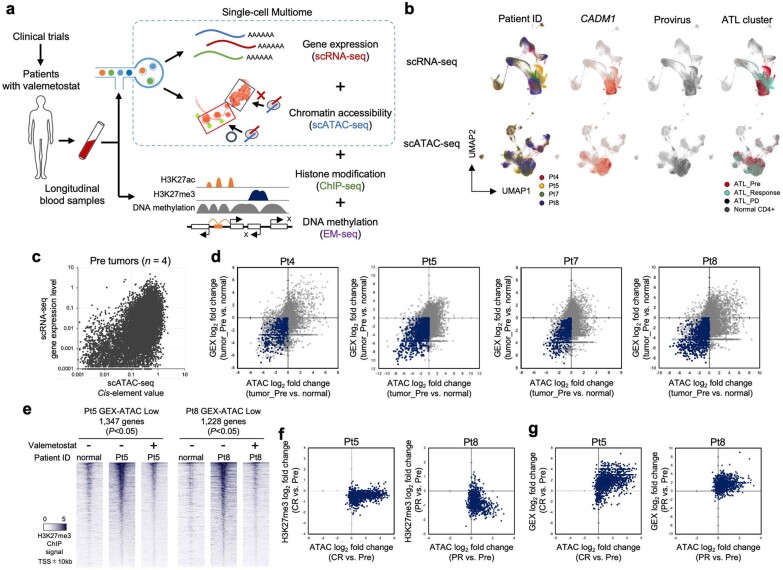
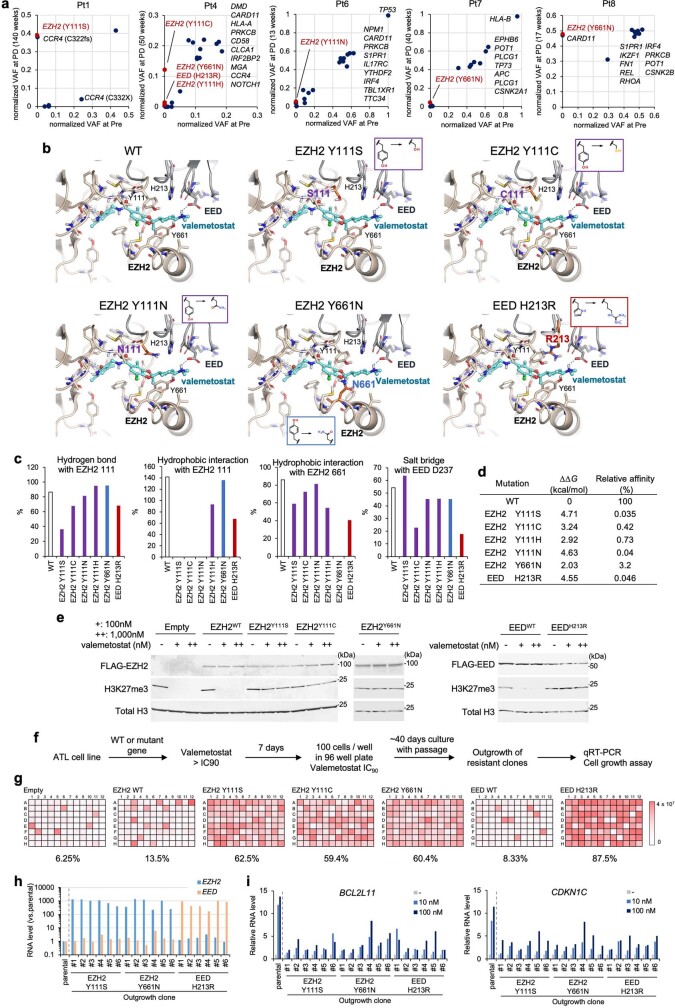
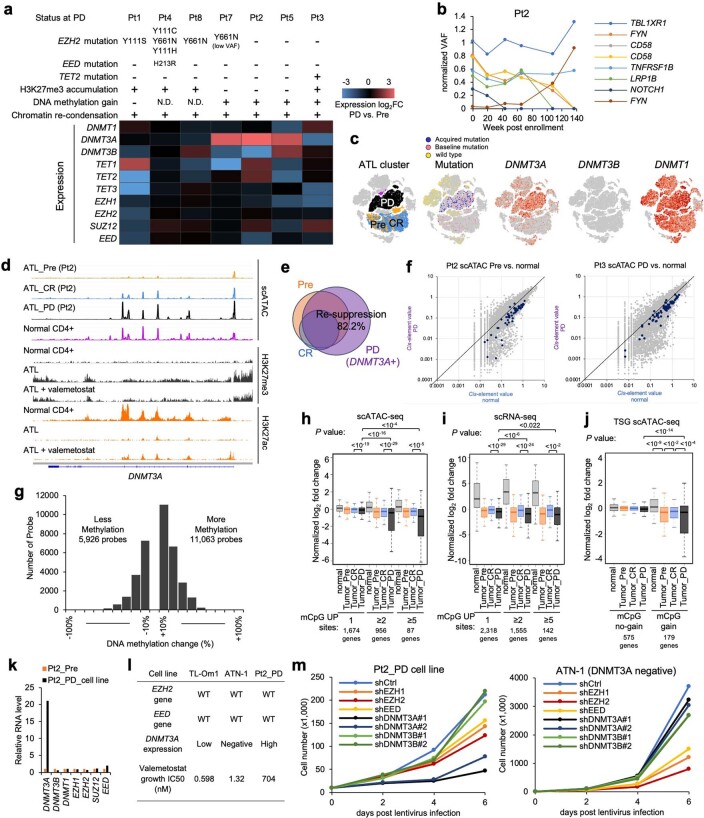
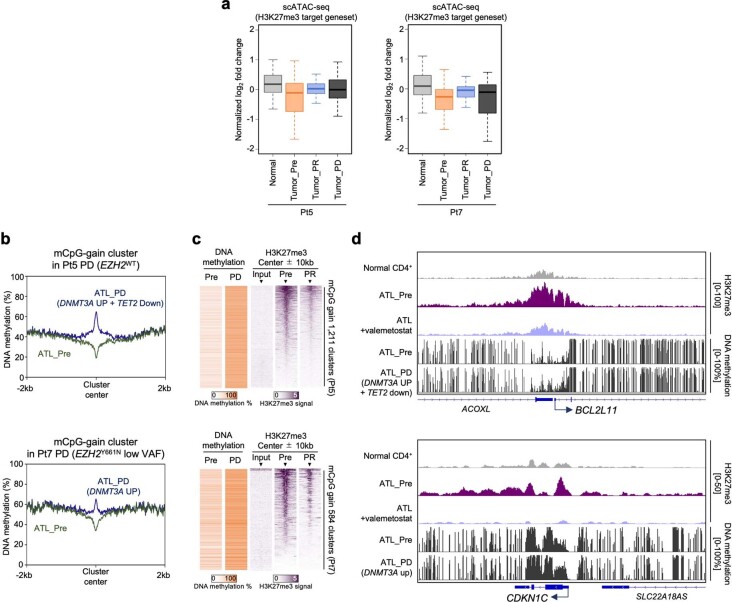
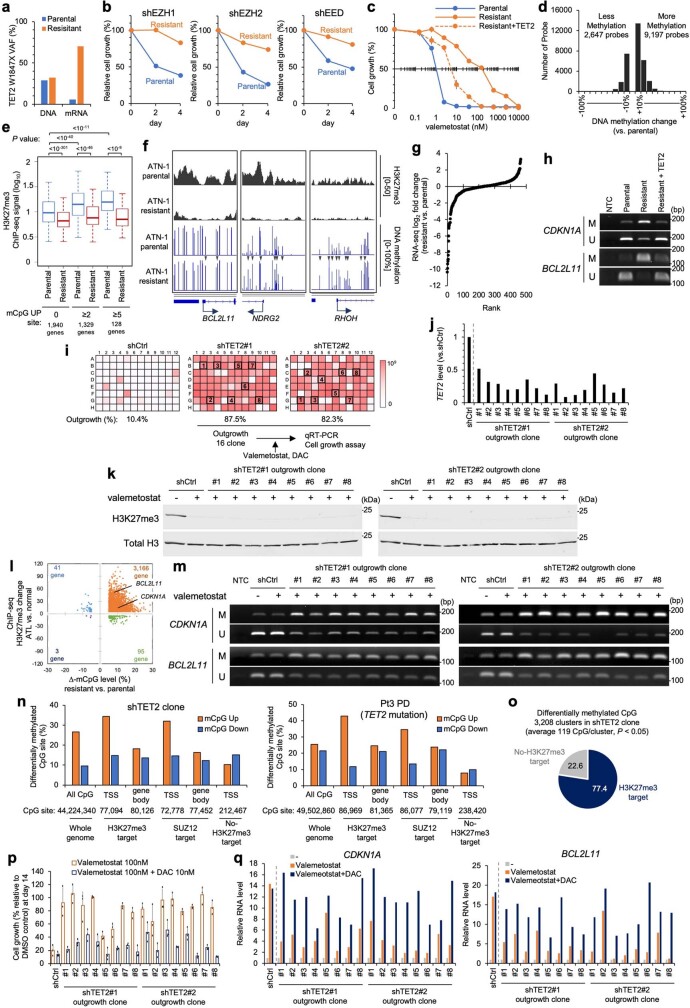
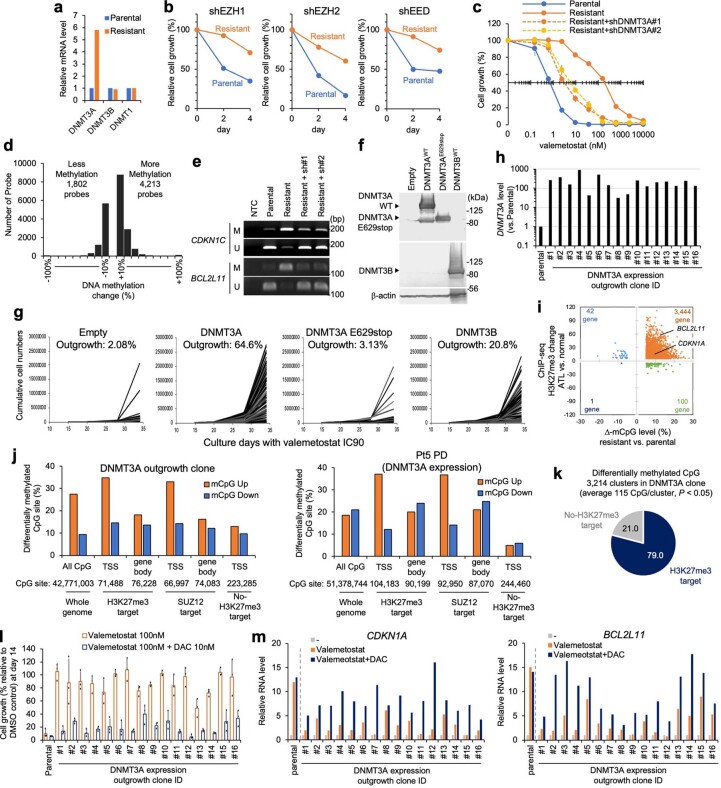
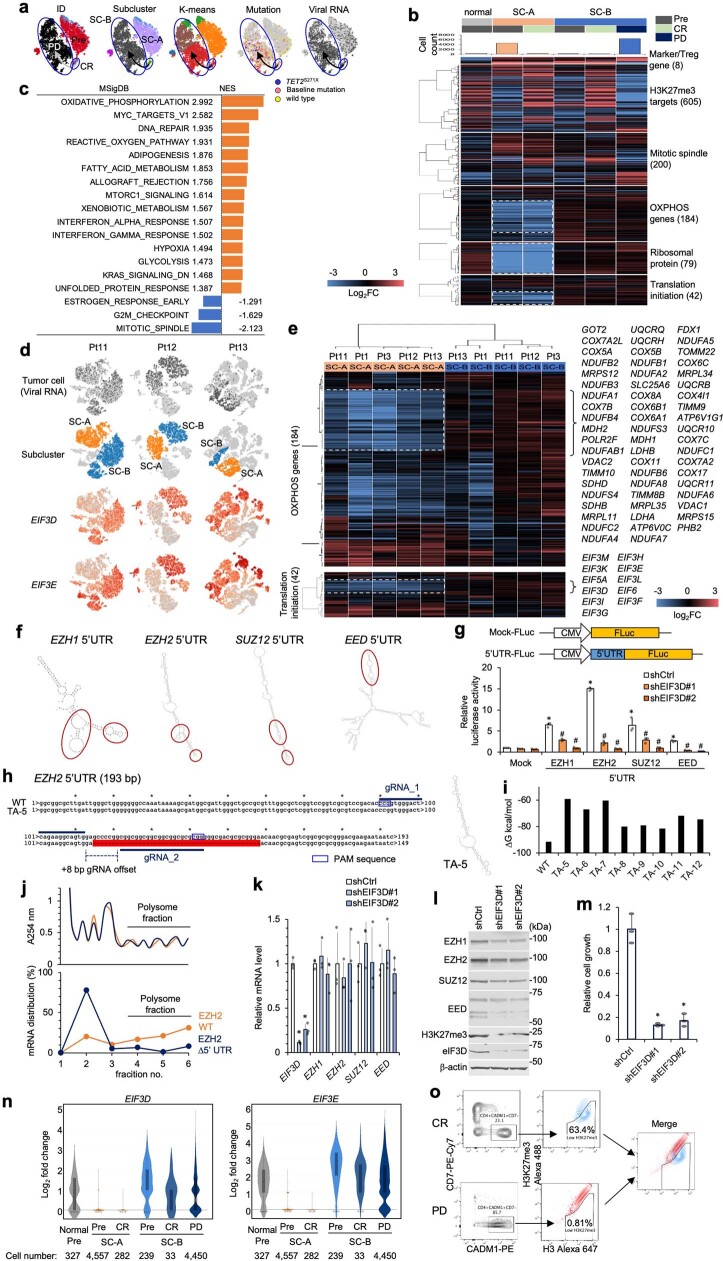
Epigenomes enable the rectification of disordered cancer gene expression, thereby providing new targets for pharmacological interventions. The clinical utility of targeting histone H3 lysine trimethylation (H3K27me3) as an epigenetic hallmark has been demonstrated1-7. However, in actual therapeutic settings, the mechanism by which H3K27me3-targeting therapies exert their effects and the response of tumour cells remain unclear. Here we show the potency and mechanisms of action and resistance of the EZH1-EZH2 dual inhibitor valemetostat in clinical trials of patients with adult T cell leukaemia/lymphoma. Administration of valemetostat reduced tumour size and demonstrated durable clinical response in aggressive lymphomas with multiple genetic mutations. Integrative single-cell analyses showed that valemetostat abolishes the highly condensed chromatin structure formed by the plastic H3K27me3 and neutralizes multiple gene loci, including tumour suppressor genes. Nevertheless, subsequent long-term treatment encounters the emergence of resistant clones with reconstructed aggregate chromatin that closely resemble the pre-dose state. Acquired mutations at the PRC2-compound interface result in the propagation of clones with increased H3K27me3 expression. In patients free of PRC2 mutations, TET2 mutation or elevated DNMT3A expression causes similar chromatin recondensation through de novo DNA methylation in the H3K27me3-associated regions. We identified subpopulations with distinct metabolic and gene translation characteristics implicated in primary susceptibility until the acquisition of the heritable (epi)mutations. Targeting epigenetic drivers and chromatin homeostasis may provide opportunities for further sustained epigenetic cancer therapies.


Conflict of interest statement

M.Y., Y.S. and K.U. received research funding from Daiichi Sankyo Co., Ltd. I.Y. is an employee of Daiichi Sankyo RD Novare Co., Ltd. G.T., Y.H., K.Ito and S.T. are employees of Daiichi Sankyo Co., Ltd. Daiichi Sankyo Co., Ltd holds substance patents on valemetostat. The University of Tokyo and Daiichi Sankyo Co., Ltd hold patents for application of valemetostat to patients with ATL and individuals infected with HTLV-1. M.Y. and T.W. are named as inventors. All other authors declare no competing interests.

Figures

Fig. 1
Fig. 1. Antitumour effect of valemetostat.
a, Changes in abnormal lymphocytes of three cases in a first-in-human valemetostat phase I study. Valemetostat was administered orally once daily (200 mg daily) until a sign of disease progression was observed. Clinical diagnoses (partial response (PR), complete response (CR) and progressive disease (PD)) are annotated. b, Changes in variant allele frequency (VAF) of major somatic mutations from the initiation of treatment identified by targeted deep sequencing of peripheral blood. c, Correlation between changes of abnormal lymphocyte and H3K27me3 from baseline (%) in nine patients. d, Representative tracks (CDKN1A and CDKN1C loci) for H3K27me3 in Pt1, Pt5 and Pt8 before and after valemetostat treatment. Chr., chromosome. e, The number of altered H3K27me3 clusters after treatment in three cases detected by ChIP–seq. f, Average ChIP–seq signal profiles for H3K27me3 in tumour baseline (Pre) and after treatment (48 weeks) around the TSS and across the gene body. ORF, open reading frame. g, Treatment-associated changes of H3K27me3 (x axis) and H3K27ac (y axis) at ChIP–seq-merged all peaks. Statistics and reproducibility are described in the Methods. Source Data
Fig. 2
Fig. 2. Chromatin decondensation by valemetostat.
a, The workflow illustrates the collection and processing of fresh peripheral blood samples from a clinical trial and the following multilayered experimental platform. ChIP–seq, chromatin immunoprecipitation with sequencing. EM-seq, enzymatic methyl sequencing. b, All ATAC peak values (total 69,544 peaks) of tumour cells (y axis) at pre-treatment (left) and after treatment (48 weeks; right) versus normal CD4+ T cells (x axis) in a representative case (Pt1). c, Proportion of chromatin-condensed peaks (cis-element value < 0.01) from scATAC-seq data in three patients. d, Scatter plot of log2 fold changes of ATAC (x axis) and H3K27me3 (y axis) at partial response (48 weeks) for all gene promoter regions in Pt1. e, Numbers of chromatin inactive genes (promoter sum < 0.01) in three patients. f,g, Box plots summarize normalized log2 fold changes of scATAC-seq promoter activities (f) and scRNA-seq gene expression (g) at H3K27me3 target genes (563 genes) in three patients. Statistical significance is provided only for main combinations. The middle line within the box plots corresponds to the median; the lower and upper hinges correspond to the first and third quartiles; the upper whisker extends from the hinge to the largest value no further than 1.5 times the interquartile range (IQR); and the lower whisker extends from the hinge to the smallest value at most 1.5 times the IQR. h, Aggregate scATAC tracks and H3K27me3 distribution before and after valemetostat treatment at the representative H3K27me3 target loci (miR-31 and BCL2L11) in three patients. Highlighted regions show chromatin decondensation by valemetostat. Statistics and reproducibility are described in the Methods. Source Data
Fig. 3
Fig. 3. Mechanisms of resistance to valemetostat.
a, Chronological transition of VAF values (normalized by proviral load) for somatic mutations identified by deep sequencing in Pt1 in relation to treatment with valemetostat. b, Model of the PRC2–valemetostat complex superimposed on the PRC2–S-adenosyl-l-homocysteine (SAH) complex, with molecular surfaces of ligands and mutation sites on EZH2 and/or EED identified in the clinical trials. c, Nested pie chart shows the proportion of PRC2 mutations and clonal characteristics at progressive disease. d, ATL cells (TL-Om1) with PRC2 mutations were treated with valemetostat (90% inhibitory concentration (IC90) or more) and monitored for outgrowth for 37 days. The bar graph shows the percentage of recovered outgrowth clones (outgrowth activity among 96 clones) for each cell with PRC2 mutations. WT, wild type. e, H3K27me3 staining of PBMCs in Pt1 and Pt8 gated on CD4+CADM1+CD7 tumour cell populations at clinical response and at progressive disease. f, Heat maps of H3K27me3 ChIP–seq peaks centred on the TSS (20-kb windows) at H3K27me3 clusters in tumours from Pt8 at Pre, partial response and progressive disease (EZH2Y661N). g, Venn diagram depicts overlapped chromatin-condensed inactive genes (promoter sum < 0.01) in tumour cells from Pt1 and Pt8 at Pre, partial response and progressive disease. h, t-SNE projection of scRNA-seq data in Pt1, with cells coloured according to EZH2Y111S RNA status (top) and assigned major tumour clusters (bottom). i, Normalized log2 fold changes of scRNA-seq gene expression at the chromatin-condensed inactive genes from Pt1 (scATAC-seq promoter sum < 0.01 before treatment, n = 1,080 genes). The middle line within box plots corresponds to the median; the lower and upper hinges correspond to the first and third quartiles; the upper whisker extends from the hinge to the largest value no further than 1.5 times the IQR; and the lower whisker extends from the hinge to the smallest value at most 1.5 times the IQR. Statistics and reproducibility are described in the Methods. Source Data
Fig. 4
Fig. 4. Non-genetic mechanisms of resistance to valemetostat.
a, Chronological transition of normalized VAF values for somatic mutations in Pt3. b, Venn diagram depicts overlapped chromatin-condensed inactive genes (promoter sum < 0.01) in tumour cells from Pt3. LoF, loss of function. c, Histogram shows differentially methylated (ΔmCpG < −10% or ΔmCpG > 10%) probes in resistant tumour from Pt3 at progressive disease (118 weeks) versus pre-treatment tumour. d, Whole-genome DNA methylation profiling detected progressive disease-associated mCpG acquisition clusters. The plot shows average DNA methylation (%) in tumour baseline (Pre) and at progressive disease centred by mCpG gain 12,772 clusters. e, Heat maps of DNA methylation and H3K27me3 ChIP–seq peaks (20-kb windows) at progressive disease-associated mCpG gain clusters. The arrowheads indicate cluster centre. f, Correlation between Δ-DNA methylation (%) and Δ-scATAC-seq promoter sum in the resistant cells versus pre-treatment cells from Pt3. g,h, Normalized log2 fold changes of scATAC-seq promoter activities (g) and scRNA-seq gene expression (h) in relation to treatment-associated mCpG gain in Pt3. Statistical significance is provided only for main combinations. i, Normalized log2 fold changes of scATAC-seq promoter activities of TSGs. Statistical significance is provided only for main combinations. In gi, the middle line within box plots corresponds to the median; the lower and upper hinges correspond to the first and third quartiles; the upper whisker extends from the hinge to the largest value no further than 1.5 times the IQR; and the lower whisker extends from the hinge to the smallest value at most 1.5 times the IQR. j, Representative tracks for H3K27me3 (ChIP–seq) and methylated CpG tracks (EM-seq) (16 weeks (complete response) and 118 weeks (progressive disease) with TET2 LoF) around the TSS. k,l, Bar graphs show the percentage of recovered outgrowth clones (outgrowth activity among 96 clones) under the valemetostat IC90 or higher condition for each lymphoma cell with TET2 knockdown (k) and ectopic DNMT3A or DNMT3B expression (l). DLBCL, diffuse large B cell lymphoma; shCtrl, control shRNA. Statistics and reproducibility are described in the Methods. Source Data
Fig. 5
Fig. 5. Intrinsic subpopulations with differential susceptibility.
a, t-SNE projection of scRNA-seq data in Pt1, with cells coloured according to sample ID, subclustering based on clinical time order or k-means, and profiles of mutations and virus reads. Black dashed arrows indicate clinical time order of SC-A; blue solid arrows indicate clinical time order of SC-B. b, Clustered heat maps depict expression levels of genes involved in differentially enriched categories in subclusters SC-A and SC-B in Pt1. Genes highlighted by white dashed lines indicate genes significantly decreased in SC-A. SD, stable disease. c, Hallmark gene set enrichment analysis of scRNA-seq data from Pt1 SC-B before valemetostat treatment compared with SC-A. For all pathways shown, significantly enriched gene sets were evaluated by normalized enrichment score (NES) and nominal P value (P < 0.001). DN, down-regulated. d, RIP assay for PRC2 gene mRNA. eIF complexes were immunopurified from TL-Om1 cells using antibodies to eIF3D and eIF4A. eIF-associated mRNA was quantified by quantitative PCR. The graph shows the fold change in the enrichment relative to the control IgG. n = 3 independent experiments, mean ± s.d., *P < 0.05. e, Immunoblots show protein levels of H3K27me3, PRC2, eIF3D and OXPHOS mitochondrial factors in H3K27me3 higher (H) and lower (L) cells from Pt1 and Pt7 after valemetostat treatment. Electrophoresis experiments with independent patient samples were performed once. f, Quantification of eIF3D-bound PRC2 gene mRNA in 293T cells with EZH2 WT and EZH2 Δ5′ UTR by RIP assay. n = 3 independent experiments, mean ± s.d., *P = 0.00861. g, Protein levels of EZH2 and H3K27me3 in cells with EZH2 WT and EZH2 Δ5′ UTR. h, Relative cell growth rate (%) over time in TL-Om1 cells with EZH2 WT and EZH2 Δ5′ UTR. n = 3 independent experiments, mean ± s.d., *P < 0.05. i, Growth inhibition rate (%) over time by 0.1 nM valemetostat in TL-Om1 cells with EZH2 WT and EZH2 Δ5′ UTR. n = 3 independent experiments, mean ± s.d., *P < 0.05. Statistics and reproducibility are described in the Methods. For gel source data, see Supplementary Fig. 1. Source Data
Extended Data Fig. 1
Extended Data Fig. 1. Clinical efficacy and genomic profiling in valemetostat trials.
a, b, Changes over time in soluble IL2 receptor (sIL-2R) (a) and proviral loads (PVL) (b) of three cases in valemetostat phase 1 study. c, d, Changes in abnormal lymphocytes (c) and sIL-2R (d) of 7 cases in valemetostat phase 2 study. e, Pie charts show baseline clonalities in three patients. The clonality of HTLV-1-infected cells before valemetostat treatment was calculated as the population size of each clone by counting the extracted reads at host-provirus junction sites using high-throughput sequencing based mapping of proviral integration sites. f, Changes over time in the size of top 5 clones in Pt2 (left) and Pt3 (right) after treatment with valemetostat. g, Frequency of somatic mutations detected by targeted genome sequencing in valemetostat phase 1 and 2 studies (n = 10, biologically independent samples). Source Data
Extended Data Fig. 2
Extended Data Fig. 2. H3K27me3 reduction by valemetostat.
a, Establishment of H3K27me3-flow system. Intracellular H3K27me3 / total histone H3 were stained with specific antibodies in PHA-activated PBMC. Treatment with 100 nM valemetostat for 7 days significantly reduced the H3K27me3 level. Red cells, antibody + ; blue cells, isotype control. b, H3K27me3 levels in tumor (CD4+/CADM1+/CD7) and normal (CD4+/CADM1/CD7+) cell populations at 0, 1, and 2 weeks post valemetostat treatment in Pt1. Dashed lines indicate baselines. c, Changes over time in population size of low H3K27me3 cells (%) in Pt1. d, Tumor H3K27me3 levels (mean fluorescence intensity, MFI) normalized by the level of normal CD4+ T-cells at pre-treatment (Pre) and at the time of clinical response (PR/CR). e, Changes of tumor H3K27me3 level (% from baseline) in valemetostat phase 2 study. f, ChIP-seq signal values of H3K27me3 (left panel) and H3K27ac (middle panel) at all gene promoters (32,747 genes) in Pt1 tumor cells (y-axis) versus normal CD4+ T-cells (x-axis). The distribution of the H3K27me3 and H3K27ac peaks was mutually exclusive (right panel). g, h, H3K27me3 enriched super-silencer clusters in ATL cells. Rank ordering of H3K27me3 ChIP-seq signals identified the super-silencer clusters (g). Heatmaps and average profiles show ChIP-seq signals centered on peaks, ranked by mean H3K27me3 level, in normal CD4+ T-cells and ATL cells (h). i, j, Average ChIP-seq TSS-TES plot (i) and H3K27me3 log10 signals at promoter regions (j) bound by EZH1 (n = 347 genes) and EZH2 (n = 269 genes) in Pt1, Pt5, and Pt8. EZH1 and EZH2 ChIP data resources were re-analyzed. k, l, Baseline expression [Log2(TPM + 0.1)] of EZH1 and EZH2 mRNA (k) and H3K27me3 target genes (n = 630) (l) in tumor cells from three patients and normal CD4+ T cells from healthy donors. Tumor-specific RNA was collected by CD4+/CADM1+/CD7 cell sorting and analyzed by RNA-seq. m, Relative expression changes (log2 fold-change) of the representative H3K27me3 target genes post valemetostat treatment in Pt1. The middle lines within box plots correspond to the medians; lower and upper hinges correspond to the first and third quartiles. The upper whisker extends from the hinge to the largest value no further than 1.5 * IQR. The lower whisker extends from the hinge to the smallest value at most 1.5 * IQR. Statistics and reproducibility are described in Methods. Source Data
Extended Data Fig. 3
Extended Data Fig. 3. Characterization of tumor chromatin architecture and transcriptome.
a, Summary of scATAC-seq clustering (n = 10 from 3 patients). Cells were colored according to sample timepoint, provirus, host-virus chimeric reads, CADM1 promoter activity, and assigned major tumor clusters. b, Tumor population size (%) before and after valemetostat treatment inferred by scATAC-seq, scRNA-seq, and PVL. c, Features of tumor-associated chromatin condensed peaks. d, Heatmaps of all ATAC 69,545 peaks and associated ChIP values of H3K27me3, H3K9me3, H3K27ac in Pt1 tumor cells. Each correlation coefficient (R) between histone mark and ATAC peak are provided. e, Average ChIP-seq signal profiles for H3K27me3 (left) and H3K27ac (right) at chromatin condensed peaks in tumor cells and normal CD4+ T-cells around peak center. f, Numbers of chromatin-inactivated genes (Promoter sum <0.01) in peripheral blood cell lineage from scATAC-seq data (n = 3 biologically independent samples, * P < 0.05). g, Bar graph shows enriched gene ontology terms with one-sided Fisher’s exact P values (−Log10) for commonly inactivated genes (Promoter sum <0.01 in three patients). h, Reactivation of TSG by valemetostat treatment. Boxplot (top panel) shows normalized log2 fold changes of scATAC-seq promoter activities by valemetostat treatment in TSG (n = 716 genes). Heatmap (bottom panel) show scATAC-seq promoter activities (log2 fold-change) of top 50 TSG in major clones of three patients before and after valemetostat treatment. i, Summary of scRNA-seq clustering (n = 10 from 3 patients). Cells were colored according to sample timepoint, viral RNA, mutated RNA, CADM1 expression, and assigned major tumor clusters. j, Data integration of scATAC-seq and H3K27me3 ChIP-seq in Pt1. Scatter plot (left) shows scATAC-seq promoter activity (x-axis) and H3K27me3 ChIP-seq signals (y-axis) for all gene promoter regions. Boxplot (right) summarizes H3K27me3 signals at active (Promoter sum > 0.01, 11,310 gene) and inactive (Promoter sum <0.01, 1,032 gene) promoter regions. k, Data integration of scATAC-seq and scRNA-seq in Pt1. Scatter plot (left) shows scATAC-seq promoter activity (x-axis) and scRNA-seq expression level (y-axis) for all genes. Boxplot (right) summarizes gene expression levels at active (Promoter sum > 0.01) and inactive (Promoter sum <0.01) genes. l, Bar graph shows enriched gene ontology terms with one-sided Fisher’s exact P values (−log10) for commonly overexpressed genes in ATL cells (Gene expression log2 fold-change > 2 versus normal T-cells in three patients, 246 genes, P < 0.05). m, Average (n = 3 biologically independent samples) of normalized log2 fold changes for commonly overexpressed genes before and after valemetostat treatment. The middle lines within box plots correspond to the medians; lower and upper hinges correspond to the first and third quartiles. The upper whisker extends from the hinge to the largest value no further than 1.5 * IQR. The lower whisker extends from the hinge to the smallest value at most 1.5 * IQR. Statistics and reproducibility are described in Methods. Source Data
Extended Data Fig. 4
Extended Data Fig. 4. Integrated single-cell analyses for phase 2 validation cohort.
a, Workflow illustrates single-cell analyses platform for phase 2 study. Chromatin structure (ATAC) and gene expression (GEX) data from total 109,830 cells were connected at the single-cell level by the 10x Genomics scMultiome platform. Epigenetic profiling data (ChIP-seq and EM-seq) of corresponding samples are integrated. b, Summary of scMultiome clustering for 11 libraries from 4 patients. Cells were colored according to patient ID, CADM1 expression, provirus read, and assigned major tumor clusters. c, Scatter plot shows scATAC-seq promoter activity (x-axis) and scRNA-seq expression level (y-axis) for all genes in the four tumors before treatment. d, Scatter plots show Log2 fold changes of ATAC (x-axis) and GEX (y-axis) for all genes in Pre tumors vs. normal cells. Gene clusters silenced by the chromatin aggregation (P < 0.05) are indicated by dark blue. e, Heatmaps depict sorted H3K27me3 peaks centered on TSS (20-kb windows) at chromatin inactivated gene clusters in Pt5 and Pt8 before and after valemetostat treatment. f, Scatter plots show Log2 fold changes from baseline of ATAC (x-axis) and H3K27me3 (y-axis) for chromatin inactivated gene clusters at clinical response in Pt5 and Pt8. g, Scatter plots show Log2 fold changes from baseline of ATAC (x-axis) and gene expression (y-axis) for chromatin inactivated gene clusters at clinical response in Pt5 and Pt8.
Extended Data Fig. 5
Extended Data Fig. 5. Acquired EZH2 mutation in resistance to valemetostat.
a, Normalized VAF values for major somatic mutations at pre-treatment (Pre, x-axis) and recurrence (PD, y-axis) in cases with acquired PRC2 mutations (n = 5). b, Valemetostat-bound PRC2 structural models for clinically identified amino acid substitutions of EZH2 (Y111S, Y111C, Y111N, Y661N) and EED (H213R). c, Bar charts show the normalized frequency of interactions (hydrogen bonds, hydrophobic contacts, and salt-bridges) between valemetostat and wild-type or mutant PRC2 subunits over the molecular dynamics simulation time. The bar height can be greater than 100% if the protein makes more than one contact with valemetostat. d, Binding free energy changes (ΔΔG, kcal/mol) and relative affinity (%) of valemetostat to PRC2 mutants relative to wild-type PRC2 (WT) predicted by FEP+ simulation. e, H3K27me3 levels in 293 T cells expressing EZH2 and EED mutants in the presence or absence of valemetostat. Data are representative of two independent experiments. For gel source data, see Supplementary Fig. 1. f, Workflow for valemetostat outgrowth assay. g, Heatmaps represent recovered outgrowth cell numbers in TL-Om1 cells expressing PRC2 mutants in 96-well plate culture. h, Normalized EZH2 and EED RNA levels in randomly collected outgrowth clones quantified by qRT-PCR. i, Parental cells and the recovered outgrowth clones were treated with valemetostat (10 nM, 100 nM) for 7 days. Bar graphs show relative expression levels of the H3K27me3 target genes (BCL2L11 and CDKN1C). Source Data
Extended Data Fig. 6
Extended Data Fig. 6. Acquired DNMT3 overexpression in resistance to valemetostat.
a, Characteristics of clinically resistant clones based on single-cell analysis and genomic profiling. b, Chronological transition of normalized VAF values for somatic mutations in Pt2 in relation to treatment with valemetostat. c, tSNE projection for Pt2 scRNA-seq data. DNMT3A expression was upregulated in the recurrent clone (P < 10−9). d, scATAC-seq and ChIP-seq tracks at DNMT3A locus. e, Venn diagram depicts overlapped chromatin-condensed inactivated genes (Promoter sum <0.01) in Pt2 tumor cells at Pre, CR, and PD (DNMT3A expression). f, Scatter plots show all gene promoter activities in recurrent clones (y-axis) in Pt2 (left) and Pt3 (right) versus corresponding normal cells (x-axis). The gene loci with decreased copy numbers as defined from the WGS data are indicated in dark purple. g, Histogram shows differentially methylated (ΔmCpG <−10%, or >10%) probes in Pt2 resistant tumor at PD (135 weeks) versus pre-treatment tumor. h, i, Boxplots summarize normalized log2 fold changes of scATAC-seq promoter activities (h) and scRNA-seq gene expression (i) in relation to treatment-associated mCpG gain in Pt2. The genes for which integrated data were available were evaluated. Statistical significance is provided only for main combinations. j, Normalized log2 fold changes of scATAC-seq promoter activities of tumor suppressor genes (TSG) in relation to treatment-associated mCpG gain in Pt2. The genes for which integrated data were available were evaluated. Statistical significance is provided only for main combinations. k, Pt2-derived resistant cell line was successfully established. The same clonal origin and the absence of PRC2 mutations were confirmed by targeted sequencing. Bar graph shows relative RNA levels of DNMT family and PRC2 genes. l, Table summarizes characteristics of ATL cell lines. Pt2_PD cells showed low sensitivity to valemetostat. m, Knockdown and DNMT family and PRC2 genes were induced by lentivirus-mediated shRNA. After lentivirus infection, growth cell numbers for 6 days were calculated. The middle lines within box plots correspond to the medians; lower and upper hinges correspond to the first and third quartiles. The upper whisker extends from the hinge to the largest value no further than 1.5 * IQR. The lower whisker extends from the hinge to the smallest value at most 1.5 * IQR. Statistics and reproducibility are described in Methods. Source Data
Extended Data Fig. 7
Extended Data Fig. 7. DNA methylation profiling in phase 2 cohort.
a, Boxplots summarize normalized log2 fold changes of scATAC-seq promoter activities at H3K27me3 target genes (n = 630) in Pt5 and Pt7. bd, Whole genome DNA methylation profiling (28.3 M CpG sites/sample on average) detected PD-associated mCpG acquisition clusters in Pt5 (upper) and Pt7 (lower). Plots show average DNA methylation (%) in tumor baseline (Pre) and at PD centered by mCpG gain clusters (b). Heatmaps depict DNA methylation and H3K27me3 ChIP-seq peaks (20-kb windows) at PD-associated mCpG gain clusters (c). Representative tracks show H3K27me3 and methylated CpG tracks around the TSS of tumor suppressor genes (d). The middle lines within box plots correspond to the medians; lower and upper hinges correspond to the first and third quartiles. The upper whisker extends from the hinge to the largest value no further than 1.5 * IQR. The lower whisker extends from the hinge to the smallest value at most 1.5 * IQR. Statistics and reproducibility are described in Methods.
Extended Data Fig. 8
Extended Data Fig. 8. Establishment and characterization of TET2-deficient valemetostat resistant models.
a, ATL cell lines were cultured in growth media supplemented with 10 nM of valemetostat for two months. Inhibitor-resistant outgrowth was observed at 100 nM. Bar graph shows VAF values of TET2W1847X DNA and expressed mRNA in ATN-1 parental and valemetostat-resistant cells. b, shRNA targeting EZH1, EZH2, or EED were introduced by lentivirus vectors in parental and resistant cell line (ATN-1_R). Graphs show cell growth (%) relative to control shRNA. c, Growth inhibition rate (%) by valemetostat (0 ~ 10,000 nM) in ATN-1 parental and valemetostat-resistant cells. n = 3 independent experiments, mean ± SD. For gene rescue experiment, TET2 cDNA were transduced by lentivirus vector. d, Histograms show differentially methylated (ΔmCpG <−10%, or > 10%) probes in resistant ATN-1 versus parental cells. e, f, H3K27me3 occupancy was analyzed by ChIP-seq for the parental and valemetostat-resistant ATN-1 cells. Boxplot shows H3K27me3 log10 signals in relation to resistance-associated mCpG gain (e). The genes for which integrated data were available were evaluated. Statistical significance is provided only for main combinations. Representative tracks for H3K27me3 and methylated CpG tracks are shown in (f). Arrowheads indicate representative CpG sites with methylation gain. g, Log2 fold-changes of RNA-seq expression level (TPM) at mCpG gain genes (mCpG UP sites > 2) in resistant ATN-1 cells compared to parental cells. h, MSP was performed for DNA isolated from parental or resistant ATN-1 cells in the presence or absence of TET2. Amplified DNA was visualized by agarose gel electrophoresis for TSG loci with primer sets specific for methylated state (M) or unmethylated state (U). Data are representative of two independent experiments. NTC: no template control. i, Heatmaps represent recovered outgrowth cell numbers in ATN-1 cells expressing shTET2 (#1, #2) in 96-well plate culture. Collected outgrowth clones (n = 16) are indicated. j, TET2 RNA level in randomly collected outgrowth clones quantified by qRT-PCR. k, H3K27me3 level in valemetostat outgrowth clones. l, Scatter plot shows DNA methylation changes (x-axis) and accumulation of H3K27me3 (y-axis) in the promoter proximal region (TSS ± 1 kbp) of each gene in the outgrowth shTET2 clone #1. Values are averaged per gene and represented only differentially methylated genes (ΔmCpG < −5% or >5%). m, MSP assay for H3K27me3 target genes (CDKN1A and BCL2L11) in valemetostat outgrowth clones. n, Bar graphs show differentially methylated CpG sites in shTET2 outgrowth clone (left) and Pt3 PD clone (right) in single nucleotide resolution analysis using EM-seq data. Percentages were compiled from all CpG sites (filter depth > 5) in the TSS and downstream gene body regions (center ± 1 kbp). Target genes were defined based on H3K27me3, SUZ12, and H3K27ac ChIP-seq data. o, Pie chart shows the percentage of epigenomic domains of CpG islands near the TSS with increased methylation (P < 0.05). p, q, Control cells (shCtrl) and the recovered outgrowth clones were treated with valemetostat (100 nM) and DAC (10 nM). Bar graphs show relative cell growth at 14 days (p, n = 3, independent experiments, mean ± SD) and relative expression levels of the H3K27me3 target genes (CDKN1A and BCL2L11) at 7 days (q). The middle lines within box plots correspond to the medians; lower and upper hinges correspond to the first and third quartiles. The upper whisker extends from the hinge to the largest value no further than 1.5 * IQR. The lower whisker extends from the hinge to the smallest value at most 1.5 * IQR. Statistics and reproducibility are described in Methods. For gel source data, see Supplementary Fig. 1. Source Data
Extended Data Fig. 9
Extended Data Fig. 9. Establishment and characterization of DNMT3A-dependent valemetostat resistant models.
a, Relative expression levels of DNMT family genes in TL-Om1 parental and valemetostat-resistant cells quantified by qRT-PCR. b, shRNA targeting EZH1, EZH2, or EED were introduced by lentivirus vectors in parental and resistant cell line (TL-Om1_R). Graphs show cell growth (%) relative to control shRNA. c, Growth inhibition rate (%) by valemetostat (0 ~ 10,000 nM) in TL-Om1 parental and valemetostat-resistant cells. shRNA targeting DNMT3A or DNMT3B were transduced by lentivirus vector. n = 3, independent experiments, mean ± SD. d, Histograms show differentially methylated (ΔmCpG <−10%, or > 10%) probes in resistant TL-Om1 versus parental cells. e, MSP assay in TL-Om1_R with shDNMT3A. Amplified DNA was visualized by agarose gel electrophoresis for TSG loci with primer sets specific for methylated state (M) or unmethylated state (U). Data are representative of two independent experiments. f, DNMT3A (WT and E629stop which lacks enzymatic domain) and DNMT3B expressing cell models were established by lentivirus vectors in ATL-derived TL-Om1 and ATN-1 cells and DLBCL-derived WSU-DLCL2 cells. DNMT3A and DNMT3B protein levels were analyzed by immunoblotting (ATN-1). Data are representative of two independent experiments. g, Cell growth curves show recovered outgrowth cell numbers in ATN-1 cells in 96-well plate culture. h, DNMT3A RNA level in randomly collected outgrowth clones (n = 16) quantified by qRT-PCR. i, Scatter plot shows DNA methylation changes (x-axis) and accumulation of H3K27me3 (y-axis) in the promoter proximal region (TSS ± 1 kbp) of each gene in the outgrowth DNMT3A clone #1. Values are averaged per gene and represented only differentially methylated genes (ΔmCpG < −5% or >5%). j, Bar graphs show differentially methylated CpG sites in DNMT3A outgrowth clone (left) and Pt5 PD clone (right) in single nucleotide resolution analysis using EM-seq data. Percentages were compiled from all CpG sites (filter depth > 5) in the TSS and downstream gene body regions (center ± 1 kbp). Target genes were defined based on H3K27me3, SUZ12, and H3K27ac ChIP-seq data. k, Pie chart shows the percentage of epigenomic domains of CpG islands near the TSS with increased methylation (P < 0.05). l, m, Parental cells and the recovered outgrowth clones were treated with valemetostat (100 nM) and DAC (10 nM). Bar graphs show relative cell growth at 14 days (l, n = 3, independent experiments, mean ± SD) and relative expression levels of the H3K27me3 target genes (CDKN1A and BCL2L11) at 7 days (m). Statistics and reproducibility are described in Methods. For gel source data, see Supplementary Fig. 1. Source Data
Extended Data Fig. 10
Extended Data Fig. 10. Intrinsic subpopulations and translational regulation of PRC2 genes.
a, t-SNE projection of scRNA-seq data in Pt3, with cells colored according to sample ID, sub-clustering based on clinical time order or K-means, and profiles of mutations and virus reads. b, Clustered heatmaps depict expression levels of genes involved in differentially enriched categories in subclusters SC-A and SC-B in Pt3. c, Hallmark GSEA of scRNA-seq data from Pt3 SC-B before valemetostat treatment compared with SC-A. For all pathways shown, significantly enriched gene sets were evaluated by normalized enrichment score (NES) and nominal P value (P < 0.001). d, t-SNE projection of scRNA-seq data in Pt11, Pt12, and Pt13, with cells colored according to subclusters, viral reads, and expression of EIF3D and EIF3E. e, Clustered heatmaps depict expression levels of genes involved in OXPHOS and translation initiation in subclusters SC-A and SC-B in ATL patients (n = 5). f, Secondary structures of 5′UTR of PRC2 factor genes. Red circles indicate representative stem-loop structures easily recognized by eIF3. g, Reporter-based 5′UTR activity screening. A series of 5′UTR -luciferase reporters was transfected in 293 T cells with or without shEIF3D shRNA vector. Relative values of dual-luciferase assay are presented. n = 3, independent experiments, mean ± SD. *, versus Mock, P < 0.05; #, versus shCtrl, P < 0.05. h, i, CRISPR-nickase (Cas9 D10A)-based deletion of endogenous EZH2 5′UTR. Representative EZH2 5′UTR sequence of an established clone (TA-5) and gRNA regions are illustrated (h). Estimated mfold free energies (ΔG kcal/mol) of established Δ5′UTR clones are shown by bar graph (i). j, Translation activity was evaluated by polysome analysis. The amount of mRNA in the ribosomal and polysomal fractions was quantified using sucrose density gradient centrifugation. Absorbance at 254 nM of collected fractions (upper) and EZH2 mRNA level (% distribution, lower) are shown (representative data, n = 2 biological replicates). km, Effect of eIF3D knockdown (KD) in TL-Om1 cells. The qRT-PCR (k) and immunoblotting (l) showed reduced expression of PRC2 genes and H3K27me3 at the protein level. The eIF3D KD cells showed reduced growth activity (m). n = 3 independent experiments, mean ± SD, * P < 0.05. n, Violin and box plots show scRNA-seq expression distribution of eIF3D and eIF3E genes in Pt3. o, H3K27me3 staining of PBMCs in Pt3 gated on CD4+/CADM1+/CD7 tumor cell populations at 16 weeks (CR) and 118 weeks (PD) post valemetostat treatment. The middle lines within box plots correspond to the medians; lower and upper hinges correspond to the first and third quartiles. The upper whisker extends from the hinge to the largest value no further than 1.5 * IQR. The lower whisker extends from the hinge to the smallest value at most 1.5 * IQR. Statistics and reproducibility are described in Methods. For gel source data, see Supplementary Fig. 1. Source Data

References

    1. Margueron R, Reinberg D. The Polycomb complex PRC2 and its mark in life. Nature. 2011;469:343–349. doi: 10.1038/nature09784. - DOI - PMC - PubMed
    1. Yamagishi M, Uchimaru K. Targeting EZH2 in cancer therapy. Curr. Opin. Oncol. 2017;29:375–381. doi: 10.1097/CCO.0000000000000390. - DOI - PubMed
    1. Bhat KP, Kaniskan HU, Jin J, Gozani O. Epigenetics and beyond: targeting writers of protein lysine methylation to treat disease. Nat. Rev. Drug Discov. 2021;20:265–286. doi: 10.1038/s41573-020-00108-x. - DOI - PMC - PubMed
    1. Morschhauser F, et al. Tazemetostat for patients with relapsed or refractory follicular lymphoma: an open-label, single-arm, multicentre, phase 2 trial. Lancet Oncol. 2020;21:1433–1442. doi: 10.1016/S1470-2045(20)30441-1. - DOI - PMC - PubMed
    1. Gounder M, et al. Tazemetostat in advanced epithelioid sarcoma with loss of INI1/SMARCB1: an international, open-label, phase 2 basket study. Lancet Oncol. 2020;21:1423–1432. doi: 10.1016/S1470-2045(20)30451-4. - DOI - PubMed

MeSH terms