. 2024 Mar;16(3):616-640.
doi: 10.1038/s44321-023-00019-5. Epub 2024 Feb 21.

Targeting PI3K/Akt/mTOR signaling in rodent models of PMP22 gene-dosage diseases

Affiliations

Targeting PI3K/Akt/mTOR signaling in rodent models of PMP22 gene-dosage diseases

Doris Krauter et al. EMBO Mol Med. 2024 Mar.

Abstract

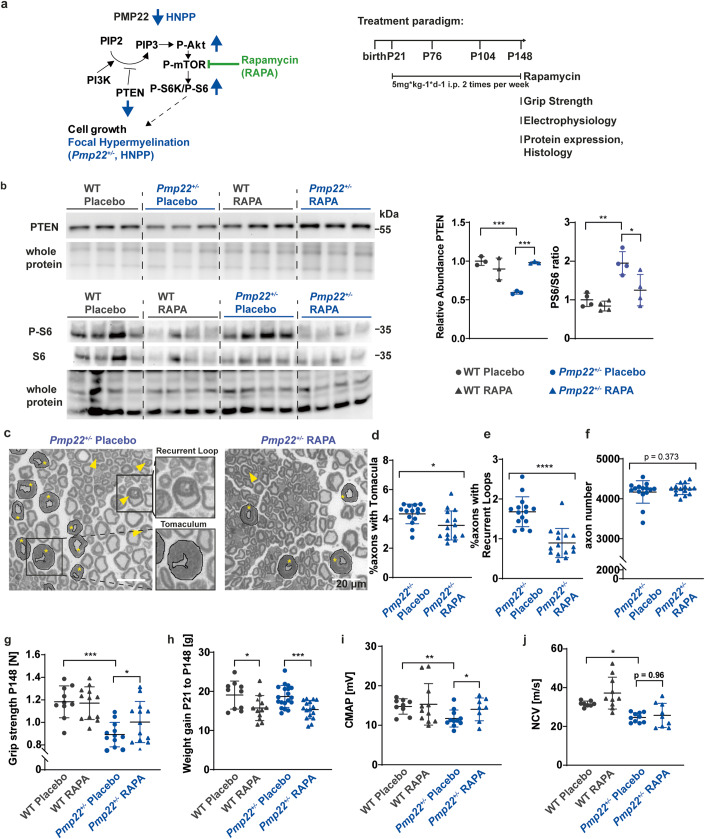
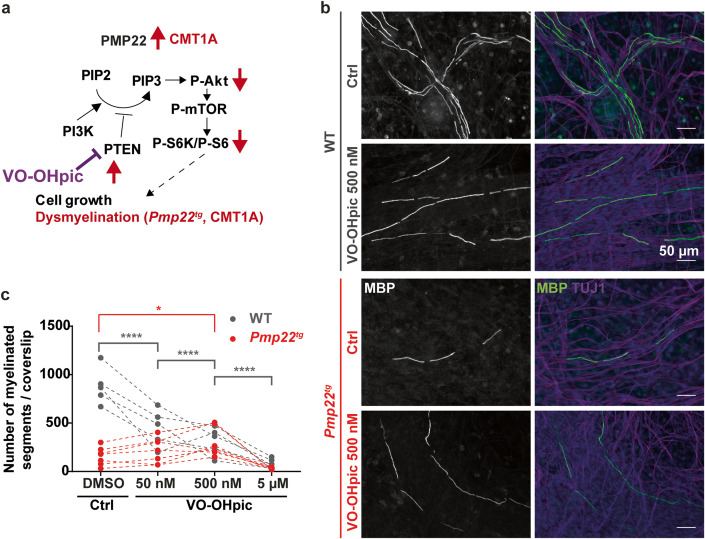
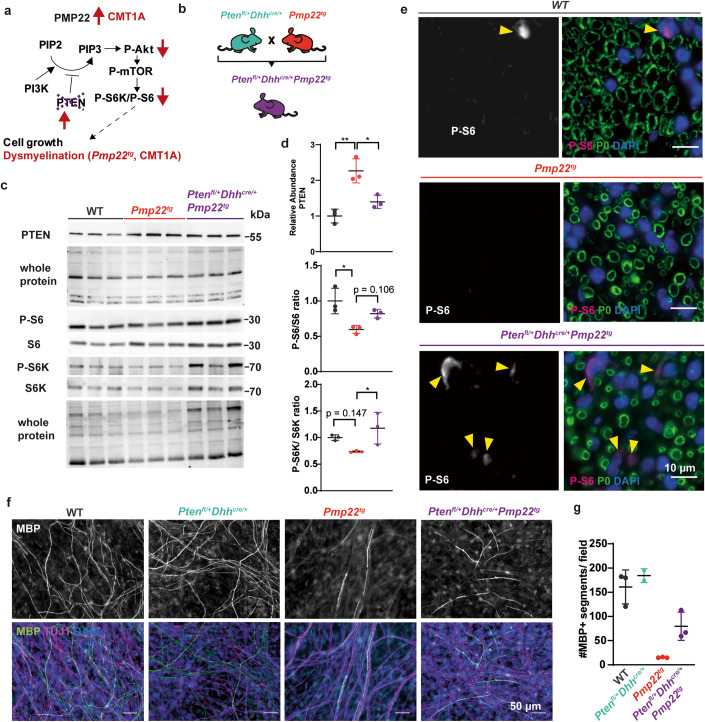
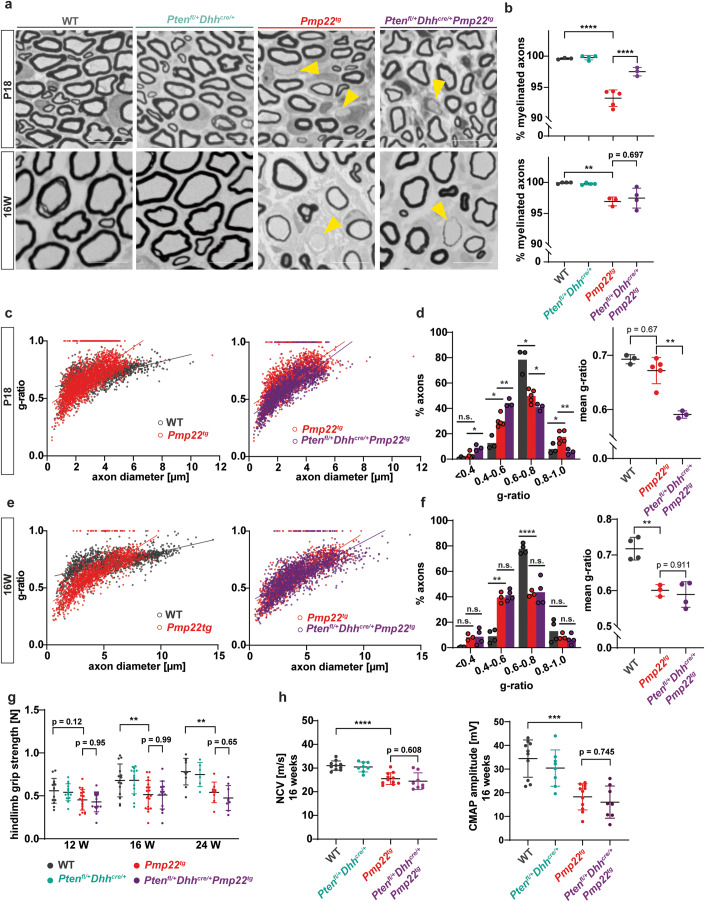
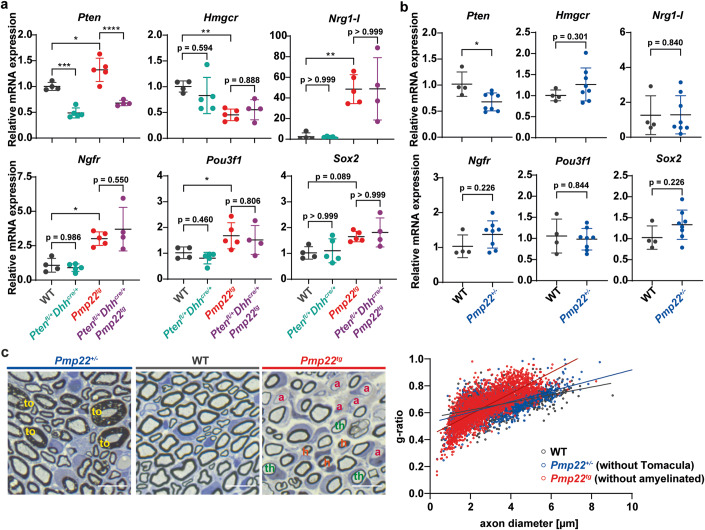
Haplo-insufficiency of the gene encoding the myelin protein PMP22 leads to focal myelin overgrowth in the peripheral nervous system and hereditary neuropathy with liability to pressure palsies (HNPP). Conversely, duplication of PMP22 causes Charcot-Marie-Tooth disease type 1A (CMT1A), characterized by hypomyelination of medium to large caliber axons. The molecular mechanisms of abnormal myelin growth regulation by PMP22 have remained obscure. Here, we show in rodent models of HNPP and CMT1A that the PI3K/Akt/mTOR-pathway inhibiting phosphatase PTEN is correlated in abundance with PMP22 in peripheral nerves, without evidence for direct protein interactions. Indeed, treating DRG neuron/Schwann cell co-cultures from HNPP mice with PI3K/Akt/mTOR pathway inhibitors reduced focal hypermyelination. When we treated HNPP mice in vivo with the mTOR inhibitor Rapamycin, motor functions were improved, compound muscle amplitudes were increased and pathological tomacula in sciatic nerves were reduced. In contrast, we found Schwann cell dedifferentiation in CMT1A uncoupled from PI3K/Akt/mTOR, leaving partial PTEN ablation insufficient for disease amelioration. For HNPP, the development of PI3K/Akt/mTOR pathway inhibitors may be considered as the first treatment option for pressure palsies.

Keywords: Charcot–Marie–Tooth Neuropathies; Myelin; PI3K/Akt/mTOR Signaling; Peripheral Myelin Protein of 22 kDa; Schwann Cell.


Conflict of interest statement

The authors declare no competing interests.

Figures

Figure 1
Figure 1. PTEN is Pmp22 gene-dosage dependently altered in animal models of HNPP and CMT1A.
(A) Western Blot analysis (left panel) showing PTEN and PMP22 protein levels in sciatic nerve lysates of Pmp22+/- mice at postnatal day 6 (P6), postnatal day 18 (P18) and 9 weeks of age compared to wildtype (WT) control (n = 2 per time point and group). Fast green whole protein staining was used as loading control for the quantification (right panel). (B) Western Blot analysis (left panel) showing a decrease of PTEN protein levels in sciatic nerve lysates of Pmp22+/- mice (n = 3) at postnatal day 6 and an increase in S6 phosphorylation compared to wildtype (WT) control (n = 4). Whole protein staining was used as loading control for the quantification (right panel). (C) Western Blot analysis (left panel) of PTEN and PMP22 protein levels in sciatic nerve lysates at P6, P18 and 9 weeks of age in Pmp22tg rats compared to WT control. Whole protein staining served as loading control for the quantification (right panel). (D) Western Blot analysis (left panel) showing an increase of PTEN protein levels in sciatic nerve lysates of Pmp22tg rats at postnatal day 6 and a decrease in S6K phosphorylation compared to wildtype (WT) control (n = 4). Whole protein staining was used as loading control for the quantification (right panel). (E) Quantitative RT-PCR analysis in tibial nerves from n = 4 WT and n = 7 PMP22+/- mice shows decreased mRNA levels of Pmp22 and Pten in Pmp22+/- mice at P18. Rplp0 and Ppia served as housekeeping genes. (F) Quantitative RT-PCR analysis in tibial nerves from n = 5 WT and n = 5 PMP22tg rats shows increased mRNA levels of Pmp22 and Pten in Pmp22tg rats at P18. Rplp0 and Ppia served as housekeeping genes. (G) Immunoblot of WT P18 rat whole sciatic nerve lysate and purified myelin. PTEN and TUJ1 are enriched in the lysate while PMP22 and P0 are enriched in the myelin fraction. (H) Femoral nerve cross section of 9-week-old WT rats shows PTEN (green) localization to the axon (magenta, TUJ1), nuclei (blue DAPI) and bands of Cajal (indicated by arrows). Scale bar is 5 µm. (I) Graphical overview of Pmp22 gene-dosage dependent alterations in the PI3K/Akt/mTOR signaling pathway in animal models of CMT1A and HNPP. PMP22 overexpression leads to increased PTEN protein levels, reduced activation of the downstream PI3K/Akt/mTOR growth signaling pathway and subsequently demyelination (red). In contrast, PMP22 heterozygosity results in decreased PTEN levels, increased activation of the PI3K/Akt/mTOR signaling cascade and hypermyelination (blue). Data information: Mean numbers are displayed ±standard deviation. Statistical analysis was performed using Student’s t test, *p < 0.05,**p < 0.01, ***p < 0.001. Source data are available online for this figure.
Figure 2
Figure 2. Inhibition of the PI3K/Akt/mTOR signaling pathway reduces myelin outfoldings in Pmp22+/- co-cultures.
(A) PI3K inhibitor LY294002 and mTOR inhibitor Rapamycin were used to counteract the upregulated PI3K/Akt/mTOR signaling pathway in Pmp22+/- mice. (B) Example images displaying Schwann cell-dorsal root ganglia neuron co-cultures from wildtype (WT) and Pmp22+/- (HNPP) mice 14 days after induction of myelination. Cells were treated with either DMSO as controls, 10 µM LY294002 or 20 nM Rapamycin. Fixed cells were stained for myelin basic protein (MBP, gray/green) to visualize myelin and beta tubulin III (TUJ1, magenta) for axons. Cell nuclei are stained by DAPI in blue. Yellow arrowheads indicate myelin outfoldings. Scale bar is 50 μm (overview) and 10 μm (blow-up). (C) Quantification of (B) reveals an increased proportion of myelinated segments with outfoldings in Pmp22+/- control co-cultures (circles) and a reduction after inhibition of PI3K (squares) or mTOR (triangles). n = 3–7 animals with n = 5 fields of view (500 × 500 µm) were quantified. (D) The mean number of myelinated segments is unaltered in control and treated Pmp22+/- co-cultures. n = 3–7 animals with n = 5 fields of view (500 × 500 µm) were quantified. Data information: Mean numbers are displayed ±standard deviation. Groups were compared using one-way ANOVA with Sidak’s multiple comparison test (****p ≤ 0.0001). Source data are available online for this figure.
Figure 3
Figure 3. Rapamycin treatment in Pmp22+/- mice ameliorates the disease phenotype.
(A) Pmp22+/- and wildtype (WT) control mice were injected i.p. with placebo solution or 5 mg Rapamycin per kg bodyweight two times per week from P21 until P148 to reduce mTOR activity. Grip strength analysis, electrophysiology, protein expression analysis and histology were performed at P148. (B) Western Blot analysis of PTEN protein (n = 3 animals per group) and phosphorylated and total S6 (n = 4 animals per group) (left panel) in whole sciatic nerve lysates. Quantification using whole protein staining as loading control shows increased PTEN protein levels and decreased S6 phosphorylation after Rapamycin treatment in Pmp22+/- mice (right panel). (C) Sciatic nerve semi-thin sections of Pmp22+/- placebo and Rapamycin treated mice. Tomacula are encircled in black and marked with asterisks. Yellow arrowheads point to recurrent loops. Scale bar is 20 µm. (D) The percentage of axons showing tomacula is decreased in whole sciatic nerves of Rapamycin treated Pmp22+/- mice (triangle) compared to placebo controls (circles) at P148, n = 15 animals per group. (E) The percentage of axons showing recurrent loops is decreased in whole sciatic nerves of Rapamycin treated Pmp22+/- mice (triangle) compared to placebo controls (circles) at P148, n = 15 animals per group. (F) Total axon number in sciatic nerves is unaltered between Rapamycin treated Pmp22+/- mice (triangle) and placebo controls (circles) at P148, n = 15 animals per group. (G) Forelimb grip strength is decreased in Pmp22+/- placebo mice (n = 12, blue circles) compared to WT placebo mice (n = 10, gray circles), whereas Rapamycin treatment improves strength in Pmp22+/- mice (n = 13, blue triangles) and does not affect WT mice (n = 12, gray triangles) at P148. (H) Rapamycin-treated Pmp22+/- and WT animals (triangles) gained less weight than placebo controls (circles). Groups of n = 10 WT placebo, n = 12 WT Rapamycin, n = 19 Pmp22+/- placebo and n = 16 Pmp22+/- Rapamycin. (I) Electrophysiological analysis shows reduced compound muscle action potential amplitudes (CMAP) in Pmp22+/- placebo mice and increased CMAP after Rapamycin treatment. n = 8 WT placebo, n = 10 WT Rapamycin, n = 10 Pmp22+/- placebo and n = 8 Pmp22+/- Rapamycin. (J) Electrophysiological analysis shows reduced nerve conduction velocities (NCV) in Pmp22+/- placebo mice and no alterations after Rapamycin treatment. n = 8 WT placebo, n = 10 WT Rapamycin, n = 10 Pmp22+/- placebo and n = 8 Pmp22+/- Rapamycin. Data information: Mean numbers are displayed ±standard deviation. Statistical analysis was performed using Student’s t test (DF) and one-way ANOVA with Sidak’s multiple comparison test (B, GJ; *p ≤ 0.05 **p ≤ 0.01, ***p ≤ 0.001, ****p ≤ 0.0001). Source data are available online for this figure.
Figure 4
Figure 4. Inhibition of PTEN improves myelination in Pmp22tg co-cultures in vitro.
(A) PTEN inhibitor VO-OHpic was used to disinhibit the PI3K/Akt/mTOR signaling pathway in CMT1A. (B) Example images of Schwann cell-dorsal root ganglia neuron co-cultures from wildtype (WT) and Pmp22tg rats treated with DMSO as control (Ctrl) or PTEN inhibitor VO-OHpic (500 nM). Cells were stained for myelin basic protein (MBP) as a marker for myelinated segments (gray/ green) and TUJ1 for neurons (magenta) as well as DAPI for cell nuclei (blue). (C) Quantification of (B) shows a dose-dependent decrease of myelinated segments in WT co-cultures treated with DMSO and different concentrations of VO-OHpic (50 nM, 500 nM, 5 µM) and an increase of myelinated segments in Pmp22tg co-cultures with 500 nM VO-OHpic (WT n = 5, CMT1A n = 7 animals). Groups were compared using two-way ANOVA with Sidak’s multiple comparison test (*p ≤ 0.05, ****p ≤ 0.0001). Source data are available online for this figure.
Figure 5
Figure 5. Genetic depletion of PTEN ameliorates mTOR activity in Pmp22tg nerves and increases myelination in vitro.
(A) Rationale to breed Schwann cell specific heterozygous Pten knockout mice (Ptenfl/+Dhhcre/+) with CMT1A mice (Pmp22tg) to lower Pten expression in CMT1A mice (Ptenfl/+Dhhcre/+Pmp22tg). (B) In order to reduce Pten genetically in Schwann cells, heterozygous Pten floxed mice under the Dhhcre driver (Ptenfl/+Dhhcre/+) were crossbred with Pmp22tg mice. (C) Western Blot analysis of sciatic nerve lysate from WT, PMP22tg and Ptenfl/+Dhhcre/+Pmp22tg at postnatal day 18 against PTEN, P-S6, S6, P-S6K and S6K with whole protein staining as the loading control. (D) Quantification of (C) reveals increased PTEN protein levels in PMP22tg sciatic nerve lysates compared to WT controls as well as decreased PTEN protein levels in Ptenfl/+Dhhcre/+Pmp22tg sciatic nerve lysates compared to Pmp22tg mice (upper panel) and downregulation of P-S6 (middle panel) activation in PMP22tg mice compared to WT mice, while P-S6K (lower panel) activation is increased in Ptenfl/+Dhhcre/+Pmp22tg mice as compared to PMP22tg mice. Groups were compared using one-way ANOVA with Sidak’s multiple comparison test (*p ≤ 0.05, **p ≤ 0.01). (E) Paraffin cross sections of femoral nerves from 18 days old WT, Pmp22tg and Ptenfl/+Dhhcre/+Pmp22tg mice show an increased signal for Phospho-S6 in double mutants (magenta, indicated by yellow arrowheads). Myelin is visualized by P0 (green) and nuclei by DAPI (blue). Scale bar is 10 µm. (F) Representative example images of Schwann cell dorsal root ganglia neuron co-cultures 14 days after induction of myelination. Myelin basic protein (MBP) indicates myelinated segments (gray/green), TUJ1 neurons (magenta) and DAPI nuclei (blue). Scale bar is 50 µm. (G) Quantification of (F) shows increased numbers of myelinated segments in Ptenfl/+Dhhcre/+Pmp22tg compared to Ptenfl/+Dhhcre/+ co-cultures. Shown are means of 5 fields of view (500 × 500 µm) for each animal (n = 2–3) ±standard deviation. Source data are available online for this figure.
Figure 6
Figure 6. Reduction of PTEN in Pmp22tg mice increases myelin growth early in development.
(A) Example images of femoral nerve semi-thin sections from wildtype (WT), Ptenfl/+Dhhcre/+, Pmp22tg and Ptenfl/+Dhhcre/+Pmp22tg mice at P18 (upper panels) and 16 weeks of age (lower panels). Yellow arrowheads indicate amyelinated axons. Scale bar = 10 µm. (B) Quantification of (a) displays a decreased amount of myelinated axons in Pmp22tg whole femoral nerves and an increase in Ptenfl/+Dhhcre/+Pmp22tg double mutants (upper panel) at P18 while numbers of myelinated axons are similarly decreased in Pmp22tg and Ptenfl/+Dhhcre/+Pmp22tg mice at 16 weeks of age (lower panel). WT n = 3–4, Ptenfl/+Dhhcre/+ n = 3–4, Pmp22tg n = 3–5 and Ptenfl/+Dhhcre/+Pmp22tg n = 3–4 animals. (C) G-ratio plotted against axon diameter of WT (gray) and Pmp22tg (red) mice (left panel) and Pmp22tg and Ptenfl/+Dhhcre/+Pmp22tg (purple) mice (right panel) at P18. WT n = 3, Pmp22tg n = 5 and Ptenfl/+Dhhcre/+Pmp22tg n = 3 animals. (D) Distribution of g-ratios shown in the left panel displays Ptenfl/+Dhhcre/+Pmp22tg femoral nerves have more axons with low g-ratios (0.4–0.5) and less axons with higher g-ratios (0.8–0.9, 0.9–1.0) compared to Pmp22tg nerves. Mean g-ratio (right panel) showed a trend to be decreased in Pmp22tg femoral nerves compared to WT and were significantly decreased in Ptenfl/+Dhhcre/+Pmp22tg femoral nerves. WT n = 3, Pmp22tg n = 5 and Ptenfl/+Dhhcre/+Pmp22tg n = 3 animals. Groups were compared using two-way ANOVA with Tukey’s multiple comparison test (*p ≤ 0.05, **p ≤ 0.01, ****p ≤ 0.0001). (E) G-ratio plotted against axon diameter of WT (gray) and Pmp22tg (red) mice (left panel) and Pmp22tg and Ptenfl/+Dhhcre/+Pmp22tg (purple) mice (right panel) at 16 weeks of age. WT n = 4, Pmp22tg n = 3 and Ptenfl/+Dhhcre/+Pmp22tg n = 4 animals. (F) No alteration in the distribution of axons over the g-ratio (left panel) as well as mean g-ratio (right panel) is observed comparing femoral nerves from Pmp22tg and Ptenfl/+Dhhcre/+Pmp22tg mice. WT n = 4, Pmp22tg n = 3 and Ptenfl/+Dhhcre/+Pmp22tg n = 4 animals. Groups were compared using two-way ANOVA with Tukey’s multiple comparison test (*p ≤ 0.05, **p ≤ 0.01, ****p ≤ 0.0001). (G) The grip strength of hindlimbs is reduced in Pmp22tg and Ptenfl/+Dhhcre/+Pmp22tg mice compared to WT controls and Ptenfl/+Dhhcre/+ mice. Behavioral analysis was done at 12, 16 and 24 weeks of age. WT n = 10–14, Ptenfl/+Dhhcre/+ n = 6–14, Pmp22tg n = 9–19 and Ptenfl/+Dhhcre/+Pmp22tg n = 9–14 mice were analyzed. (H) Nerve conduction velocity (NCV, left panel) and compound muscle action potential amplitudes (CMAP, right panel) are similarly lower in Pmp22tg and Ptenfl/+Dhhcre/+Pmp22tg mice compared to WT controls. For electrophysiology measurements WT n = 10, Ptenfl/+Dhhcre/+ n = 8, Pmp22tg n = 11 and Ptenfl/+Dhhcre/+Pmp22tg n = 8 mice were analyzed. Data information: Means are displayed ±standard deviation. Statistical analysis was performed using one-way ANOVA with Sidak’s multiple comparison test (*p ≤ 0.05, **p ≤ 0.01, ***p ≤ 0.001, ****p ≤ 0.0001) if not indicated otherwise. Source data are available online for this figure.
Figure 7
Figure 7. Dedifferentiation in CMT1A mice is not rescued by PTEN reduction.
(A) Quantitative RT-PCR from P18 tibial nerves of wildtype (WT) (n = 4), Ptenfl/+Dhhcre/+ (n = 5), Pmp22tg (n = 5) and Ptenfl/+Dhhcre/+Pmp22tg (n = 5) mice shows relative mRNA expression of Pten, Hmgcr, Nrg1-I, Pou3f1, Ngfr, and Sox2. Rplp0 and Ppia were used as housekeeping genes. (B) Quantitative RT-PCR from P18 tibial nerves of WT (n = 4) and Pmp22+/- (n = 8) mice shows relative mRNA expression of Pten, Hmgcr, Nrg1-I, Pou3f1, Ngfr, and Sox2. Rplp0 and Ppia were used as housekeeping genes. (C) Semi-thin sections of P18 femoral nerves of Pmp22+/- (left), WT (middle) and Pmp22tg (right) mice. Pmp22+/- nerves show myelin overgrowth, the so-called tomacula (to, yellow) and Pmp22tg nerves are characterized by amyelinated (a, pink) and thinly myelinated (th, green) big axons as well as hypermyelinated (h, orange) small axons. Quantification shows g-ratios of Pmp22+/- mice (blue, without tomacula) are similar to the WT (gray) distribution, while Pmp22tg mice (red, without amyelinated) show the hypermyelination of small axons and demyelination of big axons. Data information: Means are displayed ±standard deviation. Statistical analysis was performed using one-way ANOVA with Sidak’s multiple comparison test (*p ≤ 0.05, **p ≤ 0.01, ***p ≤ 0.001, ****p ≤ 0.0001). Source data are available online for this figure.
Figure EV1
Figure EV1. PMP22 gene dosage dependent alteration of PTEN abundance in PMP22+/- HNPP mice and PMP22tg CMT1A rat sciatic nerve lysates.
(A) Western Blot analysis showing a decrease of PTEN protein levels in sciatic nerve lysates of Pmp22+/- mice at 9 weeks (n = 4, left panel) and at postnatal day 21 (n = 4, right panel) compared to wildtype (WT) control. Fast green whole protein staining was used as loading control for the quantification. (B) Western Blot analysis showing a decrease of PTEN protein levels in sciatic nerve lysates of Pmp22tg rats at 9 weeks (n = 4, left panel) and at postnatal day 18 (n = 3, right panel) compared to wildtype (WT) control. Whole protein staining was used as loading control for the quantification. (C) Sciatic nerve semi-thin sections of WT (n = 3) and Pmp22+/- mice (n = 3) at postnatal day 6; myelin aberrations are highlighted with yellow arrowheads (left panel). Quantification shows increased percentage of axons with myelin aberrations in sciatic nerves from PMP22+/- mice (left panel). Scale bar is 50 µm. (D) Quadriceps motor nerve semi-thin sections of WT (n = 3) and Pmp22+/- mice (n = 3) at postnatal day 18; myelin aberrations are highlighted with yellow arrowheads (left panel). Quantification shows increased percentage of axons with myelin aberrations in sciatic nerves from PMP22+/- mice (left panel). Scale bar is 25 µm. Data information: Means are displayed ± standard deviation. Statistical analysis was performed using Student’s t test (*p < 0.05, **p < 0.01).
Figure EV2
Figure EV2. No evidence for molecular interaction between PMP22 and PTEN in peripheral nerve or in cell culture.
(A) Immunoprecipitation of PMP22 from rat sciatic nerve (P18). Western Blot (WB) analysis shows unspecific binding of PTEN, while PMP22 was specifically detected in PMP22 immunoprecipitation eluate (IP) and not in control eluate (ctrl IP). Input nerve homogenate (I) was diluted 50× for WB analysis. (B) Immunoprecipitation from HEK293T cells after transfection of PMP22-ALFA. WB analysis shows endogenous PTEN in the cell lysate (I) and in the supernatant after the binding step (unbound (Ub)), but not in the immunoprecipitation eluate. I and Ub were diluted 10× for WB analysis. (C) Immunoprecipitation from HEK293T cells after co-transfection of PMP22-ALFA with FLAG-PTEN or untagged PTEN. WB analysis shows specific immunoprecipitation of FLAG-PTEN but not of PMP22-ALFA or untagged PTEN. (D) Pull-down assay on rat sciatic nerve (P18) using purified PMP22-ALFA as prey. WB analysis shows PTEN in the nerve lysate (I) but not in the PMP22-ALFA eluate (PMP22-ALFA) or control eluate (ctrl) in both WT and CMT1A, while P0 was pulled down by PMP22-ALFA. I was diluted 3.33× for WB analysis.
Figure EV3
Figure EV3. Dose-dependent response of myelination upon PTEN inhibition in Pmp22tg co-cultures in vitro.
Example images of SC-DRG co-cultures from wildtype (WT) and Pmp22tg rats, treated with different dosages of the PTEN inhibitor VO-OHpic for 14 days. The number of myelinated segments (MBP; gray/green) decreases in WT cultures with increasing inhibitor dosage. In Pmp22tg co-cultures an increase is observed up to 500 nM VO-OHpic but a decrease with 5 µM VO-OHpic. Scale bar is 50 µm. Images for 500 nM VO-OHpic treatment are the same as used in Fig. 4B.
Figure EV4
Figure EV4. Unaltered internodal length and myelin sheath thickness in Ptenfl/+Dhhcre/+ mice.
(A) Western Blot analysis shows PTEN and PMP22 protein amounts in whole sciatic nerve lysates from 16 weeks old WT, PTEN heterozygous knockout (Ptenfl/+Dhhcre/+), CMT1A (Pmp22tg) and double mutant (Ptenfl/+Dhhcre/+Pmp22tg) mice using whole protein staining as loading control. (B) G-ratio plotted against axon diameter of wildtype (WT, gray) and Ptenfl/+Dhhcre/+ (turquoise) femoral nerves at P18. Mean g-ratio is unaltered in Ptenfl/+Dhhcre/+ and Pmp22tg mice compared to WT controls and decreased in Ptenfl/+Dhhcre/+Pmp22tg mice (left panel). Mean axon diameters are reduced in Pmp22tg and Ptenfl/+Dhhcre/+Pmp22tg mice (middle panel). The number of Schwann cell nuclei per femoral nerve cross section is increased in Pmp22tg and Ptenfl/+Dhhcre/+Pmp22tg mice. WT n = 3, Ptenfl/+Dhhcre/+ n = 4, Pmp22tg n = 5 and Ptenfl/+Dhhcre/+Pmp22tg n = 3 animals. (C) G-ratio plotted against axon diameter of WT (gray) and Ptenfl/+Dhhcre/+ (turquoise) femoral nerves at 16 weeks of age. Mean g-ratio is unaltered in Ptenfl/+Dhhcre/+ mice compared to WT controls and decreased in Pmp22tg and Ptenfl/+Dhhcre/+Pmp22tg mice (left panel). Mean axon diameters are reduced in Pmp22tg and Ptenfl/+Dhhcre/+Pmp22tg mice (middle panel). The number of Schwann cell nuclei per femoral nerve cross section is increased in Pmp22tg and Ptenfl/+Dhhcre/+Pmp22tg mice. WT n = 4, Ptenfl/+Dhhcre/+ n = 4, Pmp22tg n = 3 and Ptenfl/+Dhhcre/+Pmp22tg n = 4 animals. (D) The number of slips on the elevated beam is similarly increased in Pmp22tg and Ptenfl/+Dhhcre/+Pmp22tg mice compared to wildtype controls at all time points. Behavioral analysis was done at 12, 16 and 24 weeks of age. WT n = 10–14, Ptenfl/+Dhhcre/+ n = 6–14, Pmp22tg n = 9–19 and Ptenfl/+Dhhcre/+Pmp22tg n = 9–14 mice were analyzed. (E) Neither the weight of Pmp22tg nor Ptenfl/+Dhhcre/+Pmp22tg mice is altered compared to wildtype controls at 12, 16 and 24 weeks of age. WT n = 10–14, Ptenfl/+Dhhcre/+ n = 6–14, Pmp22tg n = 9–19 and Ptenfl/+Dhhcre/+Pmp22tg n = 9-14 mice were analyzed. (F) Sensory nerve action potential amplitudes (SNAP) are decreased in the tail of Pmp22tg and Ptenfl/+Dhhcre/+Pmp22tg mice compared to wildtype controls. For electrophysiology measurements WT n = 10, Ptenfl/+Dhhcre/+ n = 8, Pmp22tg n = 11 and Ptenfl/+Dhhcre/+Pmp22tg n = 8 mice were analyzed. (G) Example images of teased fiber preparations of WT, Ptenfl/+Dhhcre/+, Pmp22tg and Ptenfl/+Dhhcre/+Pmp22tg double mutants stained for MAG (green), NaV1.6 (magenta) and DAPI (blue) at P18. Internodes between two nodes (magenta arrowheads) are underlined in yellow and respective Schwann cell nuclei are marked by white stars. Mean internodal length (left panel) is significantly reduced in Pmp22tg teased fibers compared to wildtype controls at P18, whereas Ptenfl/+Dhhcre/+Pmp22tg mice do not differ in internodal length compared to Pmp22tg mice. Mean fiber diameters are not significantly altered (right panel). Analysis was performed on 100 internodes of n = 3–4 animals per group. (H) Example images of teased fiber preparations of WT, Ptenfl/+Dhhcre/+, Pmp22tg and Ptenfl/+Dhhcre/+Pmp22tg double mutants stained for MAG (green), NaV1.6 (magenta) and DAPI (blue) at 16 weeks of age. Internodes between two nodes (magenta arrowheads) are underlined in yellow and respective Schwann cell nuclei are marked by white stars. Mean internodal length (left panel) and fiber diameter (right panel) are significantly reduced in Pmp22tg teased fibers compared to wildtype controls at 16 weeks of age, whereas Ptenfl/+Dhhcre/+Pmp22tg mice do not differ in internodal length compared to Pmp22tg mice. Analysis was performed on 100 internodes of n = 3–4 animals per group. Data information: Means are displayed ± standard deviation. Statistical analysis was done using one-way ANOVA with Sidak’s multiple comparison test (*p ≤ 0.05, **p ≤ 0.01, ***p ≤ 0.001, ****p ≤ 0.0001).
Figure EV5
Figure EV5. Pten ablation in Pmp22tg mice leads to myelin abnormalities.
(A) Crossing scheme of Schwann cell specific full Pten knockout mice (Ptenfl/flDhhcre/+) with CMT1A mice (Pmp22tg) to generate a full Pten knockout in CMT1A mice (Ptenfl/flDhhcre/+Pmp22tg). (B) Teased fiber preparations of 8 weeks old PTENfl/flDhhcre/+ (upper panel) and Ptenfl/flDhhcre/+Pmp22tg mice (lower panel) show focal myelin thickening at paranodal loops as indicated by yellow arrows. Scale bar = 20 µm. (C) Semi-thin cross section of femoral nerves from WT, Ptenfl/flDhhcre/+, Pmp22tg and Ptenfl/flDhhcre/+Pmp22tg mice at 8 weeks of age. Red arrows indicate myelin abnormalities such as outfoldings and tomacula, asterisks indicate amyelinated axons. Scale bar = 10 µm. (DF) Quantification of (C) displays reduced axon numbers in Ptenfl/flDhhcre/+Pmp22tg mice compared to wildtype controls (D). The percentage of amyelinated axons is increased in Pmp22tg and further elevated in Ptenfl/flDhhcre/+Pmp22tg mice (E). Pten depletion alone and in Pmp22tg leads to an increase in axons with aberrant myelin profiles (F). WT n = 5, PTENfl/flDhhcre/+ n = 4, Pmp22tg n = 6 and Ptenfl/flDhhcre/+Pmp22tg n = 3 animals were analyzed. Data information: Means are displayed ± standard deviation. Statistical analysis was done using one-way ANOVA with Sidak’s multiple comparison test (*p ≤ 0.05, **p ≤ 0.01, ***p ≤ 0.001).

References

    1. Adlkofer K, Frei R, Neuberg DH, Zielasek J, Toyka KV, Suter U. Heterozygous peripheral myelin protein 22-deficient mice are affected by a progressive demyelinating tomaculous neuropathy. J Neurosci. 1997;17:4662–4671. - PMC - PubMed
    1. Adlkofer K, Martini R, Aguzzi A, Zielasek J, Toyka KV, Suter U. Hypermyelination and demyelinating peripheral neuropathy in Pmp22-deficient mice. Nat Genet. 1995;11:274–280. - PubMed
    1. Archelos JJ, Roggenbuck K, Schneider-Schaulies J, Linington C, Toyka KV, Hartung HP. Production and characterization of monoclonal antibodies to the extracellular domain of P0. J Neurosci Res. 1993;35:46–53. - PubMed
    1. Attarian S, Fatehi F, Rajabally YA, Pareyson D. Hereditary neuropathy with liability to pressure palsies. J Neurol. 2020;267:2198–2206. - PubMed
    1. Azzedine H, Bolino A, Taieb T, Birouk N, Di Duca M, Bouhouche A, Benamou S, Mrabet A, Hammadouche T, Chkili T, et al. Mutations in MTMR13, a new pseudophosphatase homologue of MTMR2 and Sbf1, in two families with an autosomal recessive demyelinating form of Charcot-Marie-Tooth disease associated with early-onset glaucoma. Am J Hum Genet. 2003;72:1141–1153. - PMC - PubMed

MeSH terms

Substances

Supplementary concepts