. 2024 Mar;4(3):379-395.
doi: 10.1038/s43587-024-00573-8. Epub 2024 Feb 21.

Leveraging electronic health records and knowledge networks for Alzheimer's disease prediction and sex-specific biological insights

Affiliations

Leveraging electronic health records and knowledge networks for Alzheimer's disease prediction and sex-specific biological insights

Alice S Tang et al. Nat Aging. 2024 Mar.

Abstract

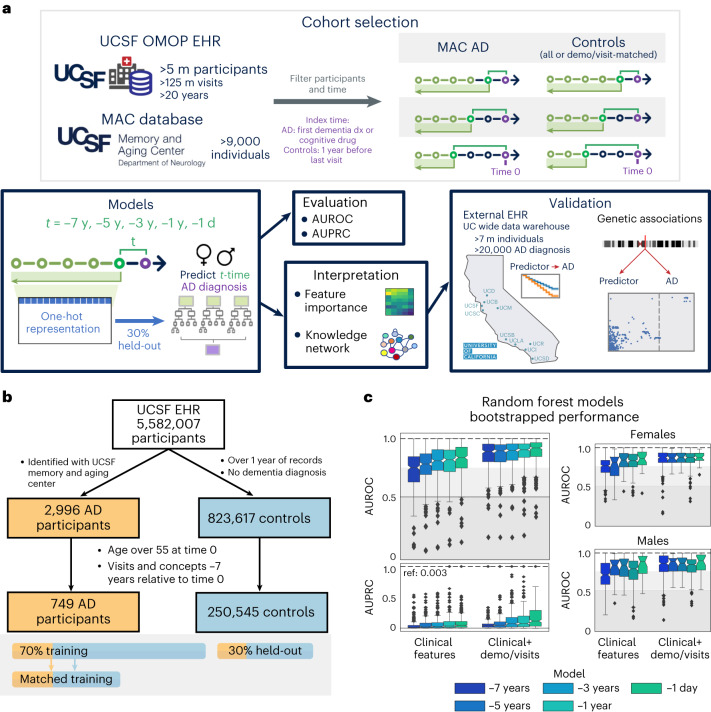
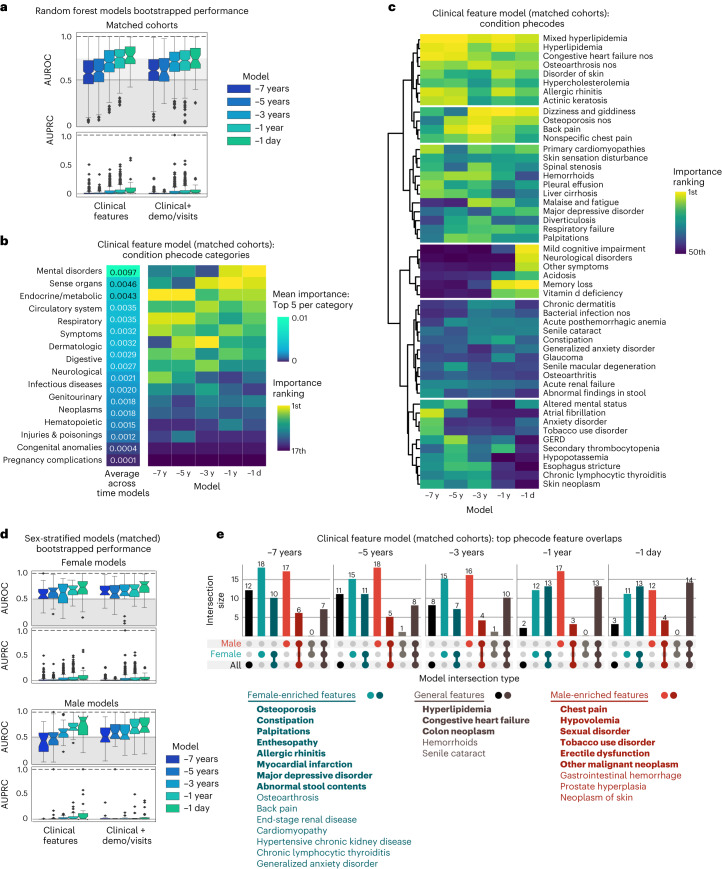
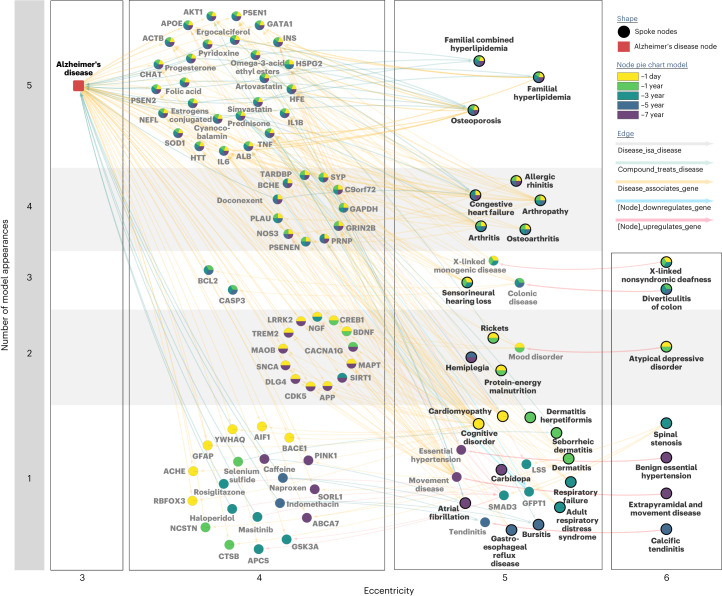
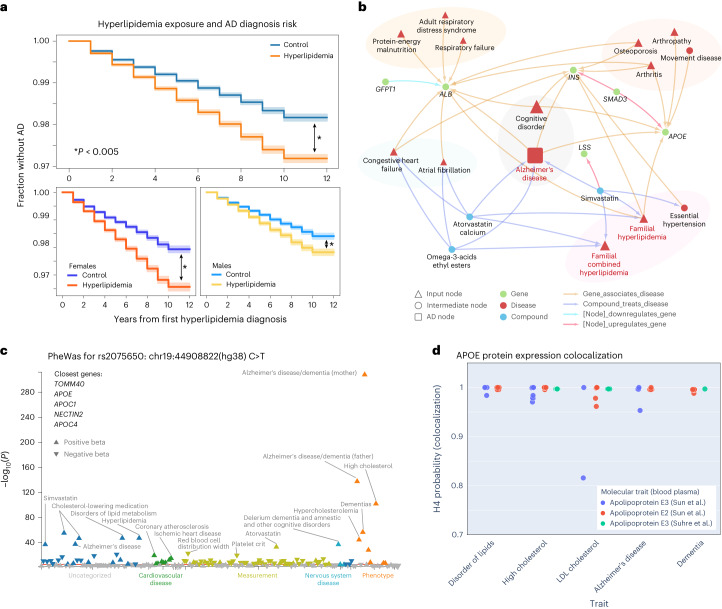
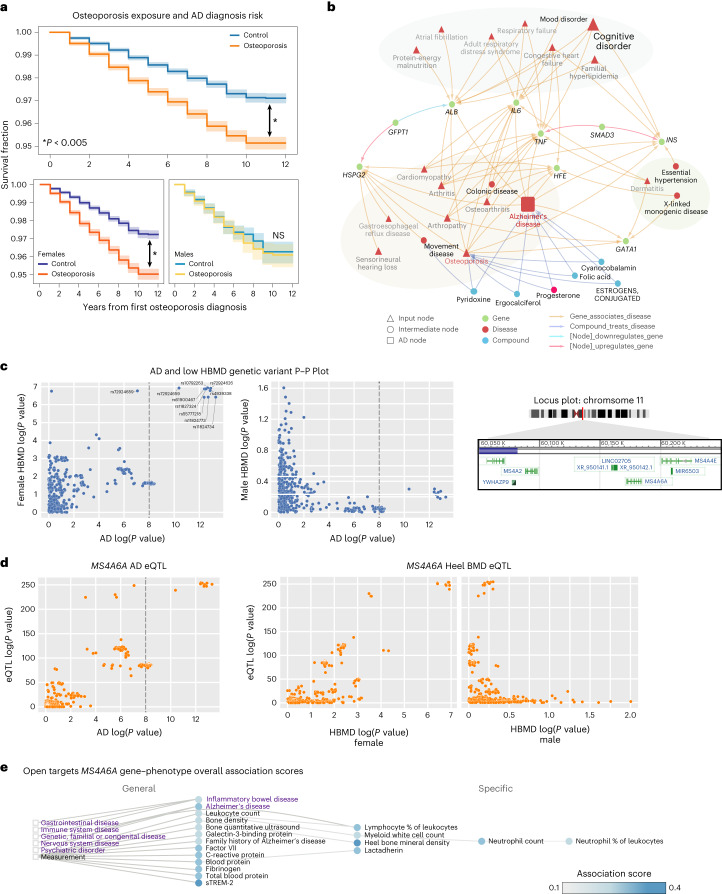
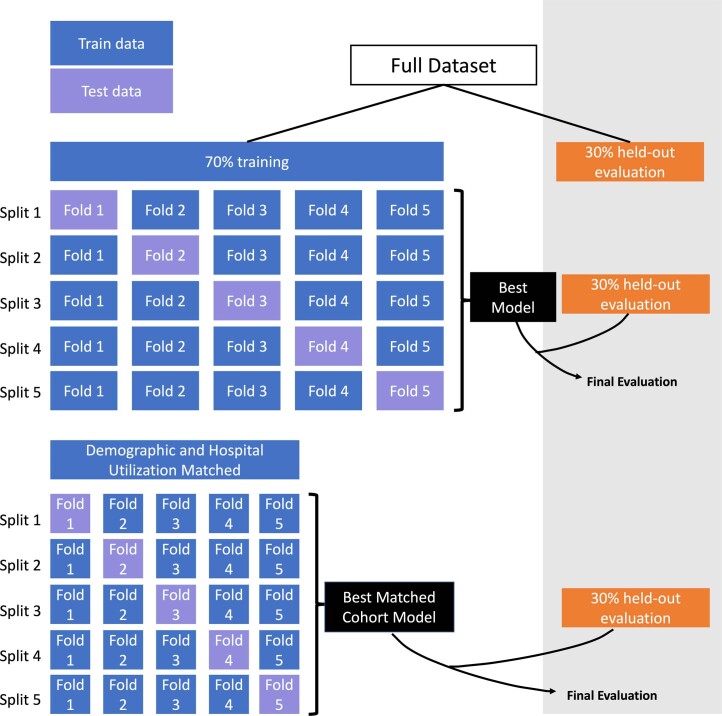
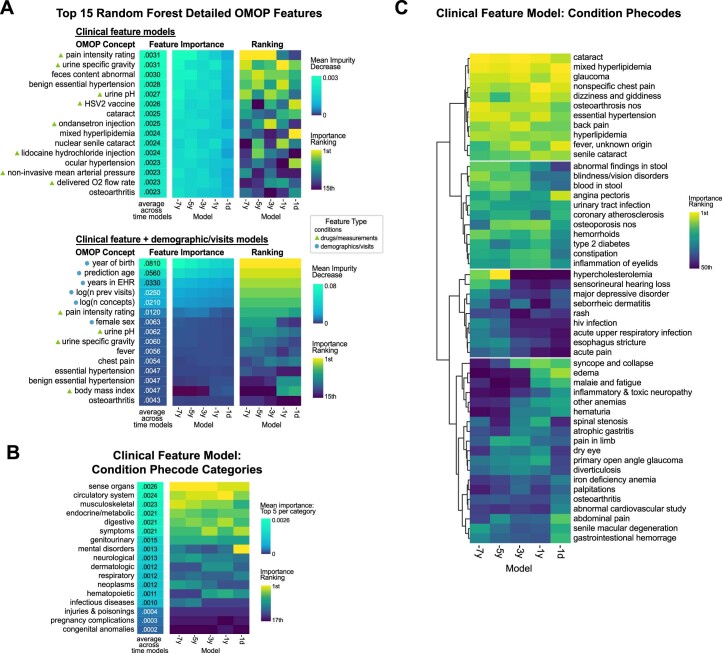
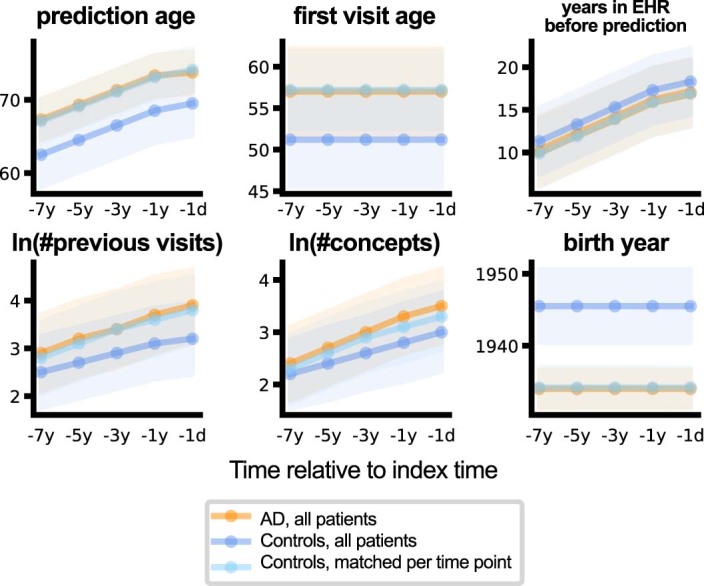
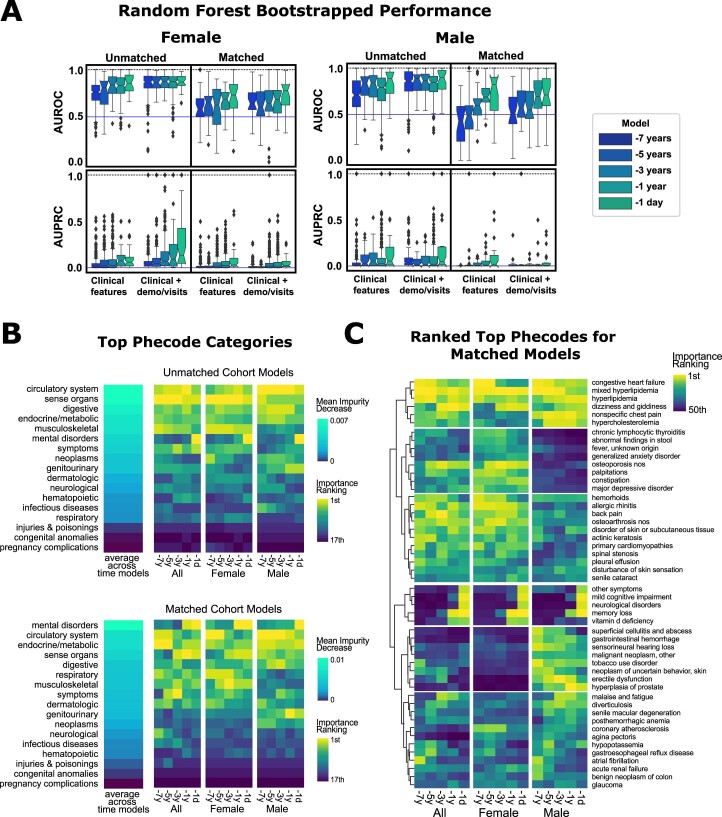
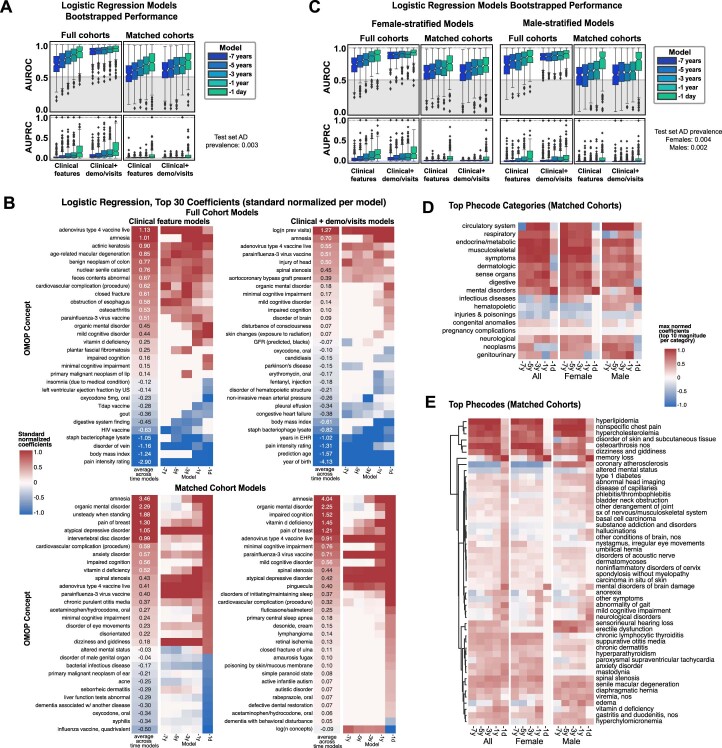
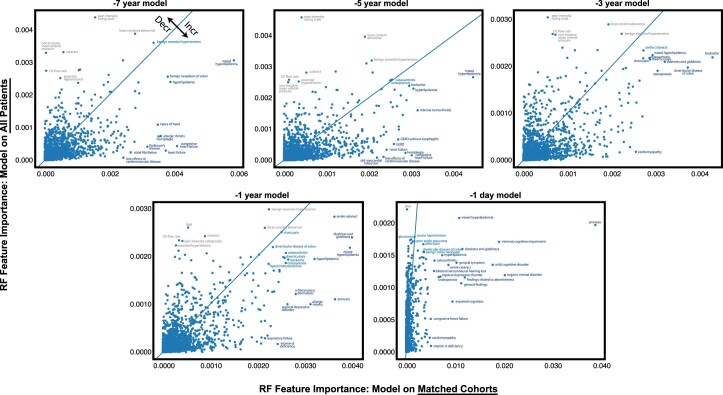
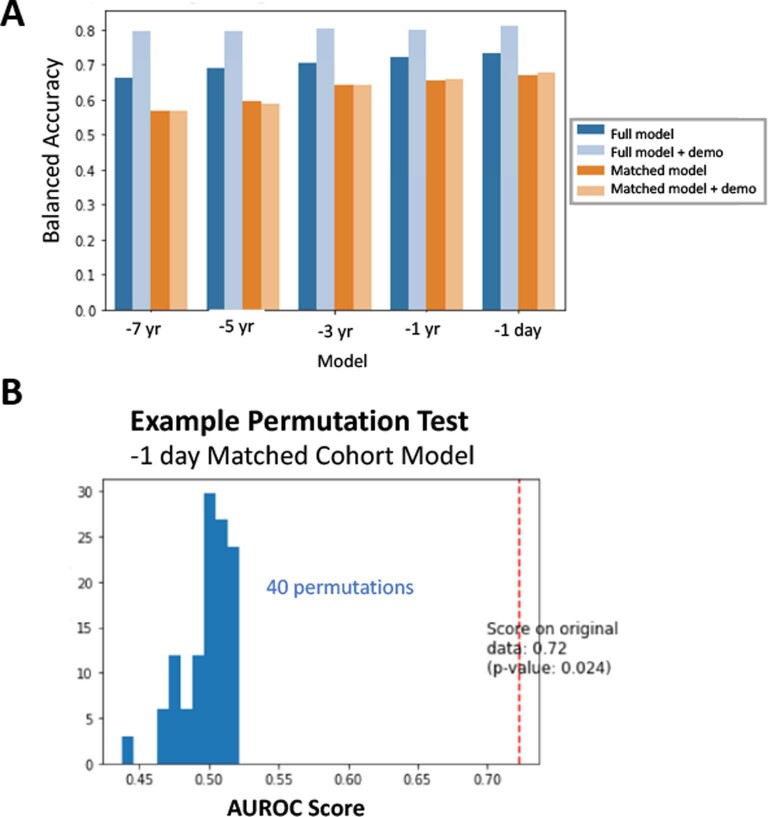
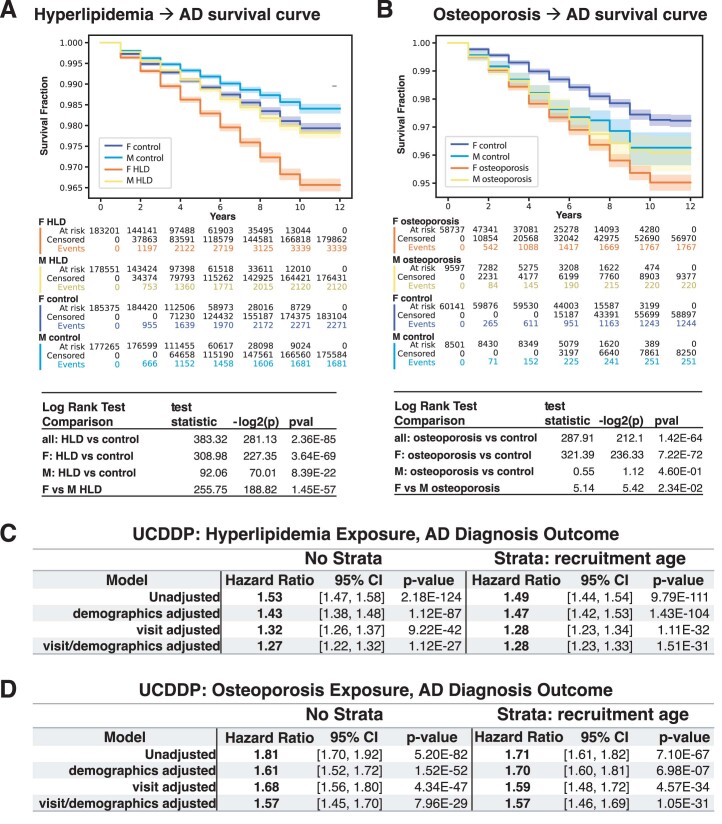
Identification of Alzheimer's disease (AD) onset risk can facilitate interventions before irreversible disease progression. We demonstrate that electronic health records from the University of California, San Francisco, followed by knowledge networks (for example, SPOKE) allow for (1) prediction of AD onset and (2) prioritization of biological hypotheses, and (3) contextualization of sex dimorphism. We trained random forest models and predicted AD onset on a cohort of 749 individuals with AD and 250,545 controls with a mean area under the receiver operating characteristic of 0.72 (7 years prior) to 0.81 (1 day prior). We further harnessed matched cohort models to identify conditions with predictive power before AD onset. Knowledge networks highlight shared genes between multiple top predictors and AD (for example, APOE, ACTB, IL6 and INS). Genetic colocalization analysis supports AD association with hyperlipidemia at the APOE locus, as well as a stronger female AD association with osteoporosis at a locus near MS4A6A. We therefore show how clinical data can be utilized for early AD prediction and identification of personalized biological hypotheses.


Conflict of interest statement

Unrelated to the work described in this manuscript, R.B. has received research support from F Hoffmann-La Roche, Novartis and Biogen and has received personal support for consulting and/or scientific advisory boards from Alexion, EMD Serono, Horizon, Jansen and TG Therapeutics. Also unrelated to the work, K.P.R. has served on a medical advisory board for Eli Lily. S.B. is co-founder of Mate Bioservices. J.R. has previously interned at Roche. The remaining authors declare no competing interests.

Figures

Fig. 1
Fig. 1. Overview of participant selection and RF model performance.
a, From the UCSF EHRs and the UCSF Memory and Aging Center (MAC) database, participant and clinical information was extracted, filtered and prepared for time points before the index time. All clinical features extracted were one-hot encoded and trained on random forest (RF) models to predict future risk of AD diagnosis. Models were evaluated on a 30% held-out evaluation set to compute AUROC/AUPRC and interpreted based on feature importances and using a heterogeneous knowledge network (SPOKE). Top features were then further validated in external databases. b, Filtering a consistent set of individuals with AD and controls from the UCSF EHR for model training and testing. Filtered participant cohorts are shown in Table 1 and split with 30% held-out set for testing. c, Bootstrapped performance of RF models on the held-out evaluation set (n = 300 bootstrapped iterations of 1,000 participants, prevalence of AD on held-out set = 0.003). Bootstrapped AUROC performance for models trained and tested on female strata and male strata are also shown. The box shows quartiles (25th, 50th and 75th percentiles), whiskers extend to 1.5 times the interquartile range, and the remaining points are outliers.
Fig. 2
Fig. 2. Models trained on matched cohorts allow for identification of hypotheses for AD predictors.
a, Bootstrapped performance of models trained on cohorts matched by demographics and visit-related factors on the full held-out evaluation set (n = 300 bootstrapped iterations of 1,000 individuals, prevalence of AD on held-out set = 0.003). The box plot shows quartiles (25th, 50th and 75th percentiles), whiskers extend to 1.5 times the interquartile range, and the remaining points are outliers. b, Top clinical phecode categories for matched models ranked by the average of the top five importance values for each phecode category. Sorting is based on this average across time models. c, Top 50 phecodes (detailed features) across time models, with features clustered based on ward distance of rankings. d, Bootstrapped performances of sex-stratified matched models on the held-out evaluation set (n = 300 bootstrapped iterations of 1,000 individuals for each sex; reference AUPRC = 0.0036 female, 0.0022 male). Each box shows quartiles (25th, 50th and 75th percentiles), and whiskers extend to 1.5 times the interquartile range, with remaining points as outliers. e, Overlap of top matched model features for models trained on all individuals, female stratified individuals, and male stratified individuals, with model cutoff importance (RF average impurity decrease) greater than 1 × 10−6. Specific features are listed, with bold features indicating top features across all five time models and non-bolded features indicating top features across four time models.
Fig. 3
Fig. 3. SPOKE provides biological prioritization of hypotheses associated with shared clinical phenotypes.
Combined SPOKE network of all shortest paths to AD node (Disease Ontology ID: 10652) for the top 25 input features (bolded) from matched AD model at every time point. Network is organized based on the number of time point model occurrences (y axis) and eccentricity of a node in the subnetwork (x axis). Specific time point model occurrences are colored by the pie chart within each node.
Fig. 4
Fig. 4. The HLD and AD association is validated externally with APOE as a shared causal genetic link.
a, Kaplan–Meier curve on UC-wide EHR for HLD as the exposure (error bands show 95% CI). Two-sided log-rank test is significant for all HLD versus controls (P = 2.4 × 10−85), female HLD versus female controls (P = 3.6 × 10−69), and male HLD versus male controls (P = 8.4 × 10−22). *P < 0.005. b, First-degree and second-degree neighbors of HLD on the full network representing all shortest paths from the top 25 features per time model. c, PheWAS for variant rs2075650 (ch19:44892362(hg38):A > G) on a shared locus associated with both HLD and AD, plotted based on multiple prior studies with variant phenotype associations with P value < 0.05 from the UK Biobank. The red line indicates a Bonferroni-corrected significance level of 0.05 (191 phenotypes, Bonferroni P value = 0.00026), and the arrow direction represents the beta direction of effect of the alternative allele. d, Plot of APOE protein expression colocalization with H4 (probability two associated traits share a causal variant) from Open Targets Genetics. Each dot represents a specific phenotype categorized based on trait (x axis). Each color represents an APOE molecular trait measured from blood plasma from refs. ,.
Fig. 5
Fig. 5. The association between osteoporosis and AD is validated externally with MS4A6A as a potential female-specific shared genetic link.
a, Kaplan–Meier curve on UC-wide EHR for osteoporosis as the exposure (error bands show 95% CI). Two-sided log-rank test is significant for all osteoporosis-exposed individuals versus controls (P = 1.4 × 10−64) and osteoporosis-exposed female individuals versus controls (P = 7.2 × 10−72), but not male osteoporosis-exposed individuals versus controls (P = 0.46). *P < 0.005. b, First-degree and second-degree neighbors of osteoporosis node on the network representing all shortest paths from the top 25 features per time model. c, P–P plots between summary statistics of AD GWAS (P value computed as described in ref. , n = 455,258) and sex-stratified HBMD GWAS (female n = 111,152, male HBMD n = 166,988, P value computed as described in Neale’s Lab GWAS version 3) of variants around the MS4A locus (left and middle plots) at region 60050000–60200000 of chr11 (locus plot on right). d, MS4A6A gene expression (cis-eQTL, P values computed as described in ref. ) association with AD GWAS (P value computed as described in ref. ) and association with sex-stratified low HBMD (P value computed as described in Neale’s Lab GWAS version 3). e, Open Targets Genetics associated phenotype graph for MS4A6A with association score computed based on a weighted harmonic sum across evidence (described in https://platform-docs.opentargets.org/associations#association-scores/). Purple words indicate diseases, while black words indicate measurements. Circles are phenotypes colored by the association score, and boxes represent the most general categories. NS, not significant.
Extended Data Fig. 1
Extended Data Fig. 1. Cross-validation Approach.
The full dataset was split into 70% for training and choosing the best model, and 30% was set aside as the held-out evaluation set. Model selection and optimization was performed with cross-validation on the 70% training set. All final models are then evaluated on the 30% held-out evaluation set.
Extended Data Fig. 2
Extended Data Fig. 2. Top detailed features and phecodes from the random forest model.
a. Top detailed OMOP clinical features utilized in models for clinical feature only models (top), or clinical features + demographic + visit information models (bottom). Features within the drug/measurement categories are marked with a triangle, while demographic/visit features are marked with a circle. b. Top phecode categories utilized in models, where importance is determined by the top 5 detailed features within each phecode mapping. The vertical order is based upon the average importance across time models. c. Top 50 phecodes utilized in time models, clustered based on relative importance across time models.
Extended Data Fig. 3
Extended Data Fig. 3. Comparison of age and visit-related factors between AD, controls, and matched controls.
The plots demonstrate the distribution of continuous variables utilized in matching with error bands representing standard deviation. Orange represents AD patients at each time point. Dark blue represents all controls, while light blue represents controls that have been matched at each time point.
Extended Data Fig. 4
Extended Data Fig. 4. Sex stratified model performance and top features.
a. The full performance of sex-stratified models is shown. The bootstrapped AUROC/AUPRC is determined by the male or female strata of the initial 30% held-out evaluation set (n = 300 bootstrapped iterations of 1000 patients for each sex, reference AUPRC = 0.0036 female, 0.0022 male). The box shows quartiles (25%, 50%, 75%ile), and whiskers extend to 1.5*interquartile range, with remaining points as outliers. b. Top phecode categories are listed by importance for all models, with inclusion of comparison with the general non-stratified model. Vertical ordering is determined by the average importance across time models. c. Top 50 important phecodes clustered by relative importance across time models and across strata.
Extended Data Fig. 5
Extended Data Fig. 5. Logistic regression models and top coefficients.
a. The full performance of logistic regression models. The bootstrapped AUROC/AUPRC is determined the 30% held-out evaluation set (n = 300 bootstrapped iterations of 1000 patients). The box shows quartiles (25%, 50%, 75%ile), and whiskers extend to 1.5*interquartile range, with remaining points as outliers. b. Top detailed OMOP feature logistic regression coefficients are listed by importance for all model formulations. Top row shows coefficients from the model trained on all patients, while the bottom row shows coefficients from the model trained on matched cohorts. c. The full performance of sex-stratified logistic regression models is shown. The bootstrapped AUROC/AUPRC is determined by the male or female strata of the initial 30% held-out evaluation set (n = 300 bootstrapped iterations of 1000 patients for each sex). The box shows quartiles (25%, 50%, 75%ile), and whiskers extend to 1.5*interquartile range, with remaining points as outliers. d. Top phecode categories across time models and across strata, determined by the top 10 logistic regression coefficient magnitudes within each category. e. Top 50 important phecodes clustered by average logistic regression coefficient across time models and across strata, where the average logistic regression coefficient is determined by the top 10 logistic regression coefficient magnitudes within each category.
Extended Data Fig. 6
Extended Data Fig. 6. Random Forest Feature Importance Changes Between Models.
A comparison of the random forest model feature importance between the model trained on all patients (y-axis) and the model trained on demographics/care utilization matched cohorts (x-axis). The blue line represents no change in feature importance. Above the blue line represents a decrease in feature importance in the model trained on the full cohort compared to matched cohorts, and below the line represents features with increased importance for the model trained on matched cohorts.
Extended Data Fig. 7
Extended Data Fig. 7. Balanced Accuracy and Example Permutation Test.
a. Balanced accuracy on the 30% held-out evaluation set was computed for all random forest models. b. A null distribution for AUROC (score) was computed based on retrained random forest models with permutations on the ground truth label (40 permutations). P-value is calculated by (C + 1) / (n_permutations + 1), where C represents the number of permutations that scored better than the non-permuted dataset (see documentation for scikit-learn documentation of permutation_test_score function for associated paper and details).
Extended Data Fig. 8
Extended Data Fig. 8. External EHR validation support increased AD diagnosis with hyperlipidemia and osteoporosis exposure.
a. Sex-stratified combined Kaplan-Meier survival curves with hyperlipidemia (HLD) as the exposure (curve shows survival fraction, error bands show 95% confidence interval). Patient attrition is shown in the middle for each subgroup. Below, two-sided log rank test comparison results are shown. F = female, M = male. b. Sex-stratified combined Kaplan-Meier survival curves with osteoporosis as the exposure (curve shows survival fraction, error bands show 95% confidence interval). Patient attrition is shown in the middle for each subgroup. Two-sided log rank test comparison results are shown below. c. Hyperlipidemia exposure cox proportional hazard models for AD as the outcome, shown are the hazard ratios and 95% confidence intervals obtained from the exposure coefficient for unadjusted, demographic adjusted (gender, age, race, ethnicity), visit adjusted (first visit age, log(number of visits)), and demographic/visit adjusted. Right group shows computed hazard ratios with stratification by recruitment or starting age (age strata: <55, 55-60, 60-65, 65-70, 70-75, 75-80, >80). P-values are computed by a Wald’s test whose distribution is approximated by a Chi-squared test (two-sided) with one degree-of-freedom. d. Osteoporosis exposure cox proportional hazard models for AD as the outcome, shown are the hazard ratios and 95% confidence intervals obtained from the exposure coefficient for unadjusted, demographic adjusted, visit adjusted, and demographic/visit adjusted. Right group shows computed hazard ratios with stratification by recruitment or starting age (age strata: <60, 60-65, 65-70, 70-75, 75-80, >80). P-values are computed by a Wald’s test whose distribution is approximated by a Chi-squared test (two-sided) with one degree-of-freedom.

References

    1. 2022 Alzheimer’s disease facts and figures. Alzheimers Dement. 18, 700–789 (2022). - PubMed
    1. Rasmussen J, Langerman H. Alzheimer’s disease – why we need early diagnosis. Degener. Neurol. Neuromuscul. Dis. 2019;9:123–130. - PMC - PubMed
    1. Kivipelto M. Midlife vascular risk factors and Alzheimer’s disease in later life: longitudinal, population based study. BMJ. 2001;322:1447–1451. doi: 10.1136/bmj.322.7300.1447. - DOI - PMC - PubMed
    1. Niculescu AB, et al. Blood biomarkers for memory: toward early detection of risk for Alzheimer disease, pharmacogenomics, and repurposed drugs. Mol. Psychiatry. 2020;25:1651–1672. doi: 10.1038/s41380-019-0602-2. - DOI - PMC - PubMed
    1. Savonenko, A. V., Wong, P. C., & Li, T. Alzheimer diseases. In Neurobiology of Brain Disorders: Biological Basis of Neurological and Psychiatric Disorders, 2nd Edition (eds Zigmond, M. .J. et al.) 313–336 (Elsevier, 2023). 10.1016/b978-0-323-85654-6.00022-8

Substances