. 2024 Apr;25(4):1792-1813.
doi: 10.1038/s44319-024-00095-9. Epub 2024 Feb 21.

IRE1 RNase controls CD95-mediated cell death

Affiliations

IRE1 RNase controls CD95-mediated cell death

Diana Pelizzari-Raymundo et al. EMBO Rep. 2024 Apr.

Abstract

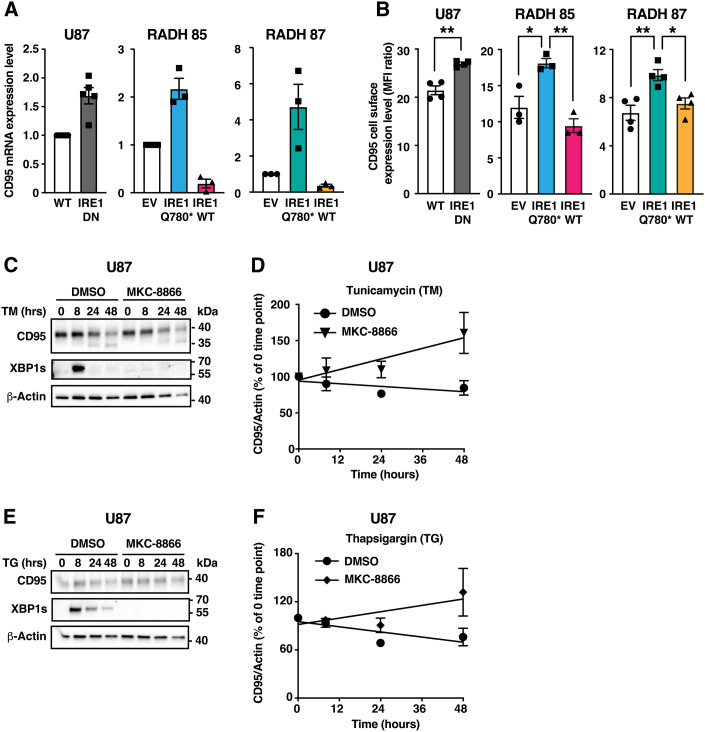
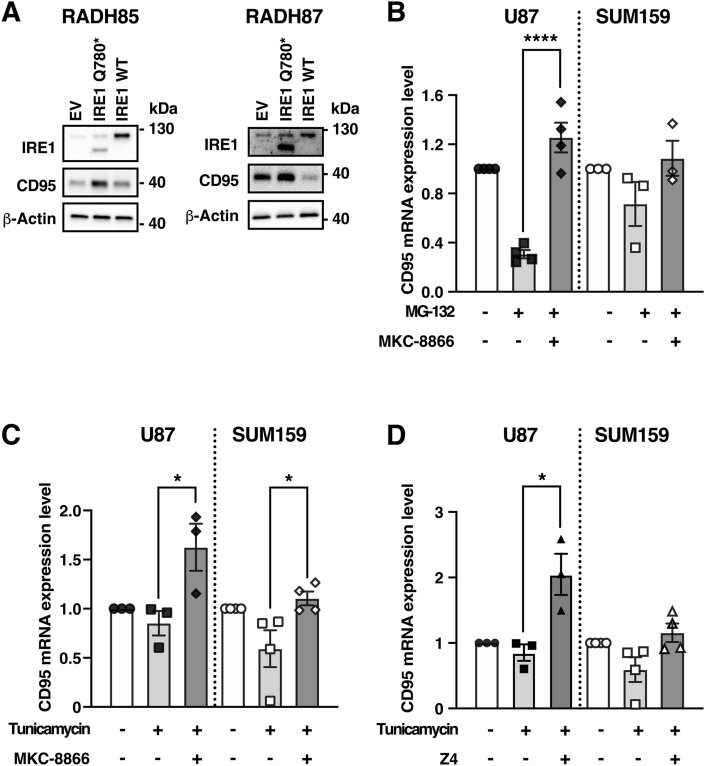
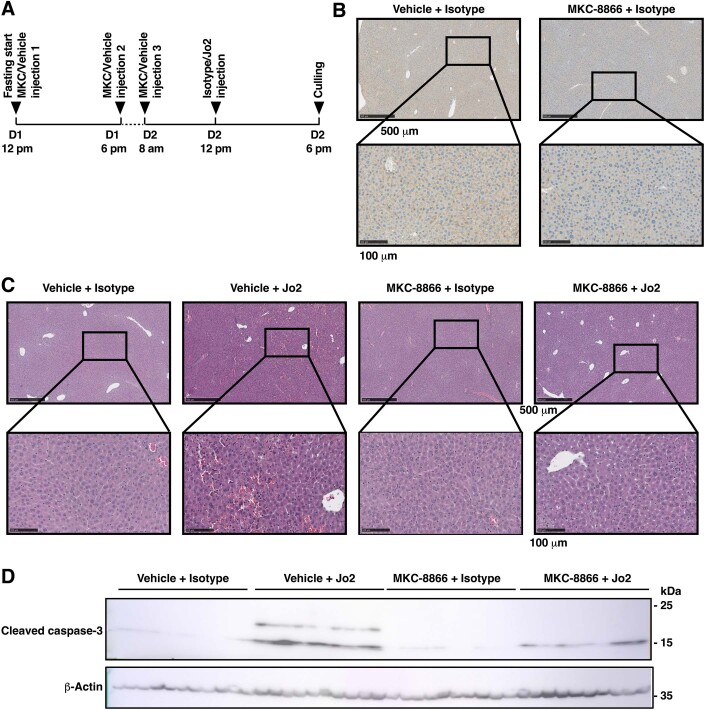
Signalling by the Unfolded Protein Response (UPR) or by the Death Receptors (DR) are frequently activated towards pro-tumoral outputs in cancer. Herein, we demonstrate that the UPR sensor IRE1 controls the expression of the DR CD95/Fas, and its cell death-inducing ability. Both genetic and pharmacologic blunting of IRE1 activity increased CD95 expression and exacerbated CD95L-induced cell death in glioblastoma (GB) and Triple-Negative Breast Cancer (TNBC) cell lines. In accordance, CD95 mRNA was identified as a target of Regulated IRE1-Dependent Decay of RNA (RIDD). Whilst CD95 expression is elevated in TNBC and GB human tumours exhibiting low RIDD activity, it is surprisingly lower in XBP1s-low human tumour samples. We show that IRE1 RNase inhibition limited CD95 expression and reduced CD95-mediated hepatic toxicity in mice. In addition, overexpression of XBP1s increased CD95 expression and sensitized GB and TNBC cells to CD95L-induced cell death. Overall, these results demonstrate the tight IRE1-mediated control of CD95-dependent cell death in a dual manner through both RIDD and XBP1s, and they identify a novel link between IRE1 and CD95 signalling.

Keywords: CD95; Cell Death; ER Stress; IRE1; Unfolded Protein Response.


Conflict of interest statement

EC is a founder of Thabor Therapeutics. The authors do not declare any conflict of interest.

Figures

Figure 1
Figure 1. IRE1 regulates CD95 expression in TNBC and GB cells.
(A) mRNA was extracted from WT or IRE1 DN-expressing U87 cells and from empty vector (EV), IRE1WT- or IRE1Q780*-expressing RADH85 and RADH87 cells. CD95 mRNA was quantified by RT-qPCR and normalized to GAPDH. Mean ± SEM, n = 3–5. (B) CD95 cell surface level expression was evaluated by flow cytometry. Mean of MFI ratio ± SEM, n = 3–4. Unpaired t-test for U87 (**p = 0.001126); one-way ANOVA with Tukey multiple comparison correction for RADH85 (*p = 0.018416 and **p = 0.003549) and RADH87 (*p = 0.0263 and **p = 0.0054). (C,D) U87 cells pre-treated for 2 h with MKC-8866 (30 μM) as indicated were further treated with 500 ng/mL tunicamycin for the indicated times. Lysates were analysed using western blot. (C) One representative experiment out of three independent ones is shown. (D) Quantification for three independent experiments is depicted. Mean ± SEM. (E,F) U87 cells pre-treated for 2 h with MKC-8866 (30 μM) as indicated were further treated with 50 nM thapsigargin for the indicated times. Lysates were analysed using western blot. (E) One representative experiment out of three independent ones is shown. (F) Quantification for three independent experiments is depicted. Mean ± SEM. Source data are available online for this figure.
Figure 2
Figure 2. IRE1 cleaves CD95 mRNA in vitro.
(A) RNA (2 μg) extracted from U87 cells was incubated with the indicated amounts of recombinant IRE1 for 1 h. CD95 mRNA was then quantified by RT-qPCR and normalized to GAPDH. Mean ± SEM, n = 3. One-way ANOVA with Dunnett multiple comparison correction, ***p = 0.0003 (0 vs 0.5 μg IRE1 groups), ***p = 0.0007 (0 vs 1 μg IRE1 groups) (B) Predicted folded structure of CD95 mRNA. The two predicted cleavage sites within hairpin loops are highlighted. (C,D) RNA (2 μg) extracted from U87 cells was incubated with the indicated amounts of recombinant IRE1 for 1 h. 136-bp (C) and 121-bp (D) parts of CD95 mRNA including the indicated potential cleavage sites were then quantified by RT-qPCR and normalized to GAPDH. Mean ± SEM, n = 3. One-way ANOVA with Dunnett multiple comparison correction, (D) *p = 0.0331, **p = 0.0096. Source data are available online for this figure.
Figure 3
Figure 3. CD95 is not a universal determinant of ER-stress induced cell death whilst IRE1 RNase activity limits CD95L-induced cell death.
(A) U87 were transfected with siRNA control or targeting CD95. 48 h later, cells were treated for 48 h with the indicated ER stress inducers. Viability was determined using an MTT assay. The relative IC50 calculated for each independent experiment is represented (see also Appendix Fig. S2A). Mean ± SEM, n = 3–4. **p = 0.013, unpaired t-test (B). U87 WT or expressing IRE1DN were treated with 1 μg/mL CD95L for 12 h. % of cell death was defined as the % of Cytotox red-positive cells as detected by the Incucyte. Mean ± SEM of three independent experiments. (C) U87 WT or expressing IRE1DN were treated with 250 ng/mL CD95L for the indicated times. Lysates were analysed using western blot. One experiment representative of three independent ones is shown. (D) RADH85 control (EV), stably expressing IRE1Q780* or IRE1WT were treated with 500 ng/mL CD95L for 12 h. % of cell death was defined as the % of Cytotox red-positive cells as detected by the Incucyte. Mean ± SEM of three independent experiments. (E) Empty vector (EV), IRE1WT- or IRE1Q780*-expressing RADH85 were treated with 500 ng/mL CD95L for the indicated times. The DISC was immunoprecipitated using an anti-CD95 antibody prior to western blot analysis. One experiment representative of two independent ones is shown. *Indicates an unspecific band. Source data are available online for this figure.
Figure 4
Figure 4. IRE1 RNase inhibition limits hepatic CD95 expression and CD95-mediated cell death in mice.
(A) Timeline of in vivo experiment 1. Eight mice were divided in two groups of 4 and repeatedly injected as indicated with either vehicle (group 1) or MKC-8866 (group 2). (B) IHC staining for CD95 on liver tissue from the two groups of mice described in A. Left: quantification of CD95 staining. Mean ± SEM of n = 4 mice per group; *p = 0.0286, with Mann–Whitney test for comparison of the two groups. Right: representative IHC image for each group. (C) IHC staining for cleaved caspase-3 on liver tissue from the two indicated groups of mice described in Fig. EV3A. Left: quantification of cleaved caspase-3 staining. Mean ± SD of n = 10 mice per group; five images per liver. ****p = 0.000043 Mann–Whitney test for comparison of the two indicated groups. Right: representative IHC image for each group. Source data are available online for this figure.
Figure 5
Figure 5. IRE1 dually controls CD95 expression and CD95L-induced cell death via RIDD and XBP1s and the relative activation of each branch correlates with CD95 expression in tumours.
(A) U87 cells were transfected with siRNA control or targeting XBP1, IRE1 or PERK as indicated. 16 h later, cells were treated with DMSO (D) or 250 nM thapsigargin (TG) for 8 h. Lysates were analysed using western blot. One experiment representative of at least three independent ones is shown. (B) U87 cells were transfected with a plasmid coding for FLAG-XBP1s (XBP1s) or an empty vector (EV). 48 h later, cells were treated with the indicated concentrations of CD95L for 48 h. Viability was assessed using MTT assay and normalized to untreated cell values. Mean ± SEM of three independent experiments. Inset: western blot analyses of cell lysates 48 h post-transfection. (C) U87 cells were treated with DMSO or MKC-8866 (30 mM) for the indicated times. Lysates were analysed using western blot. One experiment representative of three independent ones is shown. (D) U87 cells treated with 30μM MKC-8866 or DMSO were further treated with 1 µg/mL CD95L for the indicated times. Cell death was evaluated using Cytotox red positivity. Mean ± SEM, n = 3. (EG) U87 were transfected with siRNA control or targeting XBP1, IRE1 or PERK as indicated. 72 h later, cell lysates were analysed using western blot. One experiment representative of at least three independent ones is shown. (H,I) CD95 expression z-scores of 45 GB and 62 TNBC tumours were plotted according to the RIDD activity score (H) and according to the XBP1s activity score (I). The distribution of z-score is represented as violin plots. For GB n = 45; for TNBC n = 62. Statistical difference of expression between groups was calculated using Mann–Whitney tests and the p-value is indicated (H GB ***p = 4.3e−05, TNBC ***p = 4.1e−06; I GB** p = 0.0025, * TNBC p = 0.015). Source data are available online for this figure.
Figure EV1
Figure EV1. IRE1 represses CD95 expression in GB cells upon ER stress.
(A) CD95 protein level was evaluated using western blot on lysates from the indicated cells. One representative experiment out of three independent experiments is presented. (B) U87 or SUM159 cells were pre-incubated for 1 h with 1 μg/mL of actinomycin D and further treated with 10 μM MKC-8866 for 1 h followed by 2 h treatment with 10 μM MG-132 as indicated. CD95 mRNA expression level, normalized to GAPDH, was expressed as fold of value obtained for control (actinomycin-only treated samples). Mean ± SEM, n = 3–4. Unpaired t-test (for comparing MG-132 and MG-132 + MKC-treated group), ****p = 0.0003. (C,D) U87 or SUM159 cells were pre-incubated for 1 h with 1 μg/mL of actinomycin D and further treated with 10 μM MKC-8866 or 10 μM Z4 for 1 h followed by 2 h treatment with 1μg/mL tunicamycin as indicated. CD95 mRNA expression level, normalized to GAPDH, was expressed as fold of value obtained for control (actinomycin-only treated samples). Mean ± SEM, n = 3–4. Unpaired t-test (for comparing TM and TM + MKC groups for (C) or TM and TM + Z4 groups for (D)), (C) *p = 0.0461 for U87, *p = 0.0437 for SUM159, (D) *p = 0.0241 for U87, (ns, p = 0.0538 for SUM159).
Figure EV2
Figure EV2. CD95 is not a universal determinant of ER-stress induced cell death whilst IRE1 RNase activity limits CD95L-induced cell death.
(A) MDA-MB-231 WT or CD95 KO clones were treated for 48 h with the indicated ER stress inducers. Viability was determined using an MTT assay and relative IC50 calculated for each independent experiment (see also Appendix Fig. 2B). **p = 0.044, ***p = 0.0002, one-way ANOVA with Tukey multiple comparison correction. (B) RADH87 control (EV), stably expressing IRE1Q780* or IRE1WT were pre-treated with 200 nM (2X) of Birinapant for 1 h prior to addition of 1 μg/mL CD95L for 24 h. % of cell death was defined as the % of Cytotox red-positive cells as detected by the Incucyte. Mean ± SEM of three independent experiments.
Figure EV3
Figure EV3. IRE1 RNase inhibition limits hepatic CD95 expression and CD95-mediated cell death in mice.
(A) Timeline of the second in vivo experiment. 40 mice were divided in two groups of 20 and were repeatedly injected with either vehicle or MKC-8866 as indicated. On day 2 at 12 pm, each of this initial groups were further divided in two groups of 10 mice which were injected with either an anti-CD95 antibody or with an isotype control as indicated. (B) CD95 expression was evaluated by IHC in mice injected with vehicle or MKC-8866 and the isotype control antibody. One representative image is shown for each of these two groups. (C) HES staining was performed on liver tissue sections from mice of each of the four groups described in (A). One representative image is shown for each of these groups. (D) Western blot analysis of liver lysates from mice treated as indicated.
Figure EV4
Figure EV4. IRE1 RNase dually controls CD95 expression and CD95L-induced cell death.
(A) U87 cells were transfected with siRNA control or targeting XBP1, IRE1 or PERK as indicated. 16 h later, cells were treated with 2.5 μg/mL thapsigargin for 8 h. Lysates were analysed using western blot. One experiment representative of at least three independent ones is shown. (B) SUM159 cells were transfected with a plasmid coding for FLAG-XBP1s (XBP1s) or an empty vector (EV). 48 h later, cells were treated with the indicated concentrations of CD95L for 48 h. Viability was assessed using MTT assay and normalized to untreated cell values. Mean ± SEM of three independent experiments. Inset: western blot analyses of cell lysates 48 h post-transfection. (C) U87 cells were treated with DMSO or Z4 (25 μM) for the indicated times. Lysates were analysed using western blot. One experiment representative of three independent ones is shown. (D) U87 were transfected with siRNA control or targeting IRE1 as indicated. 72 h later, cells were treated with 100 ng/mL CD95L. % of cell death was defined as the % of Cytotox red-positive cells as detected by the Incucyte. Two independent experiments are shown. Source data are available online for this figure.
Figure EV5
Figure EV5. Low RIDD activity and high XBP1s activity in tumours correlate with the expression of DR.
(AF) TNFR1 (A,D), TRAIL-R1 (B,E), TRAIL-R2 (C,F) expression z-scores of 45 GB and 62 TNBC tumours were plotted according to the RIDD or XBP1 activity score. The distribution of z-score is represented as violin plots. For GB n = 45; for TNBC n = 62. Statistical difference of expression between groups was calculated using Mann–Whitney tests and the p-value is indicated ((A) **p = 0.0016 for GB and **p = 0.0025 for TNBC; (B) **p = 0.0017 for GB and p = 0.13 for TNBC; (C) **p = 0.0044 for GB and p = 0.34 for TNBC; (D) p = 0.18 for GB and ***p = 2e − 06 for TNBC; (E) **p = 0.0011 for GB and **p = 0.0017 for TNBC; (F) p = 0.23 for GB and **p = 0.0016 for TNBC).

References

    1. Almanza A, Carlesso A, Chintha C, Creedican S, Doultsinos D, Leuzzi B, Luis A, McCarthy N, Montibeller L, More S, et al. Endoplasmic reticulum stress signalling - from basic mechanisms to clinical applications. FEBS J. 2019;286:241–278. doi: 10.1111/febs.14608. - DOI - PMC - PubMed
    1. Anderson DJ, Le Moigne R, Djakovic S, Kumar B, Rice J, Wong S, Wang J, Yao B, Valle E, Kiss von Soly S, et al. Targeting the AAA ATPase p97 as an approach to treat cancer through disruption of protein homeostasis. Cancer Cell. 2015;28:653–665. doi: 10.1016/j.ccell.2015.10.002. - DOI - PMC - PubMed
    1. Annibaldi A, Walczak H. Death receptors and their ligands in inflammatory disease and cancer. Cold Spring Harb Perspect Biol. 2020;12:a036384. doi: 10.1101/cshperspect.a036384. - DOI - PMC - PubMed
    1. Auyeung VC, Downey MS, Thamsen M, Wenger TA, Backes BJ, Sheppard D, Papa FR. IRE1α drives lung epithelial progenitor dysfunction to establish a niche for pulmonary fibrosis. Am J Physiol Lung Cell Mol Physiol. 2022;322(4):L564–L580. doi: 10.1152/ajplung.00408.2021. - DOI - PMC - PubMed
    1. Avril T, Vauleon E, Hamlat A, Saikali S, Etcheverry A, Delmas C, Diabira S, Mosser J, Quillien V. Human glioblastoma stem-like cells are more sensitive to allogeneic NK and T cell-mediated killing compared with serum-cultured glioblastoma cells. Brain Pathol. 2012;22:159–174. doi: 10.1111/j.1750-3639.2011.00515.x. - DOI - PMC - PubMed