. 2024 Apr 1;84(7):1065-1083.
doi: 10.1158/0008-5472.CAN-23-2266.

PRMT1 Sustains De Novo Fatty Acid Synthesis by Methylating PHGDH to Drive Chemoresistance in Triple-Negative Breast Cancer

Affiliations

PRMT1 Sustains De Novo Fatty Acid Synthesis by Methylating PHGDH to Drive Chemoresistance in Triple-Negative Breast Cancer

Takehiro Yamamoto et al. Cancer Res. .

Abstract

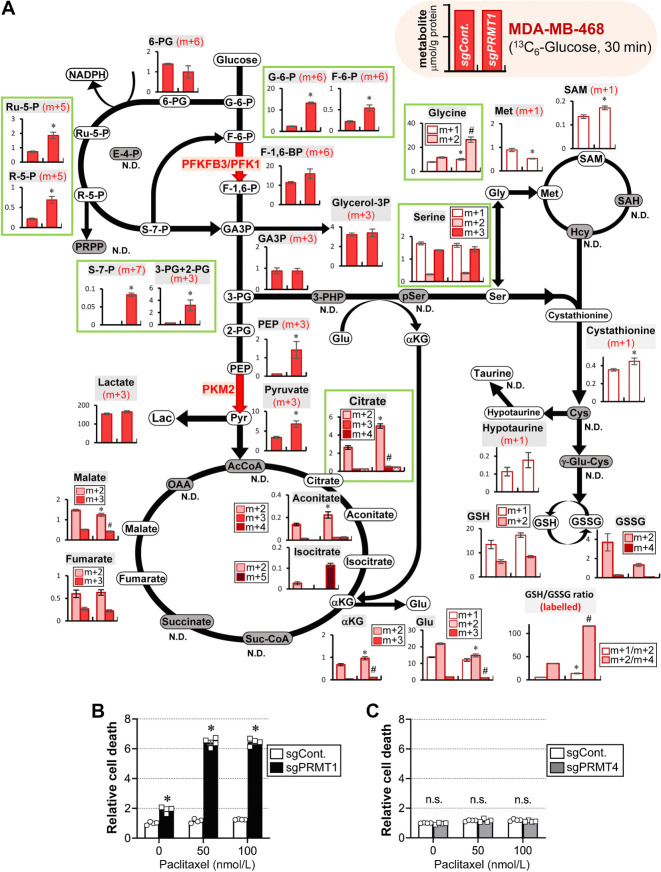
Triple-negative breast cancer (TNBC) chemoresistance hampers the ability to effectively treat patients. Identification of mechanisms driving chemoresistance can lead to strategies to improve treatment. Here, we revealed that protein arginine methyltransferase-1 (PRMT1) simultaneously methylates D-3-phosphoglycerate dehydrogenase (PHGDH), a critical enzyme in serine synthesis, and the glycolytic enzymes PFKFB3 and PKM2 in TNBC cells. 13C metabolic flux analyses showed that PRMT1-dependent methylation of these three enzymes diverts glucose toward intermediates in the serine-synthesizing and serine/glycine cleavage pathways, thereby accelerating the production of methyl donors in TNBC cells. Mechanistically, PRMT1-dependent methylation of PHGDH at R54 or R20 activated its enzymatic activity by stabilizing 3-phosphoglycerate binding and suppressing polyubiquitination. PRMT1-mediated PHGDH methylation drove chemoresistance independently of glutathione synthesis. Rather, activation of the serine synthesis pathway supplied α-ketoglutarate and citrate to increase palmitate levels through activation of fatty acid synthase (FASN). Increased palmitate induced protein S-palmitoylation of PHGDH and FASN to further enhance fatty acid synthesis in a PRMT1-dependent manner. Loss of PRMT1 or pharmacologic inhibition of FASN or protein S-palmitoyltransferase reversed chemoresistance in TNBC. Furthermore, IHC coupled with imaging MS in clinical TNBC specimens substantiated that PRMT1-mediated methylation of PHGDH, PFKFB3, and PKM2 correlates with chemoresistance and that metabolites required for methylation and fatty acid synthesis are enriched in TNBC. Together, these results suggest that enhanced de novo fatty acid synthesis mediated by coordinated protein arginine methylation and protein S-palmitoylation is a therapeutic target for overcoming chemoresistance in TNBC.

Significance: PRMT1 promotes chemoresistance in TNBC by methylating metabolic enzymes PFKFB3, PKM2, and PHGDH to augment de novo fatty acid synthesis, indicating that targeting this axis is a potential treatment strategy.


Figures

None
Graphical abstract
Figure 1. Enhanced arginine methylation of glycolytic enzymes and activation of serine synthetic pathway in the chemoresistant breast cancer cell lines. A and B, Magnitudes of cell death were assessed using the CellTOX Green Cytotoxicity Assay kit. Chemosensitivity to doxorubicin (A) and paclitaxel (B). Mean ± SE (n = 4) *, P < 0.05, versus MCF7 (yellow), an ER-positive breast cancer cell line. Comparisons among all four groups were performed using one-way ANOVA with Fisher LSD test. C, Left, Western blot analyses showing basal expression of enzymes in glycolysis, serine-synthesizing system, and trans-sulfuration pathways in human breast cancer-derived cell lines. Right, each enzyme was mapped to a metabolic pathway. The dataset is representative of at least three independent experiments. D, Protocols to generate Ptx-resistant MDA-MB-231 cells, in which the cells were transplanted into nude mice. E, Western blot analyses showing expression of enzymes in glycolysis, the serine-synthesizing system, and the trans-sulfuration pathway in three different cell lines of Ptx-resistant (Ptx-R) MDA-MB-231 (#1–3). F, Effects of increasing concentration of Ptx on cell death, which was assessed using the CellTOX Green Cytotoxicity Assay kit. *, P < 0.05, compared with parenteral cell death. Data indicate mean ± SE (n = 6). *, P < 0.05 versus parental cells. Differences were tested using two-way ANOVA with Fisher LSD test. G and H, Effects of sgPRMT1 on the cell death of parental (G) and Ptx-R (H) MDA-MB-231 cells. * and †, P < 0.05, two-way ANOVA with Fisher least significant difference test. Data indicate mean ± SE (n = 4). n.s, not significant.
Figure 1.
Enhanced arginine methylation of glycolytic enzymes and activation of serine synthetic pathway in the chemoresistant breast cancer cell lines. A and B, Magnitudes of cell death were assessed using the CellTOX Green Cytotoxicity Assay kit. Chemosensitivity to doxorubicin (A) and paclitaxel (B). Mean ± SE (n = 4) *, P < 0.05, versus MCF7 (yellow), an ER-positive breast cancer cell line. Comparisons among all four groups were performed using one-way ANOVA with Fisher LSD test. C, Left, Western blot analyses showing basal expression of enzymes in glycolysis, serine-synthesizing system, and trans-sulfuration pathways in human breast cancer-derived cell lines. Right, each enzyme was mapped to a metabolic pathway. The dataset is representative of at least three independent experiments. D, Protocols to generate Ptx-resistant MDA-MB-231 cells, in which the cells were transplanted into nude mice. E, Western blot analyses showing expression of enzymes in glycolysis, the serine-synthesizing system, and the trans-sulfuration pathway in three different cell lines of Ptx-resistant (Ptx-R) MDA-MB-231 (#1–3). F, Effects of increasing concentration of Ptx on cell death, which was assessed using the CellTOX Green Cytotoxicity Assay kit. *, P < 0.05, compared with parenteral cell death. Data indicate mean ± SE (n = 6). *, P < 0.05 versus parental cells. Differences were tested using two-way ANOVA with Fisher LSD test. G and H, Effects of sgPRMT1 on the cell death of parental (G) and Ptx-R (H) MDA-MB-231 cells. * and †, P < 0.05, two-way ANOVA with Fisher least significant difference test. Data indicate mean ± SE (n = 4). n.s, not significant.
Figure 2. Site-specific arginine methylation at R20 and R54 by PRMT1 stabilizes PHGDH to sustain enzymatic activity. A, Schematic drawing of PHGDH deletion mutant constructs and a summary of their binding capacity to PRMT1. PHGDH contains distinct five subdomains (SBD1, substrate-binding domain 1; NBD; SBD2, substrate-binding domain 2; ASBD, allosteric substrate-binding domain; and ACTD, aspartate kinase, chorismate mutase, and TyrA domain). B, PRMT1-binding assay to FLAG-tagged human PHGDH several deletion mutants. HA-tagged PRMT1 was transfected into HEK293T cells. The lysates were immunoprecipitated with anti-FLAG M2 agarose, and the eluates were separated by SDS-PAGE. Protein–protein interactions were visualized using an anti-HA antibody. C and D, Determination of arginine residues responsible for the methylation of human PHGDH expressed in HEK293 cells by Orbitrap mass spectrometry. Representative mass spectrum showing mass fragments of PHGDH. Differences in mass values of fragments show that R20 is asymmetrically di-methylated (ADMA; C) and R54 is monomethylated (MMA; D). The mass of each b ion (red) and y ion (blue) is shown. E, Effects of unmethylated PHGDH mutants on enzymatic activity in HEK293T cells. Data express mean ± SE (n = 6). *, P < 0.05, compared with WT. Differences were analyzed using one-way ANOVA with Fisher LSD test. F, Summary of protein arginine methylation sites in human PHGDH. In addition to dimethylation of R20 in the SBD1 domain, R54 in the SBD1 domain and R268 in the NBD are responsible for monomethylation. 3-PG, 3-phosphoglycerate; NAD, oxidized form of nicotinamide adenine dinucleotide. G and H, Differences in R54 monomethylation of PHGDH among four breast cancer cell lines (G) or in MDA-MB-231 cells (H). Arrowhead, signal from methylated PKM2. I, Alterations in PHGDH enzymatic activities in MDA-MB-468 and Ptx-R MDA-MB-231 cells. Data are expressed as mean ± SE of 4 (MDA-MB-468) or 5 (MDA-MB-231) separate sets of experiments. *, P < 0.05 and †, P < 0.05 between the groups shown in the panel. Differences were analyzed using one-way ANOVA with Fisher LSD test. n.s., not significant.
Figure 2.
Site-specific arginine methylation at R20 and R54 by PRMT1 stabilizes PHGDH to sustain enzymatic activity. A, Schematic drawing of PHGDH deletion mutant constructs and a summary of their binding capacity to PRMT1. PHGDH contains distinct five subdomains (SBD1, substrate-binding domain 1; NBD; SBD2, substrate-binding domain 2; ASBD, allosteric substrate-binding domain; and ACTD, aspartate kinase, chorismate mutase, and TyrA domain). B, PRMT1-binding assay to FLAG-tagged human PHGDH several deletion mutants. HA-tagged PRMT1 was transfected into HEK293T cells. The lysates were immunoprecipitated with anti-FLAG M2 agarose, and the eluates were separated by SDS-PAGE. Protein–protein interactions were visualized using an anti-HA antibody. C and D, Determination of arginine residues responsible for the methylation of human PHGDH expressed in HEK293 cells by Orbitrap mass spectrometry. Representative mass spectrum showing mass fragments of PHGDH. Differences in mass values of fragments show that R20 is asymmetrically di-methylated (ADMA; C) and R54 is monomethylated (MMA; D). The mass of each b ion (red) and y ion (blue) is shown. E, Effects of unmethylated PHGDH mutants on enzymatic activity in HEK293T cells. Data express mean ± SE (n = 6). *, P < 0.05, compared with WT. Differences were analyzed using one-way ANOVA with Fisher LSD test. F, Summary of protein arginine methylation sites in human PHGDH. In addition to dimethylation of R20 in the SBD1 domain, R54 in the SBD1 domain and R268 in the NBD are responsible for monomethylation. 3-PG, 3-phosphoglycerate; NAD, oxidized form of nicotinamide adenine dinucleotide. G and H, Differences in R54 monomethylation of PHGDH among four breast cancer cell lines (G) or in MDA-MB-231 cells (H). Arrowhead, signal from methylated PKM2. I, Alterations in PHGDH enzymatic activities in MDA-MB-468 and Ptx-R MDA-MB-231 cells. Data are expressed as mean ± SE of 4 (MDA-MB-468) or 5 (MDA-MB-231) separate sets of experiments. *, P < 0.05 and †, P < 0.05 between the groups shown in the panel. Differences were analyzed using one-way ANOVA with Fisher LSD test. n.s., not significant.
Figure 3. Flux analyses in MDA-MB-468 cells treated with 13C6-glucose loading. A, Metabolome analyses indicating the effects of 13C6-glucose loading for 30 minutes on metabolic intermediates in glycolysis and the serine/glycine cleavage system (left bar; sgControl, right bar; sgPRMT1 cells). 13C-labeled intermediate metabolites were determined using CE-MS. Data showing amounts of 13C6-labeled intermediates in central carbon and sulfur-containing amino acid metabolism, are expressed as mean ± SE (μmol/g protein) of six to eight separate experiments. Fraction of labeling of the different mass isotopologs (m+n; n, number of 13C-labeled carbon atom). *, P < 0.05; #, P < 0.05 versus sgCont. (unpaired Student t test; N.D., not detected). G-6-P, glucose 6-phosphate; F-6-P, fructose 6-phosphate; F-1,6-BP, fructose 1,6-bisphosphate; GA3P, glyceraldehyde 3-phosphate; 3-PG, 3-phosphoglycerate; 2-PG, 2-phosphoglycerate; PEP, phosphoenolpyruvate; 6-PG, 6-phosphogluconate; Ru-5-P, ribulose-5-phosphate; R-5-P, ribose-5-phosphate; S-7-P, sedoheptulose-7-phosphate; E-4-P, erythrose-4-phosphate; PRPP, phosphoribosyl pyrophosphate; Pyr, Pyruvate; Lac, Lactate; AcCoA, acetyl-CoA; Suc-CoA, succinyl-CoA; OAA, oxaloacetate; Glu, glutamic acid; 3-PHP, 3-phosphohydroxypyruvate; pSer, phosphoserine; Ser, serine; Gly, glycine; Met, methionine; SAM, S-adenosylmethionine; SAH, S-adenosylhomocysteine; Hcy, homocysteine; Cys, cysteine; γ-Glu-Cys, gamma glutamylcysteine; GSH, reduced glutathione; GSSG, oxidized glutathione. B and C, Effects of sgPRMT1 (B) and sgPRMT4 (C) on the cell death of MDA-MB-468. *, P < 0.05 versus sgCont. Differences were tested by two-way ANOVA using Fisher LSD test (n = 4). n.s., not significant.
Figure 3.
Flux analyses in MDA-MB-468 cells treated with 13C6-glucose loading. A, Metabolome analyses indicating the effects of 13C6-glucose loading for 30 minutes on metabolic intermediates in glycolysis and the serine/glycine cleavage system (left bar; sgControl, right bar; sgPRMT1 cells). 13C-labeled intermediate metabolites were determined using CE-MS. Data showing amounts of 13C6-labeled intermediates in central carbon and sulfur-containing amino acid metabolism, are expressed as mean ± SE (μmol/g protein) of six to eight separate experiments. Fraction of labeling of the different mass isotopologs (m+n; n, number of 13C-labeled carbon atom). *, P < 0.05; #, P < 0.05 versus sgCont. (unpaired Student t test; N.D., not detected). G-6-P, glucose 6-phosphate; F-6-P, fructose 6-phosphate; F-1,6-BP, fructose 1,6-bisphosphate; GA3P, glyceraldehyde 3-phosphate; 3-PG, 3-phosphoglycerate; 2-PG, 2-phosphoglycerate; PEP, phosphoenolpyruvate; 6-PG, 6-phosphogluconate; Ru-5-P, ribulose-5-phosphate; R-5-P, ribose-5-phosphate; S-7-P, sedoheptulose-7-phosphate; E-4-P, erythrose-4-phosphate; PRPP, phosphoribosyl pyrophosphate; Pyr, Pyruvate; Lac, Lactate; AcCoA, acetyl-CoA; Suc-CoA, succinyl-CoA; OAA, oxaloacetate; Glu, glutamic acid; 3-PHP, 3-phosphohydroxypyruvate; pSer, phosphoserine; Ser, serine; Gly, glycine; Met, methionine; SAM, S-adenosylmethionine; SAH, S-adenosylhomocysteine; Hcy, homocysteine; Cys, cysteine; γ-Glu-Cys, gamma glutamylcysteine; GSH, reduced glutathione; GSSG, oxidized glutathione. B and C, Effects of sgPRMT1 (B) and sgPRMT4 (C) on the cell death of MDA-MB-468. *, P < 0.05 versus sgCont. Differences were tested by two-way ANOVA using Fisher LSD test (n = 4). n.s., not significant.
Figure 4. Increased glucose biotransformation into fatty acid synthesis to potentiate chemoresistant in paclitaxel-resistant TNBC cells. A, Schematic diagram indicating conversion of 13C6-glucose towards 13C2-labeled acetyl-CoA (Ac-CoA) and malonyl-CoA (Mal-CoA) for fatty acid synthesis. OAA, oxaloacetate; ACLY, ATP-citrate lyase; ACC, acetyl-CoA carboxylase; Schematic diagram indicating the points of action of reagents. dmKG is a membrane-permeable analog of αKG. Orlistat and 2-Br-Pal are FASN and palmitoyltransferase inhibitors, respectively. B and C, Differences in the capacity for fatty acid synthesis in MDA-MB-468 cells (sgCont. vs. sgPRMT1; B), and MDA-MB-231 (parent vs. Ptx-R; C), respectively. Measurements of 13C-labeled palmitate were performed by LC/MS. Graphs are expressed as the mean ± SE (μmol/g protein). *, P < 0.05, versus the values in sgCont.-treated MDA-MB-468 in B (n = 8, unpaired Student t test), and the values in parental MDA-MB-231 (n = 8, unpaired Student t test; C). Fraction of labeling of the different mass isotopologs (m+n; n, number of 13C-labeled carbon atom). D, Effects of orlistat on Ptx-induced cell death in MDA-MB-468 cells. *, P < 0.05, compared with the Ptx- and orlistat-free controls. †, P < 0.05, compared with sgControl at each Ptx concentration. ‡, P < 0.05, compared with sgPRMT1 without Ptx. §, P < 0.05, compared with sgControl at each Ptx concentration. #, P < 0.05, compared with sgPRMT1 at each Ptx concentration. Data are presented as mean ± SE (n = 4; two-way ANOVA with Fisher LSD test). E, Effects of dmKG or 2-Br-Pal on sgPRMT1-induced cell death in MDA-MB-468 cells. Data express mean ± SE (n = 4). *, P < 0.05, compared with the Ptx-free control in sgCont.-treated cells. †, P < 0.05, compared with the Ptx-free control of sgPRMT1-treated cells. Differences were tested using one-way ANOVA with Fisher LSD test. F and G, Effects of orlistat (F) and dmKG (G) on Ptx-induced cell death in MDA-MB-231 cells. *, P < 0.05; †, P < 0.05; ‡, P < 0.05, compared with the orlistat-free, parental cells, and parental with orlistat, respectively (F) and dmKG-free control (G), respectively. Data are presented as the mean ± SE (n = 4; two-way ANOVA with Fisher LSD test). H, Effect of 2-Br-Pal on Ptx-induced cell death in MDA-MB-231 cells. *, P < 0.05 and †, P < 0.05 between the groups shown in the panel (n = 4, one-way ANOVA with Fisher LSD test). N.D., not detected; n.s., not significant.
Figure 4.
Increased glucose biotransformation into fatty acid synthesis to potentiate chemoresistant in paclitaxel-resistant TNBC cells. A, Schematic diagram indicating conversion of 13C6-glucose towards 13C2-labeled acetyl-CoA (Ac-CoA) and malonyl-CoA (Mal-CoA) for fatty acid synthesis. OAA, oxaloacetate; ACLY, ATP-citrate lyase; ACC, acetyl-CoA carboxylase; Schematic diagram indicating the points of action of reagents. dmKG is a membrane-permeable analog of αKG. Orlistat and 2-Br-Pal are FASN and palmitoyltransferase inhibitors, respectively. B and C, Differences in the capacity for fatty acid synthesis in MDA-MB-468 cells (sgCont. vs. sgPRMT1; B), and MDA-MB-231 (parent vs. Ptx-R; C), respectively. Measurements of 13C-labeled palmitate were performed by LC/MS. Graphs are expressed as the mean ± SE (μmol/g protein). *, P < 0.05, versus the values in sgCont.-treated MDA-MB-468 in B (n = 8, unpaired Student t test), and the values in parental MDA-MB-231 (n = 8, unpaired Student t test; C). Fraction of labeling of the different mass isotopologs (m+n; n, number of 13C-labeled carbon atom). D, Effects of orlistat on Ptx-induced cell death in MDA-MB-468 cells. *, P < 0.05, compared with the Ptx- and orlistat-free controls. †, P < 0.05, compared with sgControl at each Ptx concentration. ‡, P < 0.05, compared with sgPRMT1 without Ptx. §, P < 0.05, compared with sgControl at each Ptx concentration. #, P < 0.05, compared with sgPRMT1 at each Ptx concentration. Data are presented as mean ± SE (n = 4; two-way ANOVA with Fisher LSD test). E, Effects of dmKG or 2-Br-Pal on sgPRMT1-induced cell death in MDA-MB-468 cells. Data express mean ± SE (n = 4). *, P < 0.05, compared with the Ptx-free control in sgCont.-treated cells. †, P < 0.05, compared with the Ptx-free control of sgPRMT1-treated cells. Differences were tested using one-way ANOVA with Fisher LSD test. F and G, Effects of orlistat (F) and dmKG (G) on Ptx-induced cell death in MDA-MB-231 cells. *, P < 0.05; †, P < 0.05; ‡, P < 0.05, compared with the orlistat-free, parental cells, and parental with orlistat, respectively (F) and dmKG-free control (G), respectively. Data are presented as the mean ± SE (n = 4; two-way ANOVA with Fisher LSD test). H, Effect of 2-Br-Pal on Ptx-induced cell death in MDA-MB-231 cells. *, P < 0.05 and †, P < 0.05 between the groups shown in the panel (n = 4, one-way ANOVA with Fisher LSD test). N.D., not detected; n.s., not significant.
Figure 5. Effects of PRMT1-involving protein S-palmitoylation on PHGDH stability in MDA-MB-468 and paclitaxel-resistant MDA-MB-231. A, Schematic diagram of the ABE method for detecting protein S-palmitoylation. MMTS, S-methylmethane-thiosulfonate. S-Pal, S-palmitoylation; SA, streptavidin; HAM, hydroxylamine. B and C, Results of the ABE assay in MDA-MB-468 (B) and Ptx-R MDA-MB-231(C) cells, respectively. D and E, Reversibility of S-palmitoylation of PHGDH, FASN, and PRMT1 by a doxycycline (DOX)-mediated shRNA switching on-off system for PRMT1 expression (D). Results of ABE assay. The elute blotting indicated that the addition of DOX reduced and DOX-w/d recovered the S-palmitoylation of PHGDH and FASN (E). F and G, Knockout of PRMT1, but not PRMT4, enhances polyubiquitination of FLAG-tagged human PHGDH in Ptx-R MDA-MB-231 (F) and MDA-MB-468 (G). H, Effect of the PHGDH R20K mutants on their protein stability.
Figure 5.
Effects of PRMT1-involving protein S-palmitoylation on PHGDH stability in MDA-MB-468 and paclitaxel-resistant MDA-MB-231. A, Schematic diagram of the ABE method for detecting protein S-palmitoylation. MMTS, S-methylmethane-thiosulfonate. S-Pal, S-palmitoylation; SA, streptavidin; HAM, hydroxylamine. B and C, Results of the ABE assay in MDA-MB-468 (B) and Ptx-R MDA-MB-231(C) cells, respectively. D and E, Reversibility of S-palmitoylation of PHGDH, FASN, and PRMT1 by a doxycycline (DOX)-mediated shRNA switching on-off system for PRMT1 expression (D). Results of ABE assay. The elute blotting indicated that the addition of DOX reduced and DOX-w/d recovered the S-palmitoylation of PHGDH and FASN (E). F and G, Knockout of PRMT1, but not PRMT4, enhances polyubiquitination of FLAG-tagged human PHGDH in Ptx-R MDA-MB-231 (F) and MDA-MB-468 (G). H, Effect of the PHGDH R20K mutants on their protein stability.
Figure 6. Coordinated methylation of three enzymes correlates with human TNBC malignancy and progression. A, IHC of needle biopsy samples from a patient with TNBC with antibodies against PRMT1, PHGDH, mPHGDH (R54MMA), PFKFB3, mPFKFB3, (R131/134ADMA), PKM2, mPKM2 (R445/447ADMA), and FASN. A representative picture among 11 patients with TNBC is shown. a, A low-power image of the hematoxylin and eosin (H&E) staining slice collected from the biopsied specimen. The open bar indicates 2.5 mm. The square indicates the cancer site. b, Magnified images with pathological annotations. Yellow and white indicate the cancer cell nests and stromal regions, respectively. c–j, IHC analyses of the corresponding enzymes. k, IHC of the negative control (without primary antibody). Serial sections of 5 μm thickness were prepared. Scale bars in b–k, 250 μm. B, Representative images of IMS to determine the regional contents of metabolites in needle biopsy derived from a patient with TNBC. Serial or semiserial frozen sections that were adjacent to the slices in A were used. To visualize the free amino acid distributions, TAHS was used as a derivatization reagent (Gly-TAHS, Met-TAHS, and Glu-TAHS on the bottom panels). Images were captured in the same microscopic field as that of the serial frozen slices shown in A. Accordingly, the white and magenta lines indicate regions enriched in cancer cell nests and stromal regions, respectively. Pseudocolor bars indicate the apparent contents of metabolites, with red and blue representing high and low amounts, respectively. Scale bars, 200 μm.
Figure 6.
Coordinated methylation of three enzymes correlates with human TNBC malignancy and progression. A, IHC of needle biopsy samples from a patient with TNBC with antibodies against PRMT1, PHGDH, mPHGDH (R54MMA), PFKFB3, mPFKFB3, (R131/134ADMA), PKM2, mPKM2 (R445/447ADMA), and FASN. A representative picture among 11 patients with TNBC is shown. a, A low-power image of the hematoxylin and eosin (H&E) staining slice collected from the biopsied specimen. The open bar indicates 2.5 mm. The square indicates the cancer site. b, Magnified images with pathological annotations. Yellow and white indicate the cancer cell nests and stromal regions, respectively. c–j, IHC analyses of the corresponding enzymes. k, IHC of the negative control (without primary antibody). Serial sections of 5 μm thickness were prepared. Scale bars in b–k, 250 μm. B, Representative images of IMS to determine the regional contents of metabolites in needle biopsy derived from a patient with TNBC. Serial or semiserial frozen sections that were adjacent to the slices in A were used. To visualize the free amino acid distributions, TAHS was used as a derivatization reagent (Gly-TAHS, Met-TAHS, and Glu-TAHS on the bottom panels). Images were captured in the same microscopic field as that of the serial frozen slices shown in A. Accordingly, the white and magenta lines indicate regions enriched in cancer cell nests and stromal regions, respectively. Pseudocolor bars indicate the apparent contents of metabolites, with red and blue representing high and low amounts, respectively. Scale bars, 200 μm.
Figure 7. Nuclear immunostaining of PRMT1 and mPFKFB3 is augmented in TNBC cancer cells derived from non-pCR patients. A and B, FFPE IHC of PRMT1, mPFKFB3, and total PFKFB3 in four different patients with TNBC showing non-pCR (A) and in five different patients with TNBC showing pCR (B), respectively. Scale bars, 100 μm. C, Differences in the number of PRMT1- and mPFKFB3-positive nuclei in TNBC cancer cells between non-pCR and pCR patients. *, P < 0.05 versus non-pCR. The differences were examined by Welch t test. H&E, hematoxylin and eosin.
Figure 7.
Nuclear immunostaining of PRMT1 and mPFKFB3 is augmented in TNBC cancer cells derived from non-pCR patients. A and B, FFPE IHC of PRMT1, mPFKFB3, and total PFKFB3 in four different patients with TNBC showing non-pCR (A) and in five different patients with TNBC showing pCR (B), respectively. Scale bars, 100 μm. C, Differences in the number of PRMT1- and mPFKFB3-positive nuclei in TNBC cancer cells between non-pCR and pCR patients. *, P < 0.05 versus non-pCR. The differences were examined by Welch t test. H&E, hematoxylin and eosin.
Figure 8. Schematic diagram of metabolic rewiring mechanisms in drug-resistant breast cancer cells. Drug-sensitive cells have lower methylation levels of PFKFB3, PKM2, and PHGDH, increasing polyubiquitination of PFKFB3, PHGDH, and FASN to reduce influx from the glycolytic system into the serine synthesizing pathway (top). PRMT1 methylates PFKFB3, PKM2, and PHGDH to determine the fate of the carbon source for fatty acid synthesis to support chemoresistance in TNBC (bottom). Arginine methylation of PHGDH (R20/54) stabilizes the enzyme to enhance the serine synthetic pathway and de novo fatty acid synthesis through augmentation of αKG coupled with a PSAT1-involving reaction. Enhanced fatty acid synthesis sustains enzyme activity by S-palmitoylation of PHGDH and FASN through de novo synthesis of palmitate, promoting positive feedback between the serine synthetic pathway and fatty acid synthesis to acquire malignant traits in TNBC. Blockade of this feedback system using the PRMT1 inhibitor MS023 or S-palmitoyltransferase inhibitor 2-Br-Pal unlocks chemoresistance to paclitaxel.
Figure 8.
Schematic diagram of metabolic rewiring mechanisms in drug-resistant breast cancer cells. Drug-sensitive cells have lower methylation levels of PFKFB3, PKM2, and PHGDH, increasing polyubiquitination of PFKFB3, PHGDH, and FASN to reduce influx from the glycolytic system into the serine synthesizing pathway (top). PRMT1 methylates PFKFB3, PKM2, and PHGDH to determine the fate of the carbon source for fatty acid synthesis to support chemoresistance in TNBC (bottom). Arginine methylation of PHGDH (R20/54) stabilizes the enzyme to enhance the serine synthetic pathway and de novo fatty acid synthesis through augmentation of αKG coupled with a PSAT1-involving reaction. Enhanced fatty acid synthesis sustains enzyme activity by S-palmitoylation of PHGDH and FASN through de novo synthesis of palmitate, promoting positive feedback between the serine synthetic pathway and fatty acid synthesis to acquire malignant traits in TNBC. Blockade of this feedback system using the PRMT1 inhibitor MS023 or S-palmitoyltransferase inhibitor 2-Br-Pal unlocks chemoresistance to paclitaxel.

References

    1. Scott AR, Stoltzfus KC, Tchelebi LT, Trifiletti DM, Lehrer EJ, Rao P, et al. . Trends in cancer incidence in US adolescents and young adults, 1973–2015. JAMA Netw Open 2020;3:e2027738. - PMC - PubMed
    1. Spring LM, Gupta A, Reynolds KL, Gadd MA, Ellisen LW, Isakoff SJ, et al. . Neoadjuvant endocrine therapy for estrogen receptor-positive breast cancer: a systematic review and meta-analysis. JAMA Oncol 2016;2:1477–86. - PMC - PubMed
    1. Li S, Wu H, Huang X, Jian Y, Kong L, Xu H, et al. . BOP1 confers chemoresistance of triple-negative breast cancer by promoting CBP-mediated β-catenin acetylation. J Pathol 2021;254:265–78. - PubMed
    1. Broad RV, Jones SJ, Teske MC, Wastall LM, Hanby AM, Thorne JL, et al. . Inhibition of interferon-signalling halts cancer-associated fibroblast-dependent protection of breast cancer cells from chemotherapy. Br J Cancer 2021;124:1110–20. - PMC - PubMed
    1. Saatci O, Kaymak A, Raza U, Ersan PG, Akbulut O, Banister CE, et al. . Targeting lysyl oxidase (LOX) overcomes chemotherapy resistance in triple negative breast cancer. Nat Commun 2020;11:2416. - PMC - PubMed

Publication types