. 2024 Feb 21:7:0313.
doi: 10.34133/research.0313. eCollection 2024.

The FTO Mediated N6-Methyladenosine Modification of DDIT4 Regulation with Tumorigenesis and Metastasis in Prostate Cancer

Affiliations

The FTO Mediated N6-Methyladenosine Modification of DDIT4 Regulation with Tumorigenesis and Metastasis in Prostate Cancer

Yue Zhao et al. Research (Wash D C). .

Abstract

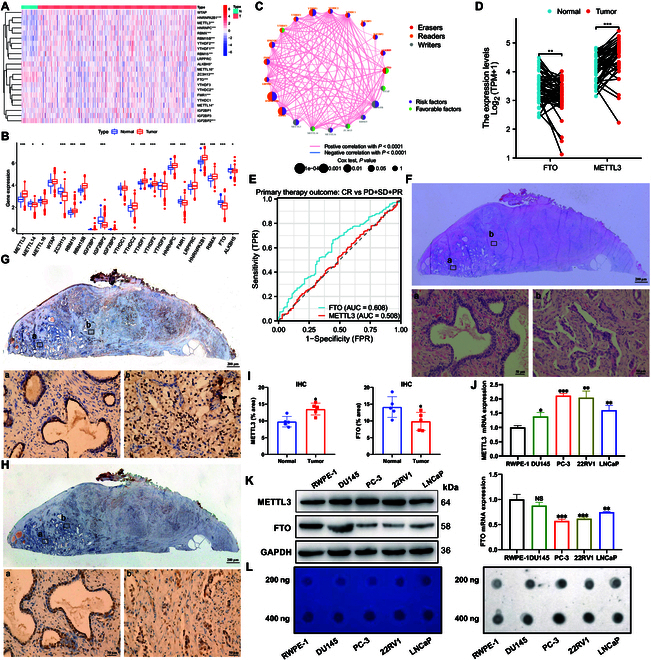
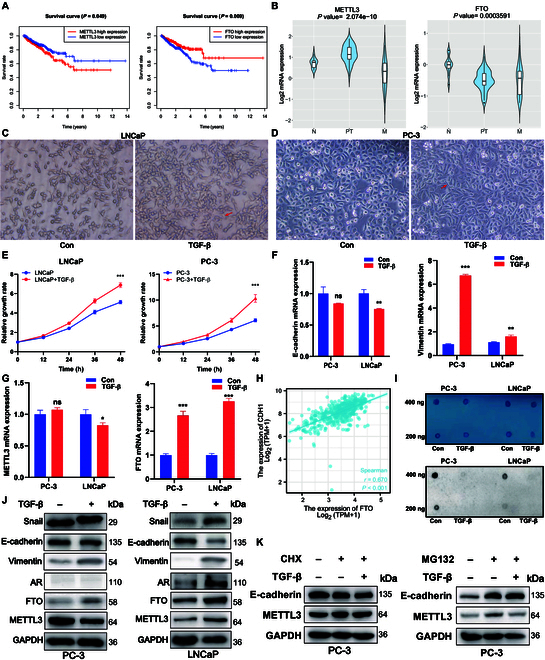
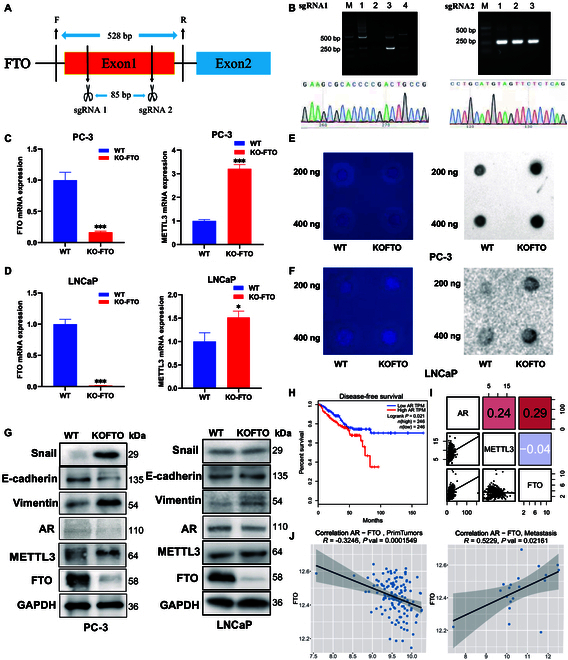
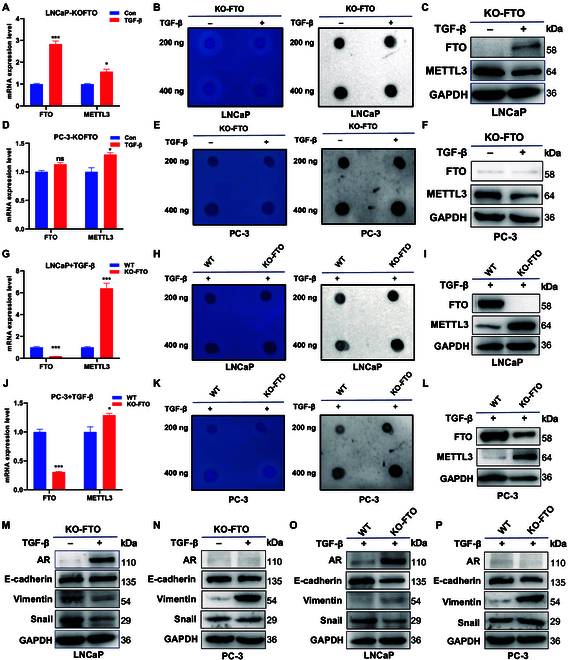
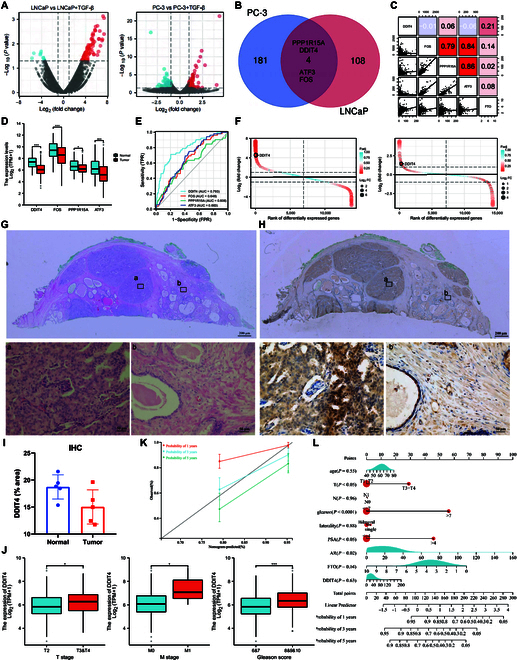
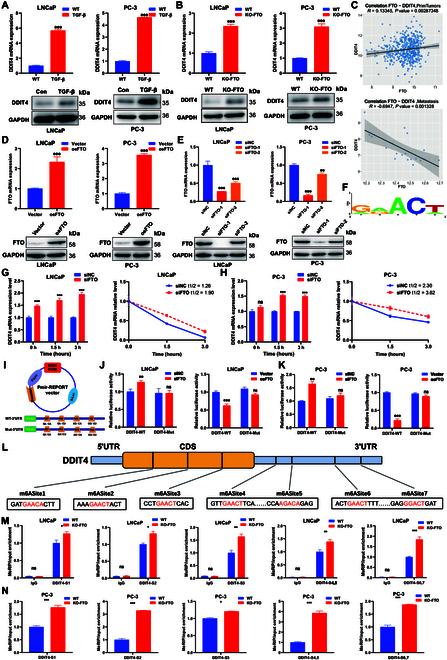
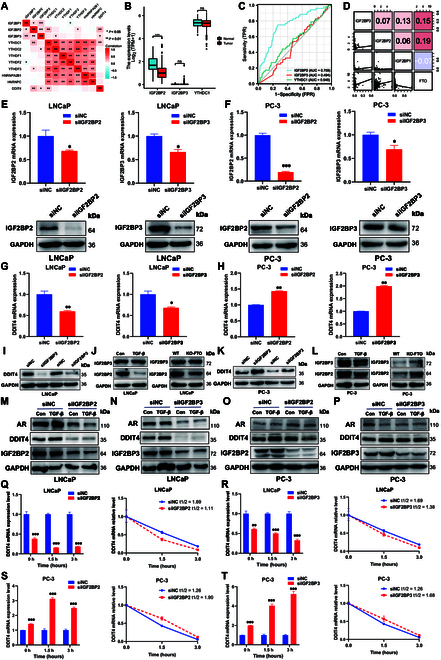
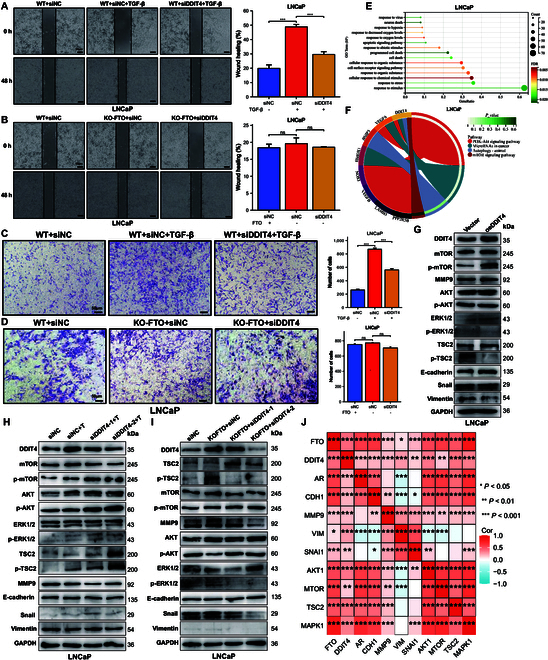
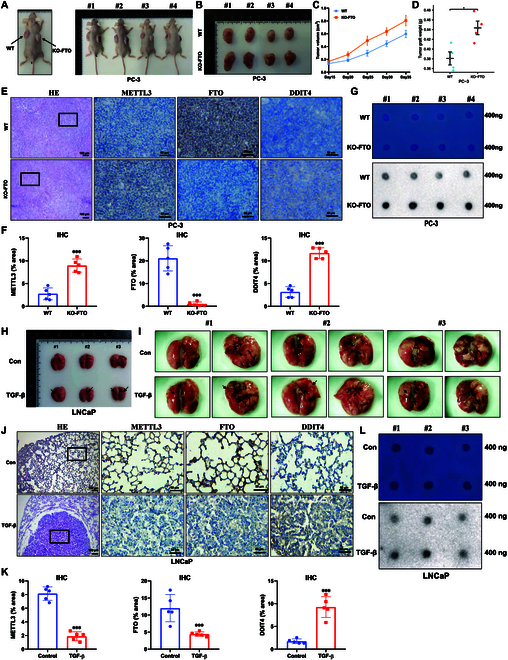
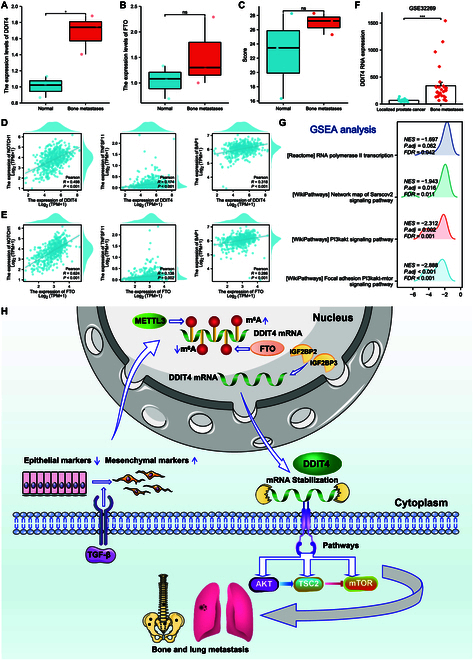
The progression of numerous malignancies has been linked to N6-methyladenosine (m6A) alteration. However, the opposite trend of m6A levels in the development and metastasis of cancer has not been reported. This study aimed to evaluate the biological function and mechanism of fat mass and obesity-associated protein (FTO) in regulating m6A modification in prostate cancer development and epithelial-mesenchymal transition (EMT). An EMT model of LNCaP and PC-3 cells was established with transforming growth factor-β treatment, and FTO knockout cell line was established in prostate cancer cells using the CRISPR/Cas9 gene editing technology. The level of m6A modification in tumor tissues was higher than that in normal prostate tissues; m6A levels were decreased after EMT. FTO deletion increased m6A expression and enhanced PC-3 cell motility, invasion, and EMT both in vitro and in vivo. RNA sequencing and functional investigations suggested that DDIT4, a novel EMT target gene, plays a role in m6A-regulated EMT, which was recognized and stabilized by the m6A effector IGF2BP2/3. Decreased FTO expression was an independent indicator of worse survival, and the level of DDIT4 was considerably elevated in patients with bone metastasis. Thus, this study revealed that the m6A demethylase FTO can play different roles in prostate cancer as a regulator of EMT and an inhibitor of m6A modification. Moreover, DDIT4 can be suggested as a possible biomarker for prostate cancer metastasis prediction.


Conflict of interest statement

Competing interests: The authors declare that they have no competing interests.

Figures

Fig. 1.
Fig. 1.
METTL3 and FTO regulate the m6A level in prostate cancer. (A) Heatmap of differentially expressed m6A regulators. (B) RNA expression of m6A regulators in tumor and normal tissues. (C) Protein–protein interactions among m6A regulators. The circle size represents the effect of each regulator on the prognosis. Green dots in the circle, risk factors of prognosis; large dots in the circle, protective factors of prognosis. (D) Paired expression level of METTL3 and FTO in prostate cancer and tumor-adjacent tissues. (E) ROC curve of FTO and METTL3 predicted the primary therapy outcome. (F) H&E staining results of prostate cancer and tumor-adjacent tissues. Representative images of tumor-adjacent tissues are shown in (a) and those of tumor tissues are shown in (b). (G) IHC (METTL3)-stained paraffin-embedded sections obtained from patients with prostate cancer. Representative images of tumor-adjacent tissues are shown in (a) and those of tumor tissues are shown in (b). (H) IHC (FTO)-stained paraffin-embedded sections obtained from patients with prostate cancer. Representative images of tumor-adjacent tissues are shown in (a) and those of tumor tissues are shown in (b). (I) Quantitative IHC analysis of METTL3 and FTO. (J) RNA expression of METTL3 and FTO was measured using qRT-PCR. (K) Protein expression of METTL3 and FTO was measured using western blot. (L) Global m6A RNA level was measured via m6A dot blot assays. Methylene blue stain served as the loading control.
Fig. 2.
Fig. 2.
Construction of an EMT model for prostate cancer to verify change in the m6A level. (A) Kaplan–Meier survival curves of DFS based on METTL3 and FTO. (B) Expression level of METTL3 and FTO in normal tissues, primary tumors, and metastatic tissues. (C) Phenotypic changes in LNCaP prostate cancer cells treated with TGF-β. (D) Phenotypic changes in PC-3 prostate cancer cells treated with TGF-β. (E) Cell proliferation capacity changes in prostate cancer cells treated with TGF-β. (F) mRNA level of vimentin and CDH1 was measured using qRT-PCR. (G) mRNA level of METTL3 and FTO was measured using qRT-PCR. (H) Correlation curve of CDH1 and FTO expression levels. (I) Global m6A RNA level was measured via m6A dot blot assays. (J) Protein level of EMT markers and m6A regulators was measured using western blot analysis. (K) PC-3 cells were pretreated with CHX or MG-132 for 6 h and then further treated with or without 10 ng/ml TGF-β for 48 h. METTL3 expression was then detected using western blot analysis.
Fig. 3.
Fig. 3.
EMT in prostate cancer cells is regulated by FTO levels. (A) Schematic diagram of the CRISPR/Cas9-mediated deletion of FTO. (B) Identification of FTO deletion clones via sequencing. (C and D) FTO expression level was significantly decreased and MELLT3 expression level was significantly increased in FTO knockout cells, as demonstrated using qRT-PCR and (E and F) m6A dot blot analysis. (G) Protein level of EMT markers and m6A regulators was measured using western blot analysis. (H) Kaplan–Meier survival curves of DFS based on AR. (I) Heatmap of AR correlation with FTO and METTL3. (J) Correlation between AR and FTO expression in primary prostate cancer and metastatic prostate cancer.
Fig. 4.
Fig. 4.
m6A level is regulated by FTO expression in EMT cells. (A) mRNA, (B) m6A, and (C) protein levels were detected in FTO knockout LNCaP cells treated with or without 10 ng/ml TGF-β for 48 h. (D) mRNA, (E) m6A, and (F) protein levels were detected in FTO knockout PC-3 cells treated with or without 10 ng/ml TGF-β for 48 h. (G) mRNA, (H) m6A, and (I) protein levels were detected in wild-type and FTO knockout LNCaP cells both treated with 10 ng/ml TGF-β for 48 h. (J) mRNA, (K) m6A, and (L) protein levels were detected in wild-type and FTO knockout PC-3 cells both treated with 10 ng/ml TGF-β for 48 h. (M) Protein level of EMT markers was detected in FTO knockout LNCaP cells and (N) PC-3 cells treated with or without 10 ng/ml TGF-β for 48 h. (O) Protein level of EMT markers was detected in wild-type and FTO knockout LNCaP cells and (P) PC-3 cells both treated with 10 ng/ml TGF-β for 48 h.
Fig. 5.
Fig. 5.
Identification of EMT-regulated genes in prostate cancer cells. (A) RNA-seq identified DEGs in EMT cells compared with wild-type cells. (B) Venn diagram summarized the common DEGs in the 2 prostate cancer cell lines. (C) Correlation of RNA expression levels between 4 DEGs and FTO. (D) RNA expression level of 4 DEGs in tumor-adjacent tissues and cancer tissues. (E) ROC curve of 4 DEGs to distinguish normal and prostate cancer tissues. (F) Ranking map of DEGs. (G) H&E staining results of prostate cancer and tumor-adjacent tissues. Representative images of tumor tissues are shown in (a) and those of tumor-adjacent tissues are shown in (b). (H) IHC (DDIT4)-stained paraffin-embedded sections obtained from patients with prostate cancer. Representative images of tumor tissues are shown in (a) and those of tumor adjacent tissues are shown in (b). (I) Quantitative IHC analysis of DDIT4. (J) Expression level of DDIT4 in different clinical groups. (K) One-, 3 -, and 5-year PFS nomograms for DDIT4. (L) The Cox method was used to construct a nomogram for prognostic evaluation.
Fig. 6.
Fig. 6.
DDIT4 is involved in m6A-regulated EMT in prostate cancer cells. (A) mRNA and protein levels of DDIT4 were up-regulated in both EMT and (B) FTO knockout cells. (C) Correlation between DDIT4 and FTO expression in primary prostate cancer and metastatic prostate cancer. (D) FTO overexpression in LNCaP and PC-3 cells. (E) FTO silencing reduced FTO expression level. (F) Predominant consensus motif was detected using the SRAMP database. (G) mRNA half-lives were estimated after the indicated actinomycin D treatment in FTO silencing LNCaP and (H) PC-3 cells. (I) Dual fluorescent vector ligation and site-specific mutation map. (J and K) Relative luciferase level of wild-type DDIT4, but not of the mutated gene, was significantly increased in FTO silencing LNCaP and PC-3 cells; the opposite results were observed in the FTO overexpression group. (L) Schematic representation of the location of DDIT4 m6A motif sites. (M) FTO knockout in LNCaP cells increased the level of DDIT4 m6A modification. (N) FTO knockout in PC-3 cells increased the level of DDIT4 m6A modification.
Fig. 7.
Fig. 7.
Screening for “readers” involved in regulating the target gene DDIT4. (A) Heat map of the correlation between the expression level of m6A “readers” and DDIT4. (B) RNA expression level of 3 “readers” in tumor-adjacent tissues and cancer tissues. (C) ROC curve of 3 “readers” to distinguish normal and prostate cancer tissues. (D) Correlation of RNA expression level between IGF2BPs and DDIT4. (E) mRNA and protein levels of IGF2BP2 and IGF2BP3 were decreased after IGF2BP2 and IGF2BP3 silencing in LNCaP and (F) PC-3 cells. (G) RNA expression level of DDIT4 was decreased after IGF2BP2/3 silencing in LNCaP cells. (H) RNA expression level of DDIT4 was increased after IGF2BP2/3 silencing in PC-3 cells. (I) Protein expression level of DDIT4 was decreased after IGF2BP2/3 silencing in LNCaP cells. (J) Protein expression level of IGF2BP2/3 after treatment with TGF-β or FTO knockout in LNCaP cells. (K) Protein expression level of DDIT4 was increased after IGF2BP2/3 silencing in PC-3 cells. (L) Protein expression level of IGF2BP2/3 after treatment with TGF-β or FTO knockout in PC-3 cells. (M) Protein expression was measured using western blot analysis after pretransfection with siNC or si-IGF2BP2 (N)/si-IGF2BP3 for 12 h. LNCaP and (O and P) PC-3 cells were further treated with or without 10 ng/ml TGF-β for 48 h. (Q) mRNA half-lives were estimated after the indicated actinomycin D treatment in siIGF2BP2/ (R) siIGF2BP3 LNCaP and (S and T) PC-3 cells.
Fig. 8.
Fig. 8.
Effect of DDIT4 expression level on cell biological characteristics in LNCaP cells. (A) Wound-healing assays were performed to determine the effect of TGF-β and siDDIT4 and (B) that of FTO knockout and siDDIT4 on LNCaP cells. (C) Transwell assays were performed to determine the effect of TGF-β and siDDIT4 and (D) that of FTO knockout and siDDIT4 on LNCaP cells. (E) Top 15 BP terms, including DDIT4, enriched in LNCaP cells. (F) KEGG pathway genes, including DDIT4, enriched in LNCaP cells. (G) Protein expression of genes in the PI3K-AKT-mTOR pathway was measured using western blot analysis after DDIT4 overexpression. (H) Protein expression of genes in the PI3K-AKT-mTOR pathway was measured using western blot analysis after siDDIT4 and TGF-β treatment. (I) Protein expression of genes in the PI3K-AKT-mTOR pathway was measured using western blot analysis after siDDIT4 in FTO knockout cells. (J) Correlation analysis among FTO, DDIT4, and AR, and the expression levels of pathway genes and EMT genes.
Fig. 9.
Fig. 9.
TGF-β treatment and FTO knockout enhances tumor growth and metastasis in vivo. (A) FTO knockout and wild-type PC-3 cells were injected into the flanks of nude mice; the representative mice are presented. (B) The treated BALB/c nude mice were sacrificed for their xenografts, and the tumor size was measured using a ruler. (C) Tumor growth curve of xenografts was plotted in the wild-type and FTO knockout groups using a Vernier caliper. (D) Tumor weight was measured in wild-type and FTO knockout groups. (E) H&E and IHC staining micrographs of the protein levels in tumor xenografts. (F) Quantitative IHC analysis of METTL3, FTO, and DDIT4 after FTO knockout. (G) m6A level was measured in wild-type and FTO knockout groups. (H and I) LNCaP wild-type cells and LNCaP cells treated with TGF-β were injected into nude mice via tail vein injection. Representative images of metastatic lung tumors. (J) H&E and IHC staining micrographs of the protein levels in lung tissues. (K) Quantitative IHC analysis of METTL3, FTO, and DDIT4 after treatment with TGF-β. (L) m6A level was measured in the wild-type and EMT groups.
Fig. 10.
Fig. 10.
FTO and DDIT4 are involved in prostate cancer bone metastasis. (A) RNA expression level of DDIT4 and (B) FTO in the bone metastasis and control groups. (C) TPSA level in the bone metastasis and control groups. (D) Correlation analysis between the expression level of DDIT4 and bone metastasis markers. (E) Correlation analysis between the expression level of FTO and bone metastasis markers. (F) RNA expression level of DDIT4 in the GSE32269 dataset. (G) Pathway enrichment of DDIT4 in the GSE32269 dataset. (H) All findings in this study are depicted as a schematic diagram.

Similar articles

Cited by

References

    1. Siegel RL, Miller KD, Fuchs HE, Jemal A. Cancer statistics, 2022. CA Cancer J Clin. 2022;72(1):7–33. - PubMed
    1. Potosky AL, Miller BA, Albertsen PC, Kramer BS. The role of increasing detection in the rising incidence of prostate cancer. JAMA. 1995;273(7):548–552. - PubMed
    1. Kensler KH, Pernar CH, Mahal BA, Nguyen PL, Trinh QD, Kibel AS, Rebbeck TR. Racial and ethnic variation in PSA testing and prostate cancer incidence following the 2012 USPSTF recommendation. J Natl Cancer Inst. 2021;113(6):719–726. - PMC - PubMed
    1. Liotta LA. Tumor invasion and metastases-role of the extracellular matrix: Rhoads memorial award lecture. Cancer Res. 1986;46(1):1–7. - PubMed
    1. Heinlein CA, Chang C. Androgen receptor in prostate cancer. Endocr Rev. 2004;25(2-3):276–308. - PubMed

LinkOut - more resources