. 2024 Feb 7:15:1331731.
doi: 10.3389/fimmu.2024.1331731. eCollection 2024.

ISG15/USP18/STAT2 is a molecular hub regulating IFN I-mediated control of Dengue and Zika virus replication

Affiliations

ISG15/USP18/STAT2 is a molecular hub regulating IFN I-mediated control of Dengue and Zika virus replication

Constanza Eleonora Espada et al. Front Immunol. .

Abstract

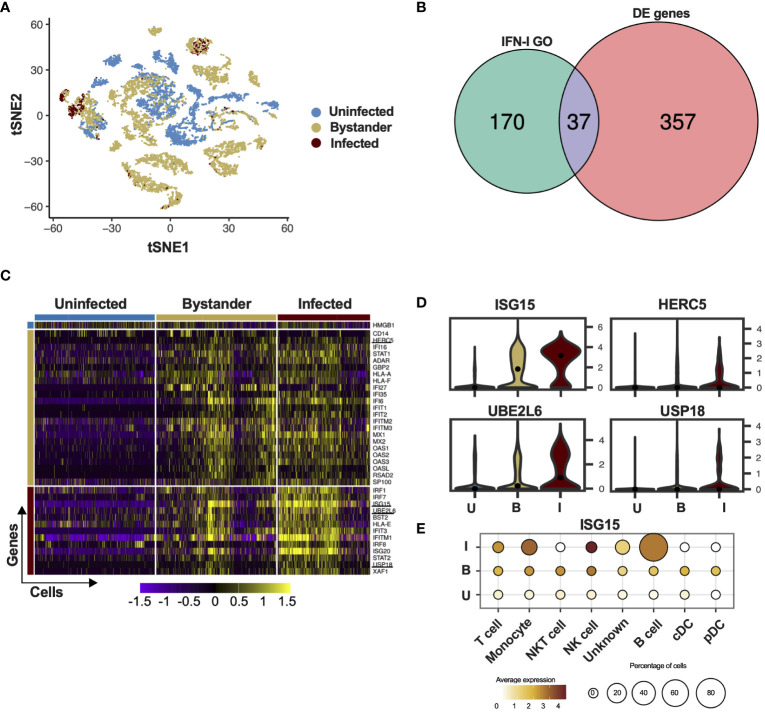
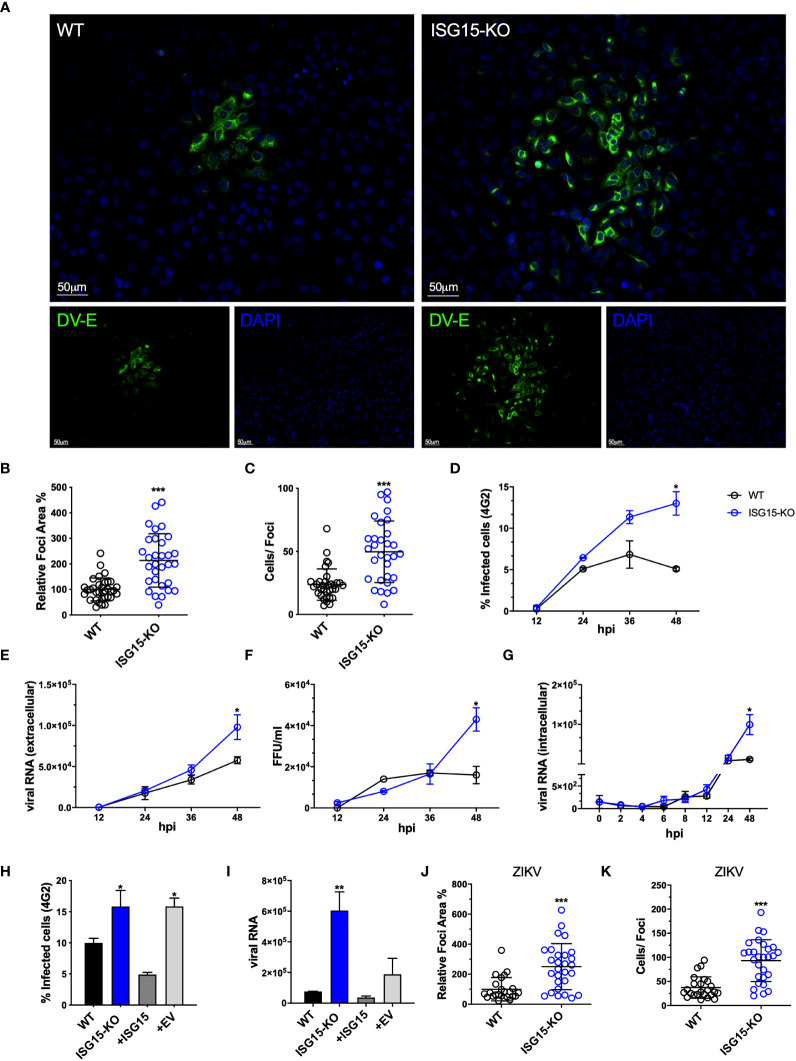
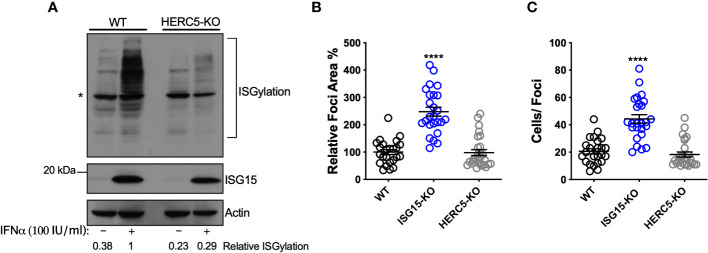
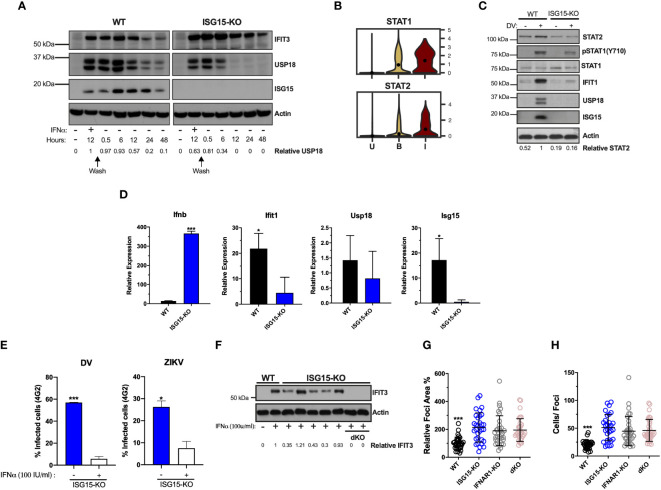
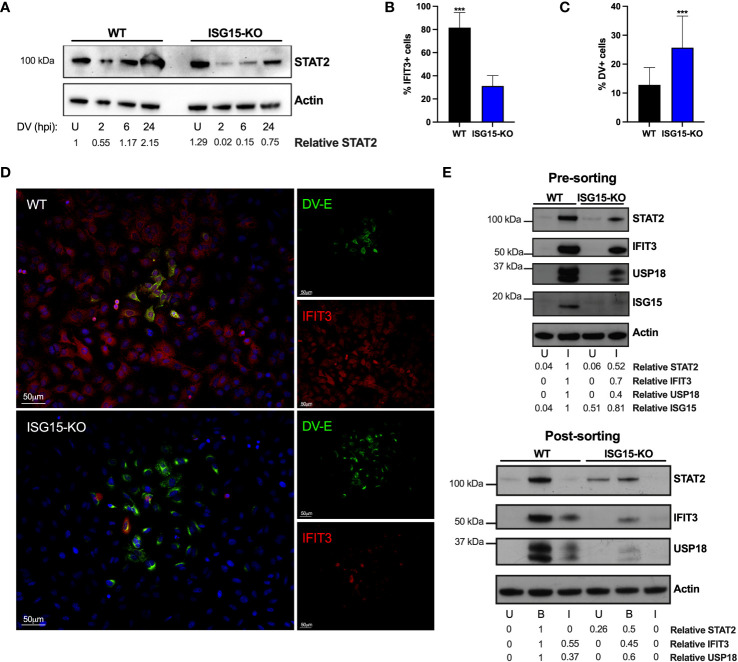
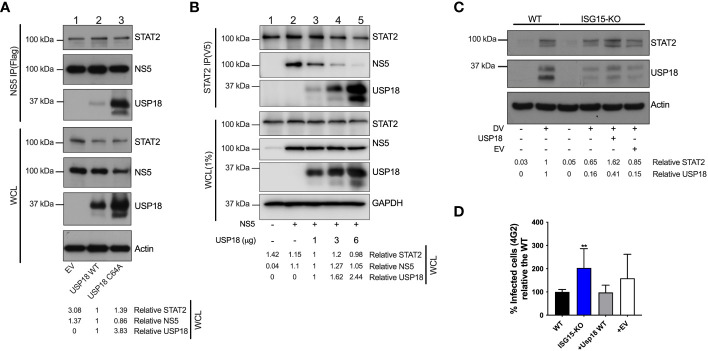
The establishment of a virus infection is the result of the pathogen's ability to replicate in a hostile environment generated by the host's immune system. Here, we found that ISG15 restricts Dengue and Zika viruses' replication through the stabilization of its binding partner USP18. ISG15 expression was necessary to control DV replication driven by both autocrine and paracrine type one interferon (IFN-I) signaling. Moreover, USP18 competes with NS5-mediated STAT2 degradation, a major mechanism for establishment of flavivirus infection. Strikingly, reconstitution of USP18 in ISG15-deficient cells was sufficient to restore the STAT2's stability and restrict virus growth, suggesting that the IFNAR-mediated ISG15 activity is also antiviral. Our results add a novel layer of complexity in the virus/host interaction interface and suggest that NS5 has a narrow window of opportunity to degrade STAT2, therefore suppressing host's IFN-I mediated response and promoting virus replication.

Keywords: Dengue virus; ISG15; ISGylation; USP18; Zika virus; antiviral response; immune evasion; type one interferon.


Conflict of interest statement

The authors declare that the research was conducted in the absence of any commercial or financial relationships that could be construed as a potential conflict of interest.

Figures

Figure 1
Figure 1
ISG15 is expressed in DV-infected PBMC. (A) tSNE was used to visualize the single-cell global transcriptome data. Blue dots represent uninfected cells, derived from healthy donors. Beige dots represent bystander cells and red dots represent infected cells, both derived from patients infected with DV. (B) Differential expression of ISGs in PBMCs of patients infected with DV. The Gene Ontology term “type one interferon” was used to filter the results from the single-cell RNA sequencing. (C) Single cell ISG expression variability in uninfected, bystander and infected. ISGylation related genes are underlined. Blue bar represents uninfected cells, derived from healthy donors. Beige bar represents bystander cells and red bar represents infected cells, both derived from patients infected with DV. (D) Violin plot representing the expression of ISGylation family members in uninfected [U], bystander [B] and infected [I] PMBC. The adjusted p-values are 1.82e-62 for ISG15 (I); 6.91e-25 for UBE2L6 (I); 1.05e-23 for USP18 (I) and 5.05e-217 for HERC5 (B). (E) Expression of ISG15 in DV infected PMBCs. Size is proportional to the percentage of infected cells in each cell type. Color intensity represents ISG15 average expression.
Figure 2
Figure 2
ISG15 restricts DV and ZIKV replication. (A) A549 WT and ISG15 KO were infected with 20 DV PFUs. At 36 hpi cells were fixed, permeabilized and stained for the flavivirus E protein using 4G2 antibody. Displayed images were acquired with a Leica DMI6000 B microscope. (B, C) DV relative foci area (B) and the number of infected cells per foci (C) quantified by ImageJ software and analyzed using Welch’s t test. Error bars represent mean ± SD. Results are representative of three independent experiments. (D–F) Multiple-step DV growth curve in A549 cells. Cells were infected at an MOI of 0.01 and harvested at multiple time points. Shown is the percentage of cells infected as measured by E protein staining (4G2+) (D), extracellular viral RNA relative expression by RT-qPCR (E) and titration by focus forming assay (FFA) (F). Statistical analyses were conducted using unpaired t tests. Error bars represent mean ± SD. Results are representative of three independent experiments. (G) Changes in viral RNA relative expression over time following binding of DV to A549 WT and ISG15 KO cells at 4°C and analyzed using unpaired t test. Error bars represent mean ± SD. Results are representative of two independent experiments. (H, I) Complementation of A549 ISG15 KO cells with ectopically expressed ISG15. Cells were infected at an MOI of 0.01 and at 36 hpi cells were fixed and processed for measurement by flow cytometry. Shown is the percentage of infected cells as measured by E protein staining (4G2+) (H) and viral RNA relative expression by RT-qPCR (I). One-way ANOVA was used to analyze these experiments. EV: empty vector. Error bars represent mean ± SD. Results are representative of two independent experiments. (J, K) A549 WT and ISG15 KO were infected with 20 ZIKV PFUs. At 36 hpi cells were fixed, permeabilized and stained for the flavivirus E protein. ZIKV relative foci area (J) and number of infected cells per foci (I), quantified by ImageJ software and analyzed using unpaired t test with Welch’s correction. Images were acquired with an Olympus IX83 inverted microscope. Error bars represent mean ± SD. Results are representative of three independent experiments. Statistical analyses were performed using Prism 8 (GraphPad Software). p values *<0.05; **<0.01; ***<0.001.
Figure 3
Figure 3
ISGylation is not sufficient to restrict DV spread. (A) ISGylation profile of A549 WT and HERC5 KO cells by Western blot. Cells were primed with IFNα2b (100 IU/ml) for 24 h and cell lysates were analyzed with an ISG15 antibody. (*) indicates antibody unspecific band. (B, C) A549 cells were infected with 20 DV PFUs. At 36 hpi cells were fixed, permeabilized and stained for the flavivirus E protein. DV relative foci area (B) and the number of infected cells per foci (C) quantified by ImageJ software and analyzed by one-way ANOVA. Images were acquired with an Olympus IX83 inverted microscope. Error bars represent mean ± SD. Results are representative of three or more independent experiments. Statistical analyses were performed using Prism 8 (GraphPad Software). p values ****<0.0001.
Figure 4
Figure 4
ISG15 is necessary for autocrine IFNAR1-mediated control of DV replication. (A) A549 cells were primed with IFNα2b (100 IU/ml) for 12 h, washed three times with DPBS and allowed to rest. Cells were harvested at the indicated time point and cell lysates were analyzed by Western blot with the corresponding antibodies. Results are representative of two independent experiments. (B) Violin plot representing the expression of STAT1 and STAT2 in uninfected [U], bystander [B] and infected [I] PMBC. Adjusted p-values, STAT1 p=0 and STAT2 P =1.34e-22(I) (C, D) A549 cells were infected with 20 DV PFU. At 36 hpi, cells were harvested, cell lysates were analyzed by immunoblotting (C) and the indicated mRNA transcripts were quantified by RT-qPCR (D). Error bars represent mean ± SD. Results are representative of two independent experiments. Data was analyzed by unpaired t test. (E) A549 ISG15 KO cells were primed with IFNα2b (100 IU/ml) for 12 h, washed three times with DPBS and allowed to rest 12 h before infection with DV or ZIKV at an MOI of 0.1. Shown is the percentage of cells infected at 36 hpi, as measured by E protein staining (4G2+). Error bars represent mean ± SD. Results are representative of three independent experiments. Data was analyzed using unpaired t test. (F) Different clones of A549 ISG15 KO and ISG15/IFNAR double KO cells were immunoblotted for IFIT3 after 24 h treatment with IFNα2b (100 IU/ml). (G, H) A549 cells were infected with 20 DV PFUs. At 36 hpi cells were fixed, permeabilized and stained for the flavivirus E protein. DV relative foci area (G) and number of infected cells per foci (H) quantified by ImageJ software and analyzed by one-way ANOVA. Images were acquired with an Olympus IX83 inverted microscope. Error bars represent mean ± SD. Results are representative of three independent experiments. Statistical analyses were performed using Prism 8 (GraphPad Software). p values *<0.05; ***<0.001.
Figure 5
Figure 5
ISG15 counteracts DV IFN-I evasion. (A) A549 WT and ISG15 KO were infected with 20 DV PFU. Cells were harvested at the indicated time points after infection (hpi) and cell lysates were analyzed by Western blot using STAT2 and Actin antibodies. (B–D) A549 WT and ISG15 KO immunofluorescence assay (IFA) 36 hpi for cellular IFIT3 and flavivirus E protein expression (D). Percentage of IFIT3 (B) and DV (C) positive cells per foci were quantified by ImageJ software and analyzed using unpaired t test with Welch’s correction when appropriate. Displayed images were acquired with a Leica DMI6000 B microscope. (E) A549 cells were infected with DV at MOI 0.01. At 36 hpi, cells were fixed, permeabilized and stained for flavivirus E protein. Cell lysates were analyzed by Western blot with the indicated antibodies before (upper panel) and after (bottom panel) cells were sorted by fluorescence-activated cell sorting (FACS) based on E protein expression. U, uninfected; B, bystander; I, infected. Error bars represent mean ± SD. Results are representative of two independent experiments. Statistical analyses were performed using Prism 8 (GraphPad Software). p values ***<0.001.
Figure 6
Figure 6
USP18 expression displaces NS5 from STAT2 and overcomes ISG15 deficiency. (A) Flag-tag immunoprecipitation (IP) assay and Western blot analysis of HEK293 ISG15 KO cells transfected with ZIKV NS5-FLAG, human USP18 WT, human USP18 C64A mutant or the empty vector (pcDNA3.1) plasmids, followed by IFNα2b (100 IU/ml) priming for 18 h. WCL, whole cell lysate. Results are representative of three independent experiments. (B) STAT2(V5) IP assay and Western blot analysis of HEK293 ISG15 KO cells transfected with the indicated plasmids, followed by IFNAα2b (100 IU/ml) priming for 18 h. Results are representative of three independent experiments. (C, D) Complementation with USP18 in A549 ISG15 KO cells. Cells were stably transfected with human USP18 or the empty vector and infected with DV at an MOI of 0.01. At 36 hpi, cells were harvested and cell lysates were analyzed by Western blot with the corresponding antibodies (C). Percentage of cells infected as measured by E protein staining (D). Error bars represent mean ± SD. Results are representative of two independent experiments. Statistical analyses were conducted using Mann-Whitney’s test in Prism 8 (GraphPad Software). p value **<0.01 (D). EV, empty vector.

Similar articles

Cited by

References

    1. Mansur DS, Smith GL, Ferguson BJ. Intracellular sensing of viral DNA by the innate immune system. Microbes Infect (2014) 16:1002–12. doi: 10.1016/j.micinf.2014.09.010 - DOI - PubMed
    1. Gebhardt A, Laudenbach BT, Pichlmair A. Discrimination of self and non-self ribonucleic acids. J Interferon Cytokine Res (2017) 37:184–97. doi: 10.1089/jir.2016.0092 - DOI - PMC - PubMed
    1. Schoggins JW. Interferon-stimulated genes: What do they all do? Annu Rev Virol (2019) 6:567–84. doi: 10.1146/annurev-virology-092818-015756 - DOI - PubMed
    1. García-Sastre A. Ten strategies of interferon evasion by viruses. Cell Host Microbe (2017) 22:176–84. doi: 10.1016/j.chom.2017.07.012 - DOI - PMC - PubMed
    1. Pierson TC, Diamond MS. The emergence of Zika virus and its new clinical syndromes. Nature (2018) 560:573–81. doi: 10.1038/s41586-018-0446-y - DOI - PubMed

Publication types