

Metabolomics unveils the exacerbating role of arachidonic acid metabolism in atherosclerosis
- PMID: 38384498
- PMCID: PMC10879346
- DOI: 10.3389/fmolb.2024.1297437
Metabolomics unveils the exacerbating role of arachidonic acid metabolism in atherosclerosis
Abstract
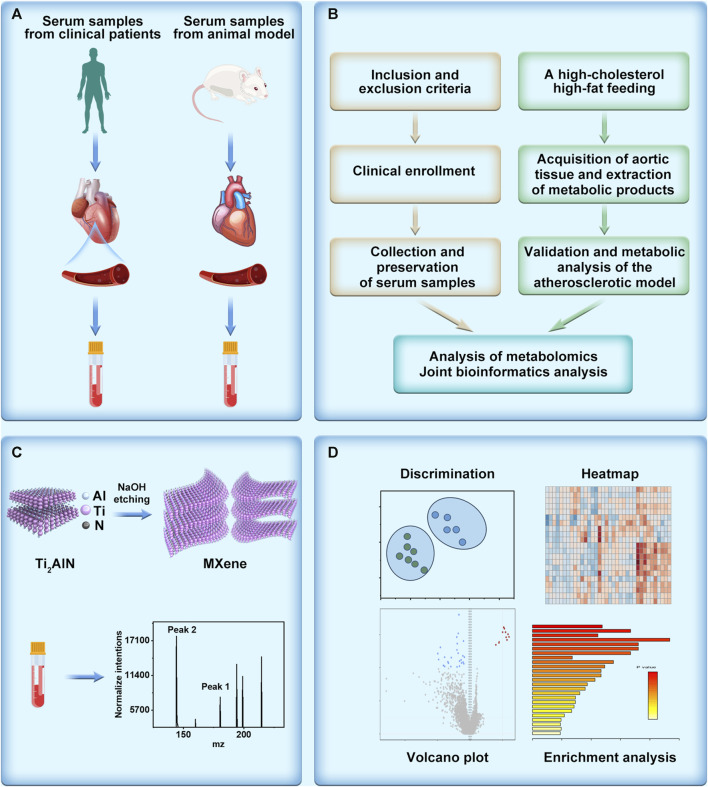
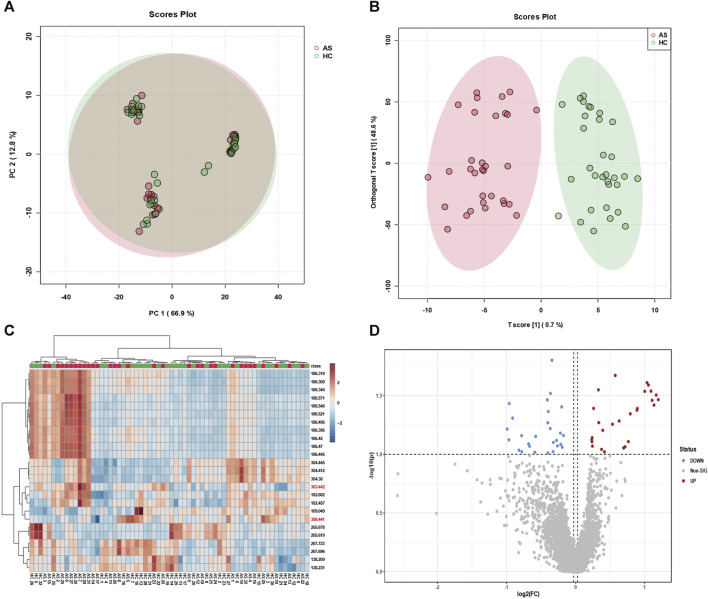
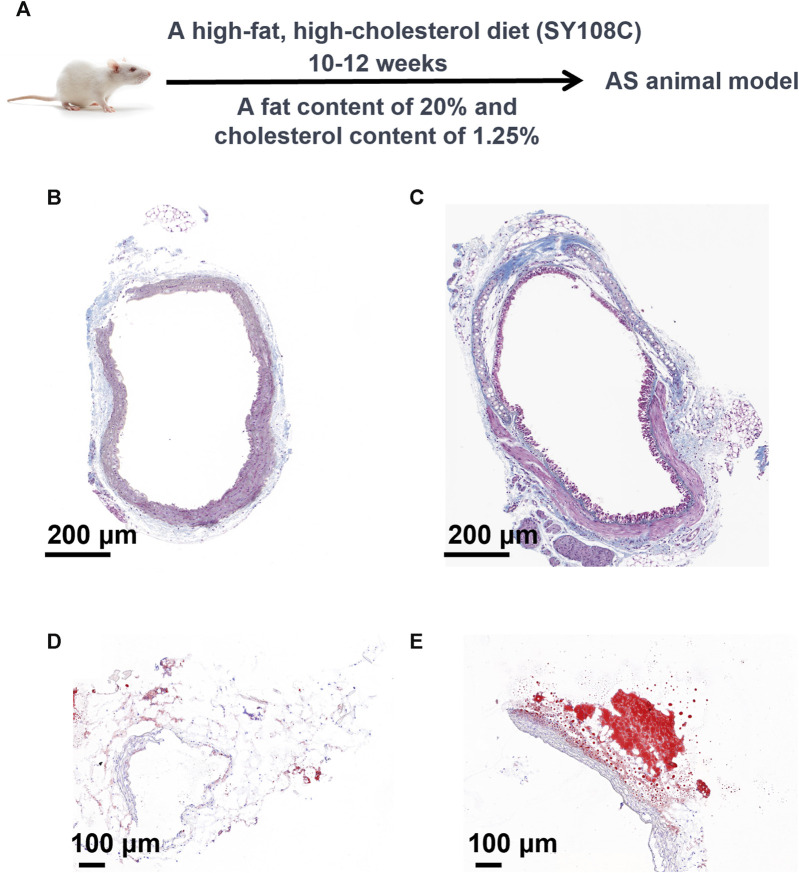
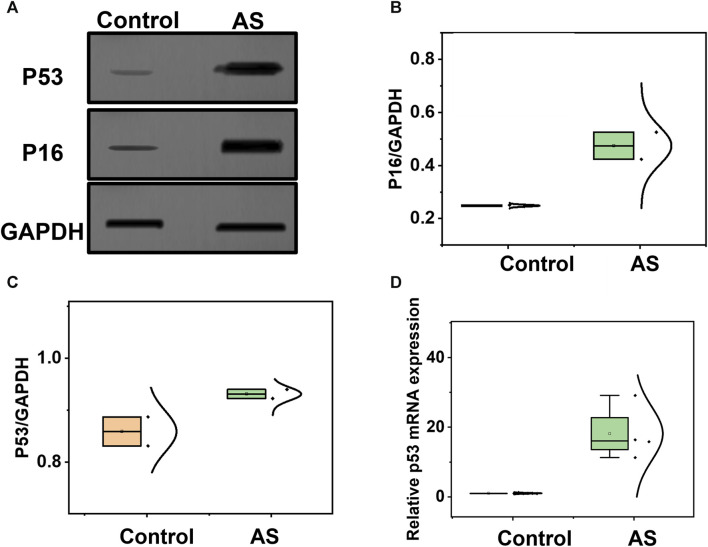
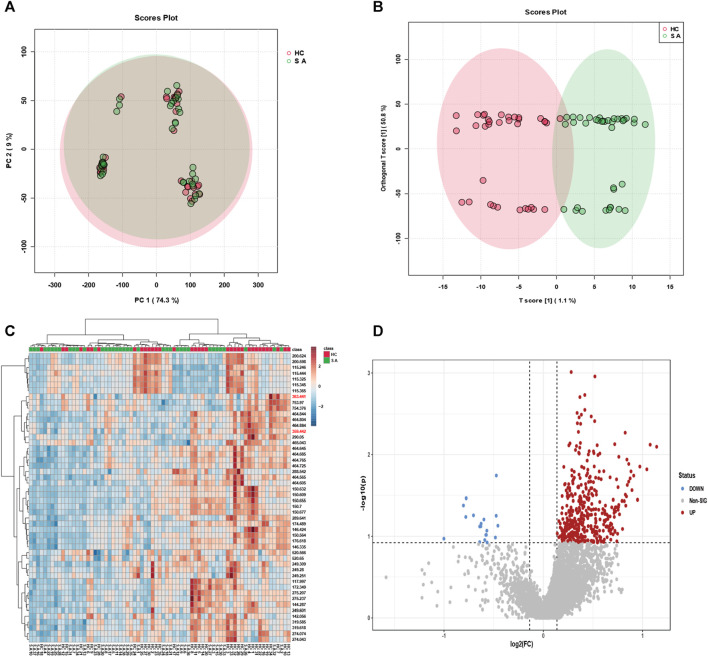
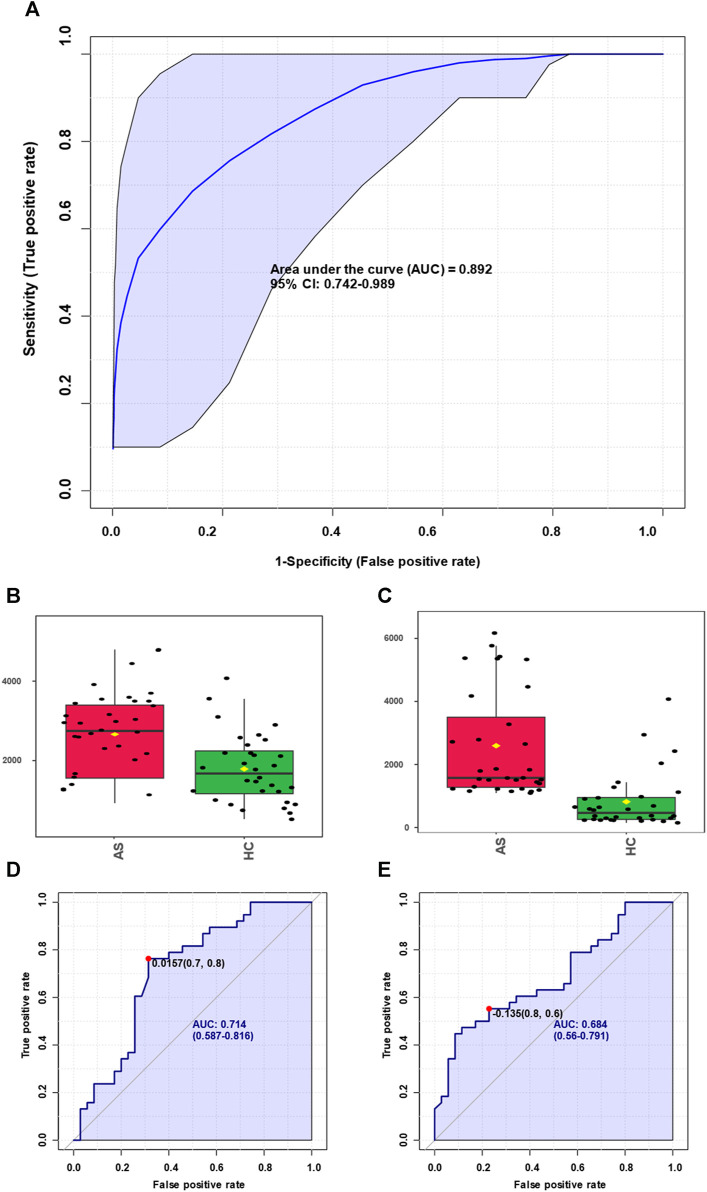
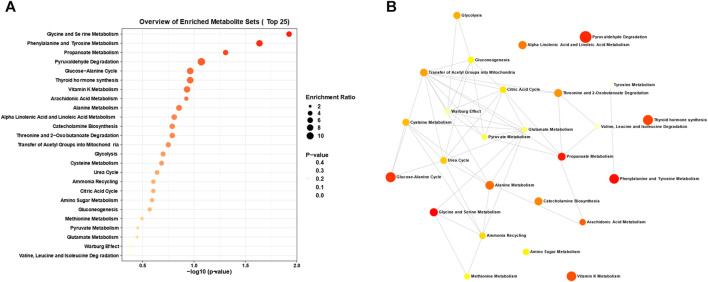
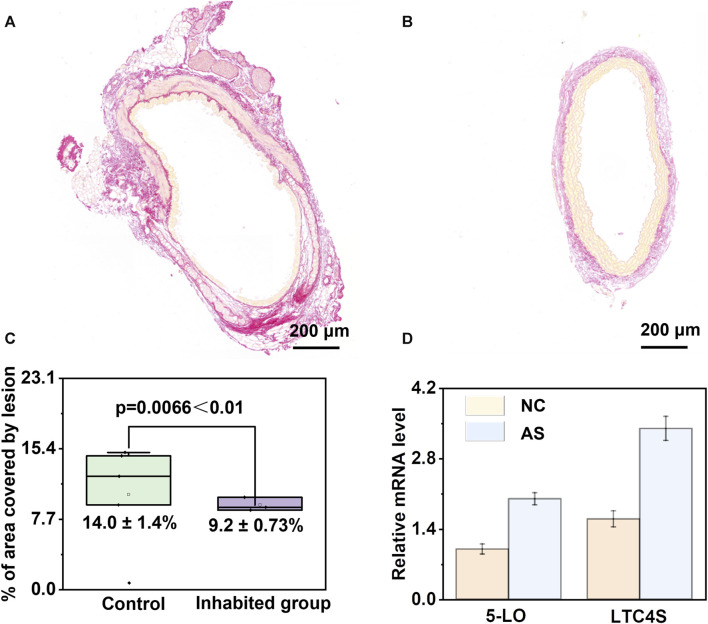
Atherosclerosis is a complex vascular disorder characterized by the deposition of lipids, inflammatory cascades, and plaque formation in arterial walls. A thorough understanding of its causes and progression is necessary to develop effective diagnostic and therapeutic strategies. Recent breakthroughs in metabolomics have provided valuable insights into the molecular mechanisms and genetic factors involved in atherosclerosis, leading to innovative approaches for preventing and treating the disease. In our study, we analyzed clinical serum samples from both atherosclerosis patients and animal models using laser desorption ionization mass spectrometry. By employing methods such as orthogonal partial least-squares discrimination analysis (OPLS-DA), heatmaps, and volcano plots, we can accurately classify atherosclerosis (AUC = 0.892) and identify key molecules associated with the disease. Specifically, we observed elevated levels of arachidonic acid and its metabolite, leukotriene B4, in atherosclerosis. By inhibiting arachidonic acid and monitoring its downstream metabolites, we discovered the crucial role of this metabolic pathway in regulating atherosclerosis. Metabolomic research provides detailed insights into the metabolic networks involved in atherosclerosis development and reveals the close connection between abnormal metabolism and the disease. These studies offer new possibilities for precise diagnosis, treatment, and monitoring of disease progression, as well as evaluating the effectiveness of therapeutic interventions.
Keywords: arachidonic acid; atherosclerosis; exacerbating role; metabolism; metabolomics.
Copyright © 2024 Ma, He, Liu, Zhuang, Li, Lin, Wang, Feng and Wang.
Conflict of interest statement
The authors declare that the research was conducted in the absence of any commercial or financial relationships that could be construed as a potential conflict of interest.
Figures
Similar articles
-
[Compatibility mechanism of Trichosanthis Fructus-Allii Macrostemonis Bulbus combination against atherosclerosis: based on metabolomics and network pharmacology].Zhongguo Zhong Yao Za Zhi. 2022 Nov;47(22):6207-6216. doi: 10.19540/j.cnki.cjcmm.20220727.701. Zhongguo Zhong Yao Za Zhi. 2022. PMID: 36471946 Chinese.
-
Targeted metabolomics analysis for serum Helicobacter pylori-positive based on liquid chromatography-tandem mass spectrometry.Biomed Chromatogr. 2023 Jun;37(6):e5622. doi: 10.1002/bmc.5622. Epub 2023 Apr 9. Biomed Chromatogr. 2023. PMID: 36898359
-
Arachidonic acid metabolism is elevated in Mycoplasma gallisepticum and Escherichia coli co-infection and induces LTC4 in serum as the biomarker for detecting poultry respiratory disease.Virulence. 2020 Jan 1;11(1):730-738. doi: 10.1080/21505594.2020.1772653. Virulence. 2020. PMID: 32441188 Free PMC article.
-
Serum Metabolomics Reveals Dysregulation and Diagnostic Potential of Oxylipins in Tumor-induced Osteomalacia.J Clin Endocrinol Metab. 2022 Apr 19;107(5):1383-1391. doi: 10.1210/clinem/dgab885. J Clin Endocrinol Metab. 2022. PMID: 34904633
-
Defining atherosclerotic plaque biology by mass spectrometry-based omics approaches.Mol Omics. 2023 Jan 16;19(1):6-26. doi: 10.1039/d2mo00260d. Mol Omics. 2023. PMID: 36426765 Review.
Cited by
-
Endothelial soluble epoxide hydrolase links polyunsaturated fatty acid metabolism to oxidative stress and atherosclerosis progression.Redox Biol. 2025 Jun 14;85:103730. doi: 10.1016/j.redox.2025.103730. Online ahead of print. Redox Biol. 2025. PMID: 40554101 Free PMC article.
-
The causal relationship between 233 metabolites and coronary atherosclerosis: a Mendelian randomization study.Front Cardiovasc Med. 2024 Dec 12;11:1439699. doi: 10.3389/fcvm.2024.1439699. eCollection 2024. Front Cardiovasc Med. 2024. PMID: 39726950 Free PMC article.
-
Impact of bacteroides uniformis on fatty liver hemorrhagic syndrome in dawu golden phoenix laying hens: modulation of gut microbiota and arachidonic acid metabolism.Front Microbiol. 2025 Apr 28;16:1560887. doi: 10.3389/fmicb.2025.1560887. eCollection 2025. Front Microbiol. 2025. PMID: 40356654 Free PMC article.
-
Recent advances in cardiovascular disease research driven by metabolomics technologies in the context of systems biology.NPJ Metab Health Dis. 2024 Sep 23;2(1):25. doi: 10.1038/s44324-024-00028-z. NPJ Metab Health Dis. 2024. PMID: 40603608 Free PMC article. Review.
-
Biomimetic nanocomplexes loading with evolocumab and curcumin for synergistic anti-atherosclerosis therapy in ApoE-/- mice.J Nanobiotechnology. 2025 Jun 3;23(1):412. doi: 10.1186/s12951-025-03444-5. J Nanobiotechnology. 2025. PMID: 40462197 Free PMC article.
References
-
- Chen J., Li Y., Jiang Y., Mao L., Lai M., Jiang L., et al. (2021). TiO2/MXene-Assisted LDI-MS for urine metabolic profiling in urinary disease. Adv. Funct. Mat. 31. 10.1002/adfm.202106743 - DOI
LinkOut - more resources
Full Text Sources