

The prognostic value of lymph node ratio for thyroid cancer: a meta-analysis
- PMID: 38384804
- PMCID: PMC10879587
- DOI: 10.3389/fonc.2024.1333094
The prognostic value of lymph node ratio for thyroid cancer: a meta-analysis
Abstract
Background: The prognostic value of lymph node ratio (LNR) has been proved in several cancers. However, the potential of LNR to be a prognostic factor for thyroid cancer has not been validated so far. This article evaluated the prognostic value of LNR for thyroid cancer through a meta-analysis.
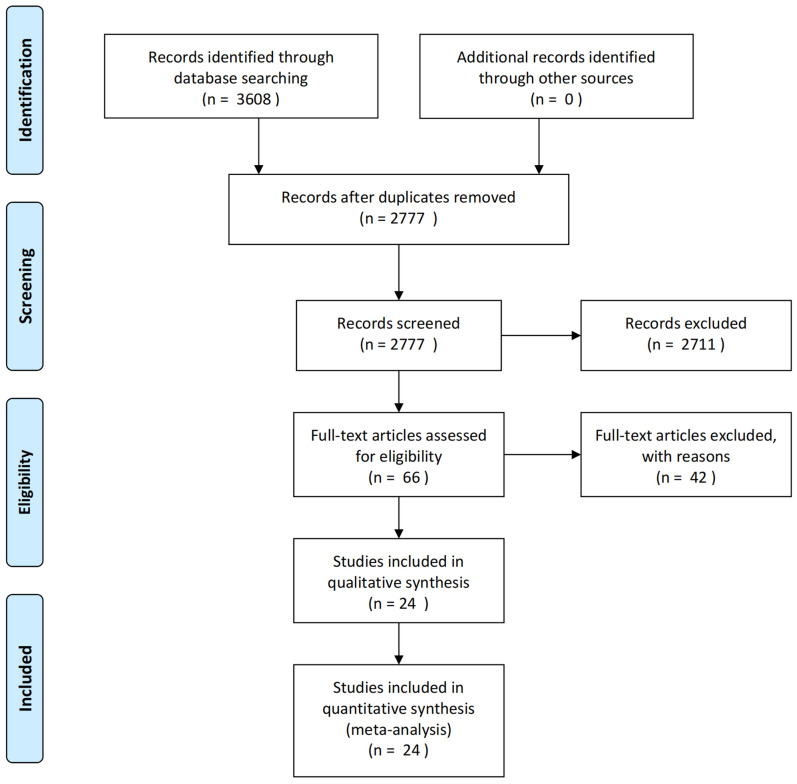
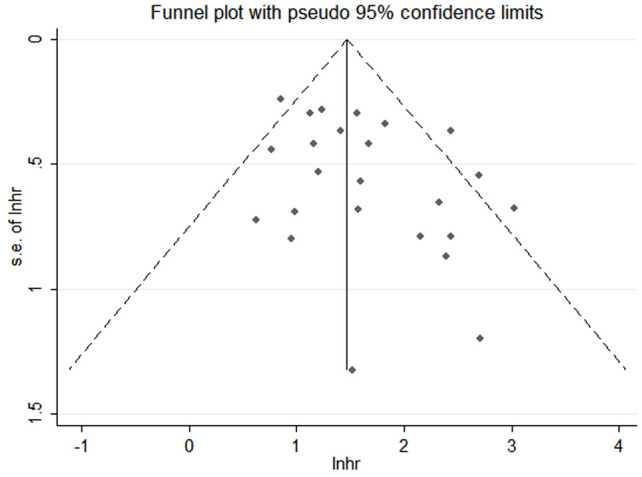
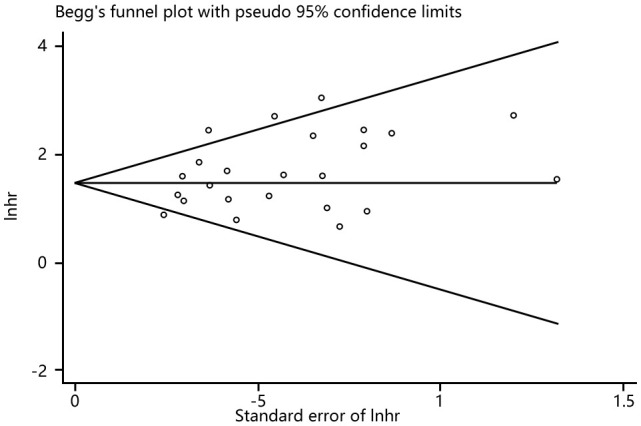
Methods: A systematic search was conducted for eligible publications that study the prognostic values of LNR for thyroid cancer in the databases of PubMed, EMBASE, Cochrane, and Web of Science up until October 24, 2023. The quality of the eligible studies was evaluated by The Newcastle-Ottawa Assessment Scale of Cohort Study. The effect measure for meta-analysis was Hazard Ratio (HR). Random effect model was used to calculate the pooled HR and 95% confidence intervals. A sensitivity analysis was applied to assess the stability of the results. Subgroup analysis and a meta-regression were performed to explore the source of heterogeneity. And a funnel plot, Begg's and Egger's tests were used to evaluate publication bias.
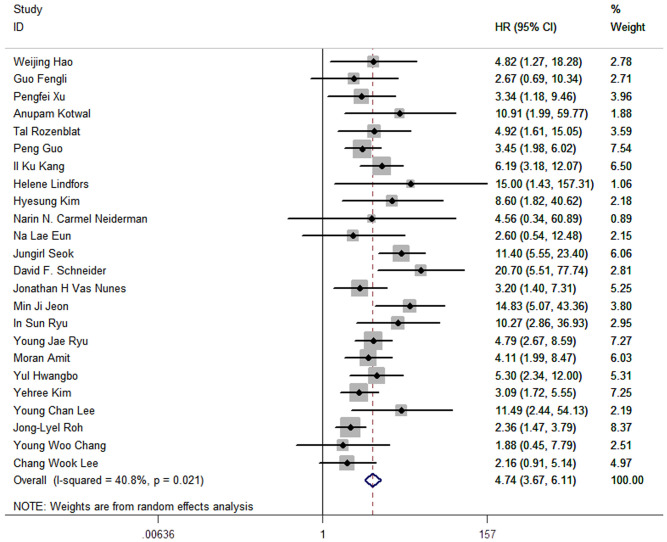
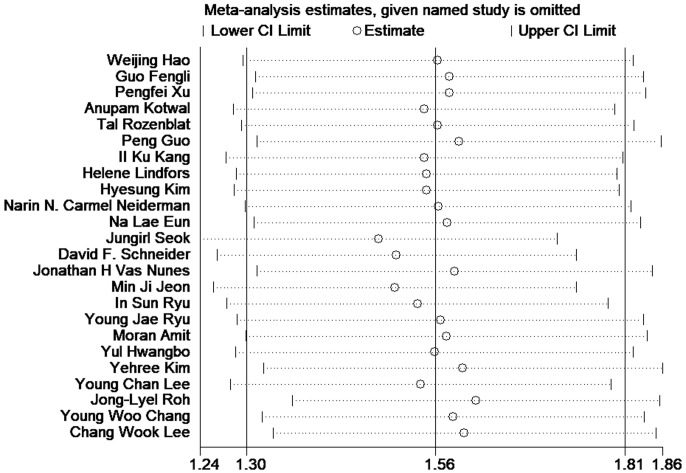
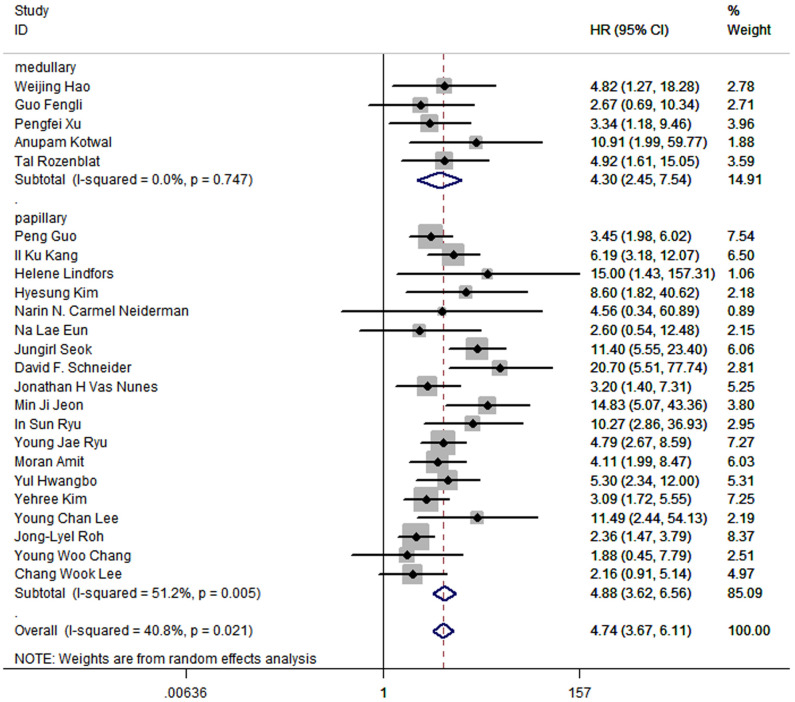
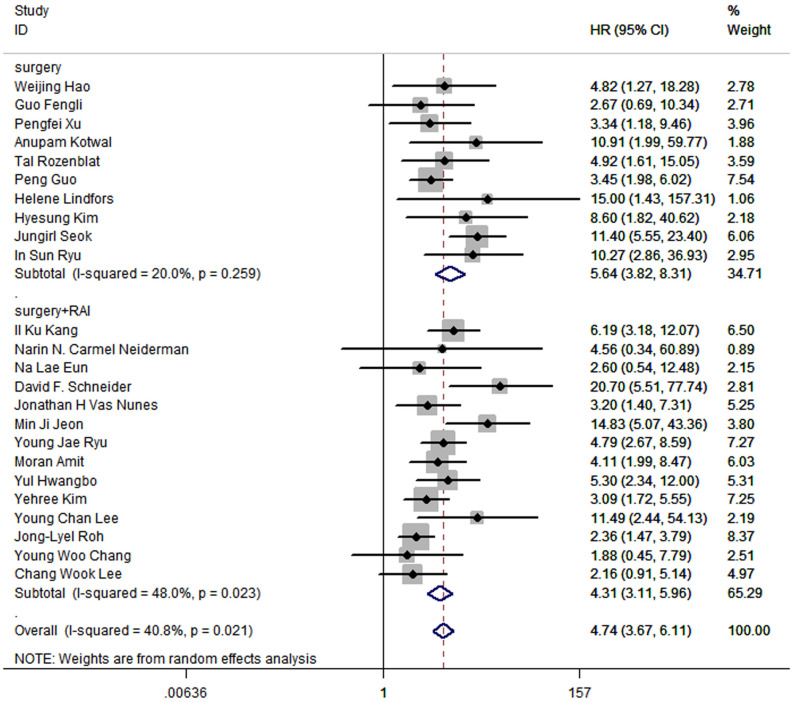
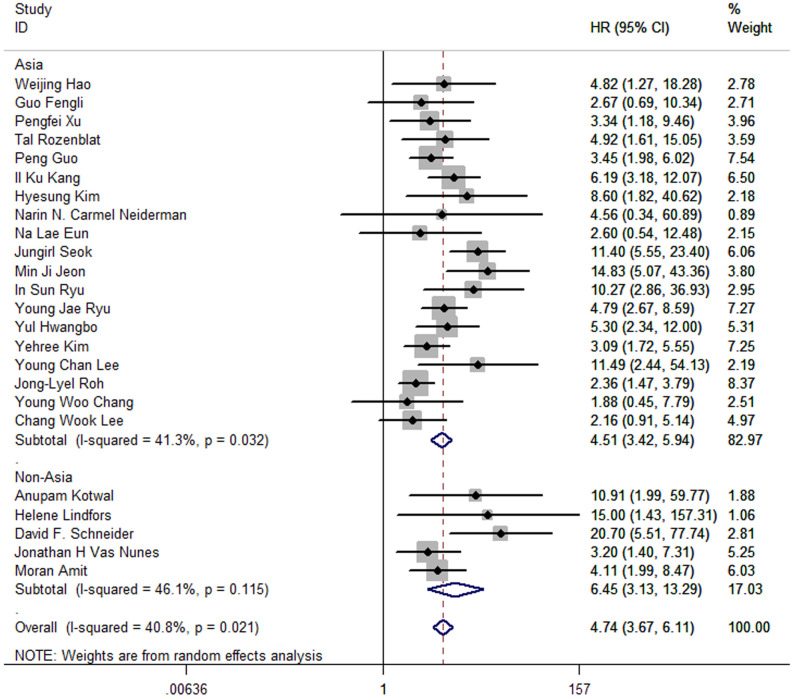
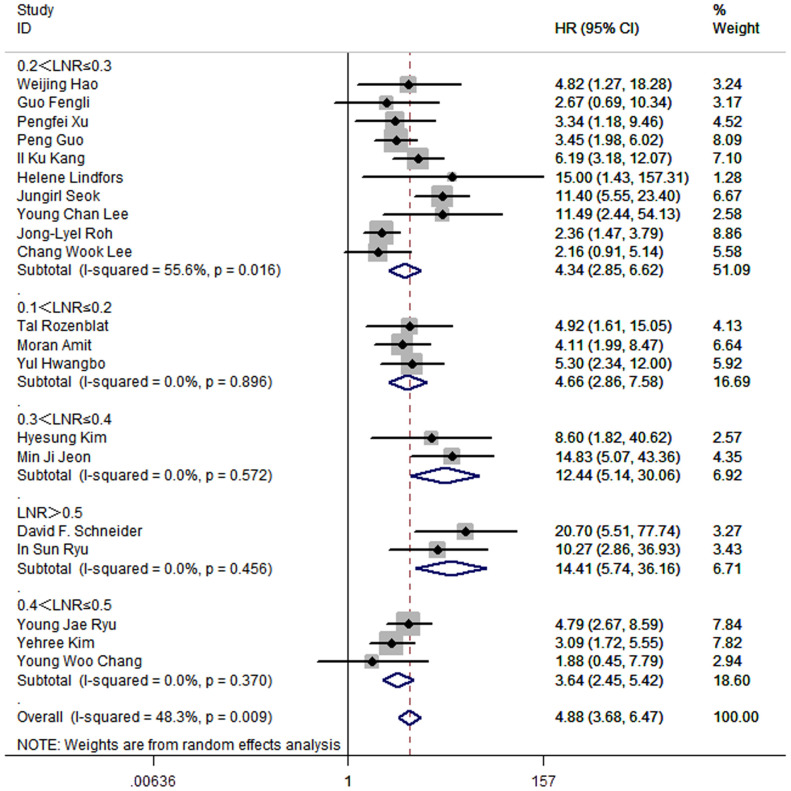
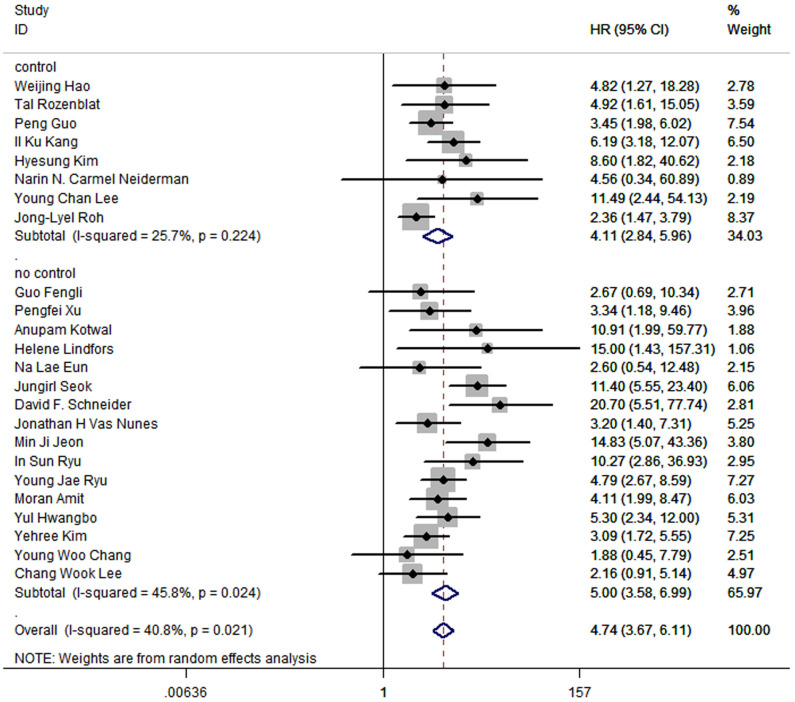
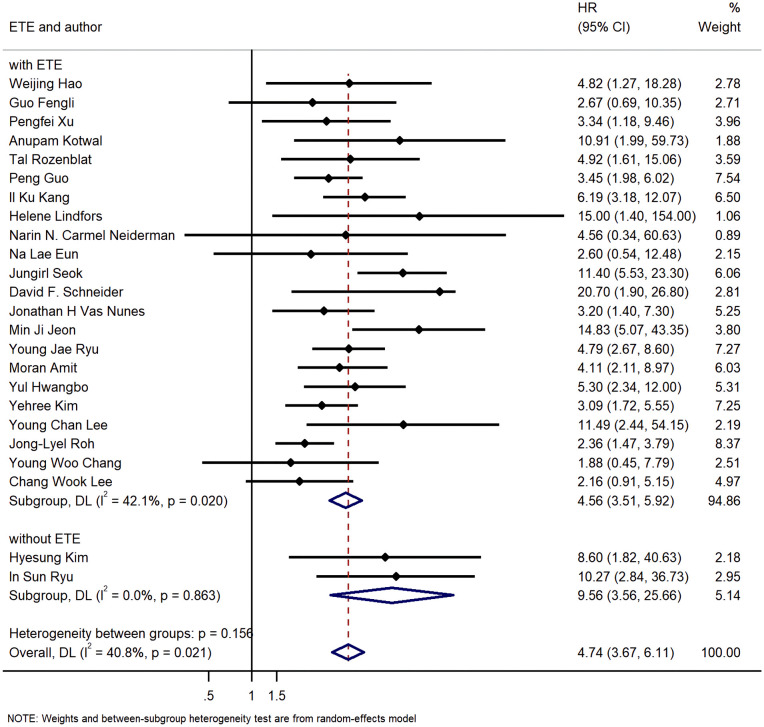
Results: A total of 15,698 patients with thyroid cancer from 24 eligible studies whose quality were relatively high were included. The pooled HR was 4.74 (95% CI:3.67-6.11; P<0.05) and a moderate heterogeneity was shown (I2 = 40.8%). The results of meta-analysis were stable according to the sensitivity analysis. Similar outcome were shown in subgroup analysis that higher LNR was associated with poorer disease-free survival (DFS). Results from meta-regression indicated that a combination of 5 factors including country, treatment, type of thyroid cancer, year and whether studies control factors in design or analysis were the origin of heterogeneity.
Conclusion: Higher LNR was correlated to poorer disease free survival in thyroid cancer. LNR could be a potential prognostic indicator for thyroid cancer. More effort should be made to assess the potential of LNR to be included in the risk stratification systems for thyroid cancer.
Systematic review registration: https://www.crd.york.ac.uk/PROSPERO/display_record.php?RecordID=477135, identifier CRD42023477135.
Keywords: disease-free survival; lymph node ratio; meta-analysis; prognosis; thyroid cancer.
Copyright © 2024 Hu, Wang, Dong, Zhang and Xiuyang.
Conflict of interest statement
The authors declare that the research was conducted in the absence of any commercial or financial relationships that could be construed as a potential conflict of interest.
Figures
Similar articles
-
The prognostic values of lymph node ratio for gynecological cancer: a systematic review and meta-analysis.Front Oncol. 2024 Oct 1;14:1475348. doi: 10.3389/fonc.2024.1475348. eCollection 2024. Front Oncol. 2024. PMID: 39411125 Free PMC article.
-
Integrated analysis of the prognostic role of the lymph node ratio in node-positive gastric cancer: A meta-analysis.Int J Surg. 2018 Sep;57:76-83. doi: 10.1016/j.ijsu.2018.08.002. Epub 2018 Aug 10. Int J Surg. 2018. PMID: 30103072 Review.
-
Intratumoral high endothelial venules in solid tumors: a pooled study.Front Immunol. 2024 Jul 8;15:1401118. doi: 10.3389/fimmu.2024.1401118. eCollection 2024. Front Immunol. 2024. PMID: 39040120 Free PMC article.
-
The Prognostic Significance of Lymph Node Ratio for Esophageal Cancer: A Meta-Analysis.J Surg Res. 2023 Dec;292:53-64. doi: 10.1016/j.jss.2023.07.027. Epub 2023 Aug 14. J Surg Res. 2023. PMID: 37586187
-
[Meta analysis of whether cytoreductive surgery combined with hyperthermic intraperitoneal chemotherapy can improve survival in patients with colorectal cancer peritoneal metastasis].Zhonghua Wei Chang Wai Ke Za Zhi. 2021 Mar 25;24(3):256-263. doi: 10.3760/cma.j.cn.441530-20201111-00604. Zhonghua Wei Chang Wai Ke Za Zhi. 2021. PMID: 34645170 Chinese.
Cited by
-
The Initial Risk Stratification System for Differentiated Thyroid Cancer: Key Updates in the 2024 Korean Thyroid Association Guideline.Endocrinol Metab (Seoul). 2025 Jun;40(3):357-384. doi: 10.3803/EnM.2025.2465. Epub 2025 Jun 24. Endocrinol Metab (Seoul). 2025. PMID: 40598904 Free PMC article. Review.
-
Pathological metastatic lymph node density (ND) predicts early recurrence in papillary thyroid cancer patients after curative resection.Gland Surg. 2025 May 30;14(5):897-911. doi: 10.21037/gs-2025-36. Epub 2025 May 15. Gland Surg. 2025. PMID: 40546845 Free PMC article.
-
Long-term efficacy of lobectomy for stage T1 papillary thyroid carcinoma with varying degrees of lymph node metastasis.Front Endocrinol (Lausanne). 2024 Aug 8;15:1453601. doi: 10.3389/fendo.2024.1453601. eCollection 2024. Front Endocrinol (Lausanne). 2024. PMID: 39175578 Free PMC article.
References
Publication types
LinkOut - more resources
Full Text Sources