

Identification and Verification of Novel Biomarkers Involving Rheumatoid Arthritis with Multimachine Learning Algorithms: An In Silicon and In Vivo Study
- PMID: 38385005
- PMCID: PMC10881253
- DOI: 10.1155/2024/3188216
Identification and Verification of Novel Biomarkers Involving Rheumatoid Arthritis with Multimachine Learning Algorithms: An In Silicon and In Vivo Study
Abstract
Background: Rheumatoid arthritis (RA) remains one of the most prevalent chronic joint diseases. However, due to the heterogeneity among RA patients, there are still no robust diagnostic and therapeutic biomarkers for the diagnosis and treatment of RA.
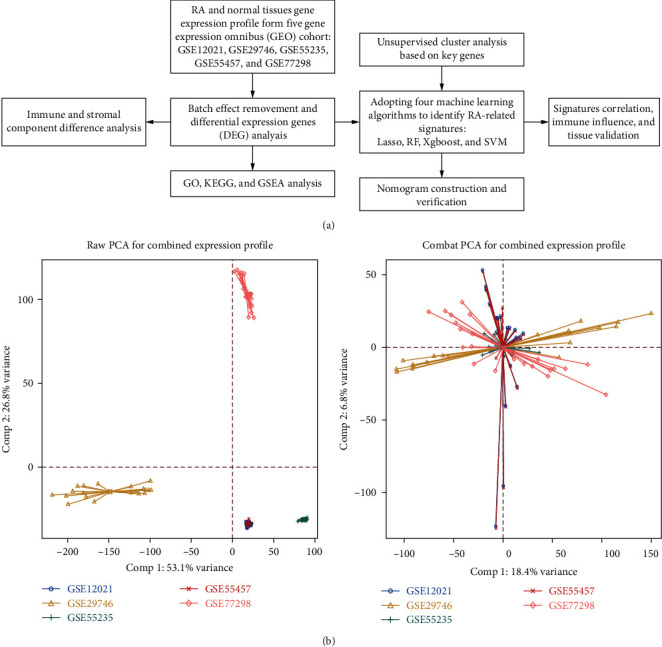
Methods: We retrieved RA-related and pan-cancer information datasets from the Gene Expression Omnibus and The Cancer Genome Atlas databases, respectively. Six gene expression profiles and corresponding clinical information of GSE12021, GSE29746, GSE55235, GSE55457, GSE77298, and GSE89408 were adopted to perform differential expression gene analysis, enrichment, and immune component difference analyses of RA. Four machine learning algorithms, including LASSO, RF, XGBoost, and SVM, were used to identify RA-related biomarkers. Unsupervised cluster analysis was also used to decipher the heterogeneity of RA. A four-signature-based nomogram was constructed and verified to specifically diagnose RA and osteoarthritis (OA) from normal tissues. Consequently, RA-HFLS cell was utilized to investigate the biological role of CRTAM in RA. In addition, comparisons of diagnostic efficacy and biological roles among CRTAM and other classic biomarkers of RA were also performed.
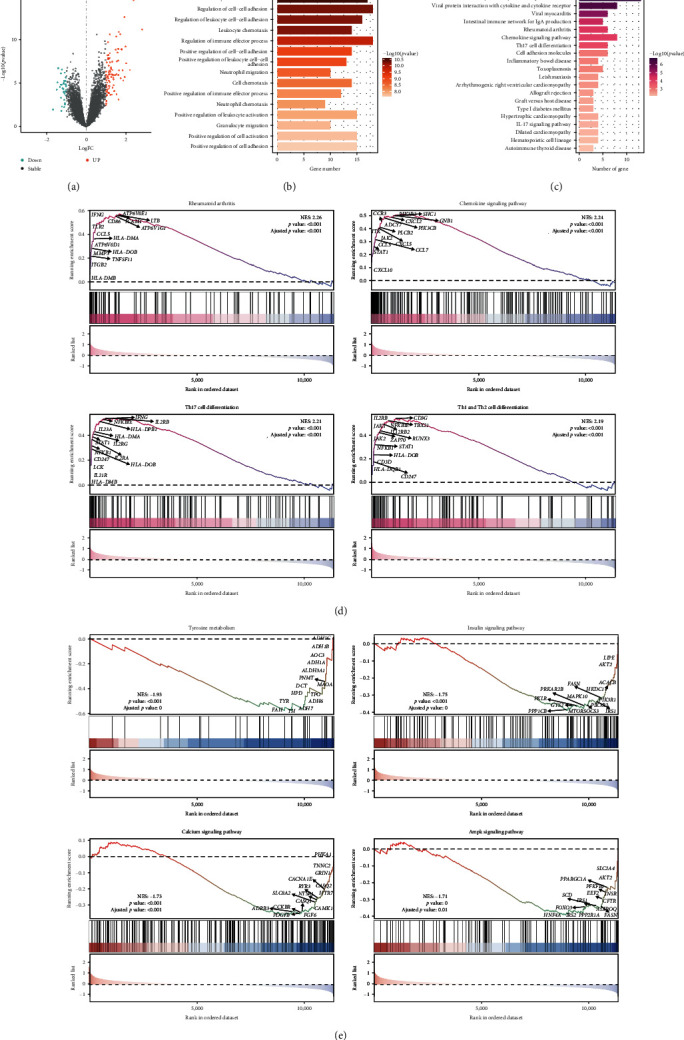
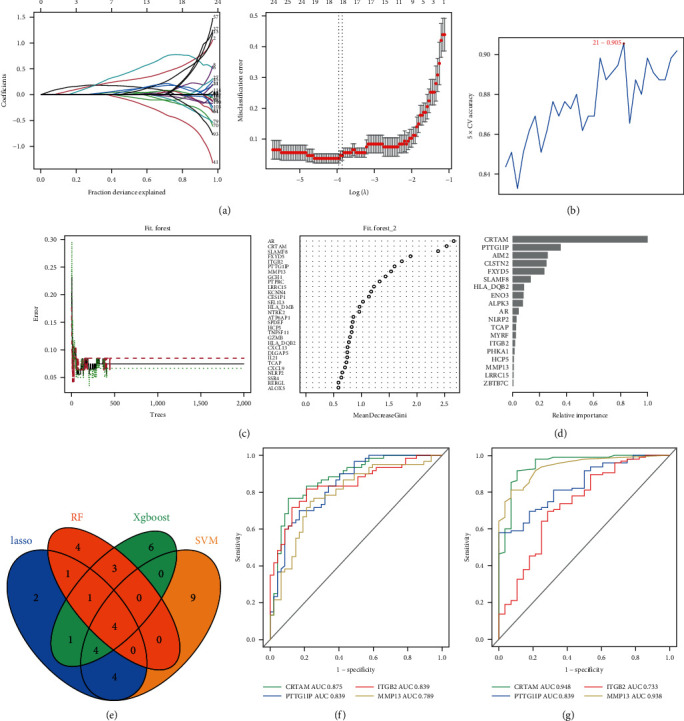
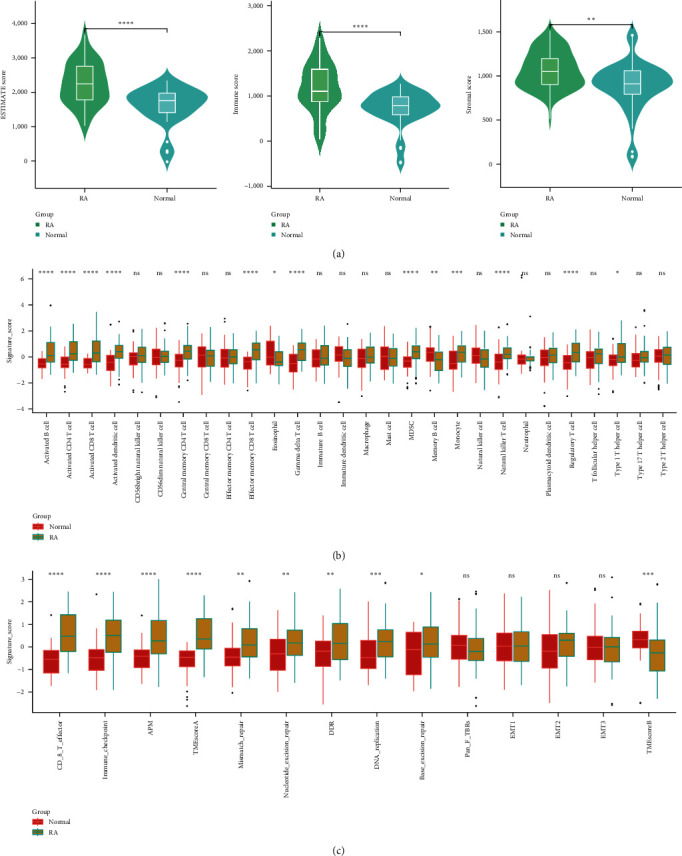
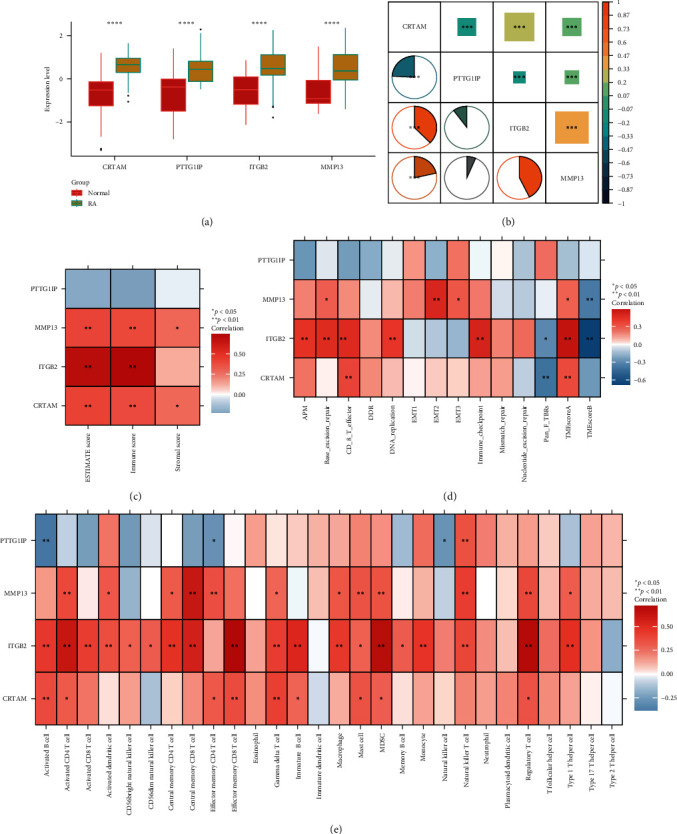
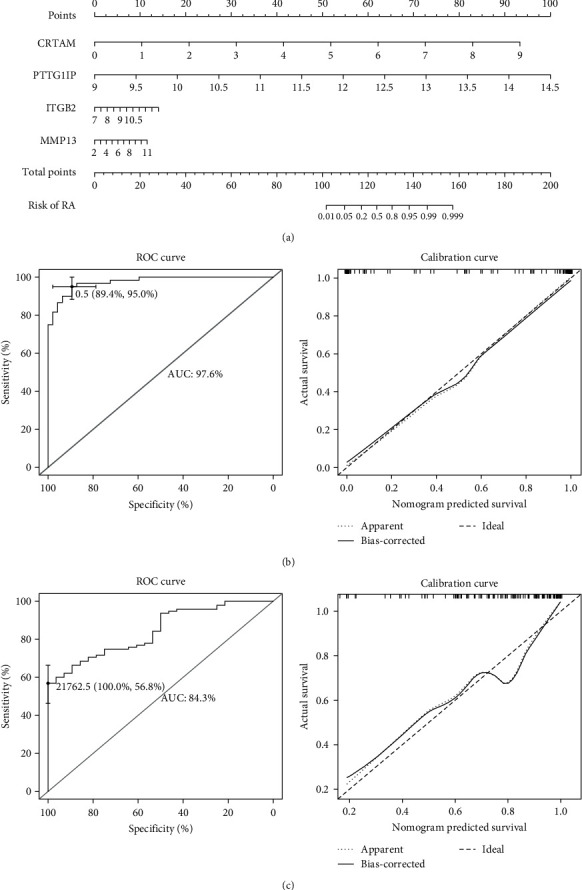
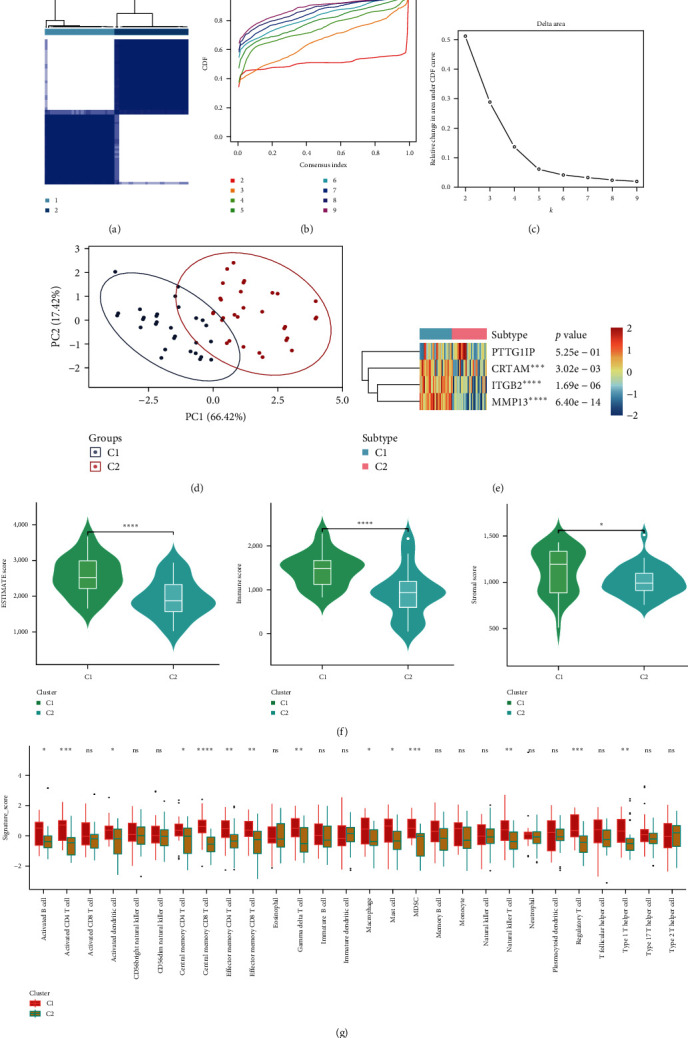
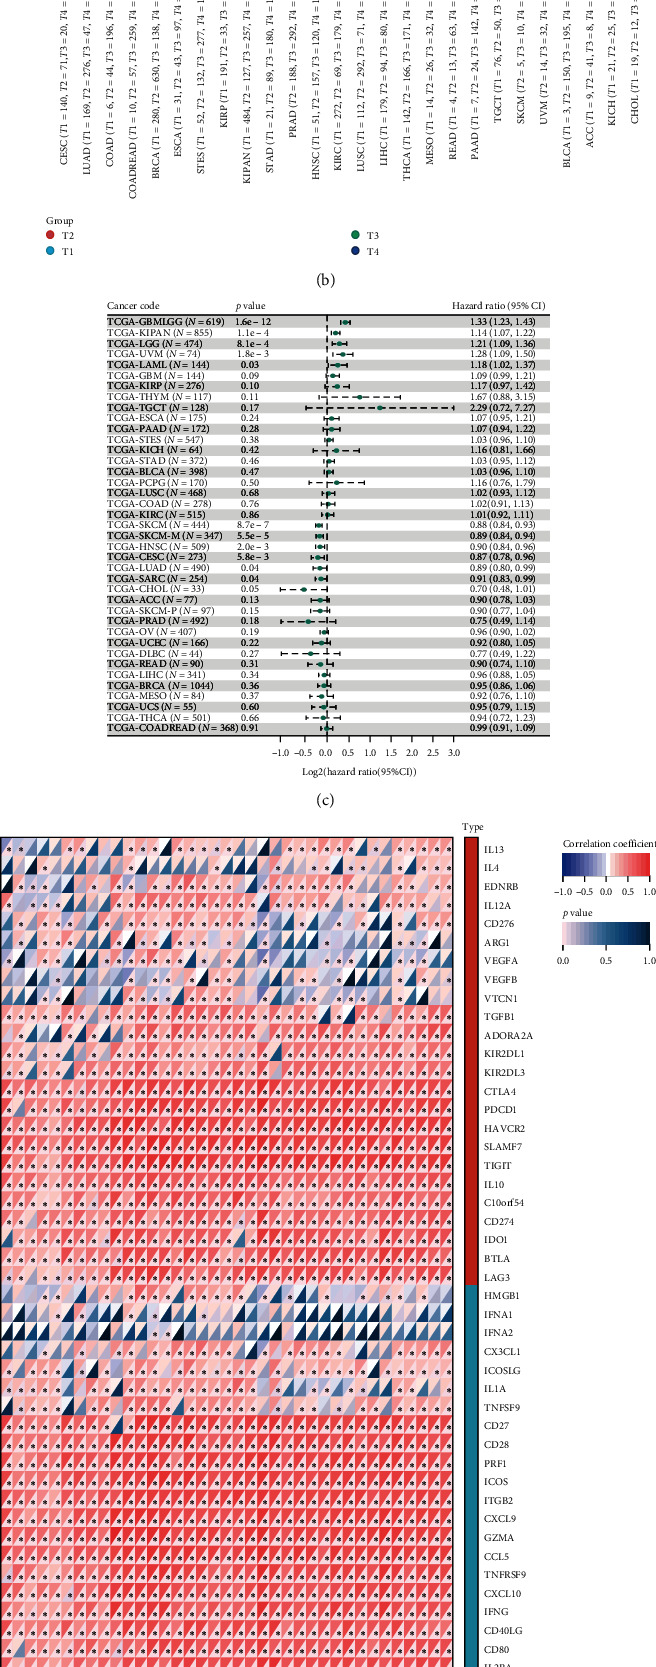
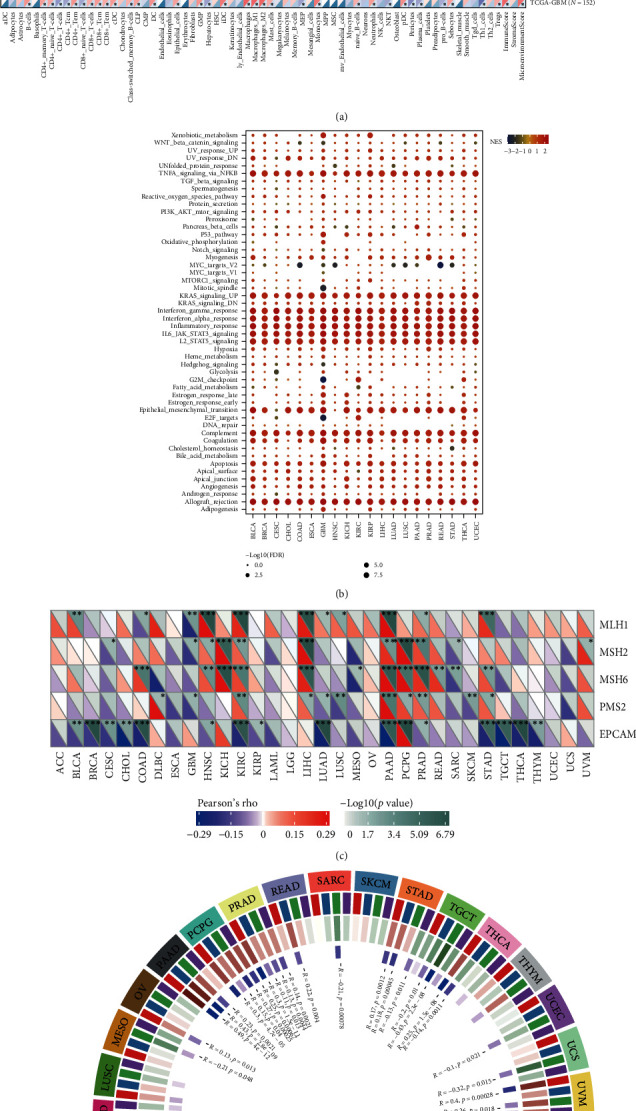
Results: Immune and stromal components were highly enriched in RA. Chemokine- and Th cell-related signatures were significantly activated in RA tissues. Four promising and novel biomarkers, including CRTAM, PTTG1IP, ITGB2, and MMP13, were identified and verified, which could be treated as novel treatment and diagnostic targets for RA. Nomograms based on the four signatures might aid in distinguishing and diagnosing RA, which reached a satisfactory performance in both training (AUC = 0.894) and testing (AUC = 0.843) cohorts. Two distinct subtypes of RA patients were identified, which further verified that these four signatures might be involved in the immune infiltration process. Furthermore, knockdown of CRTAM could significantly suppress the proliferation and invasion ability of RA cell line and thus could be treated as a novel therapeutic target. CRTAM owned a great diagnostic performance for RA than previous biomarkers including MMP3, S100A8, S100A9, IL6, COMP, LAG3, and ENTPD1. Mechanically, CRTAM could also be involved in the progression through immune dysfunction, fatty acid metabolism, and genomic instability across several cancer subtypes.
Conclusion: CRTAM, PTTG1IP, ITGB2, and MMP13 were highly expressed in RA tissues and might function as pivotal diagnostic and treatment targets by deteriorating the immune dysfunction state. In addition, CRTAM might fuel cancer progression through immune signals, especially among RA patients.
Copyright © 2024 Fucun Liu et al.
Conflict of interest statement
The authors declare that the research was conducted in the absence of any commercial or financial relationships that could be construed as a potential conflicts of interest.
Figures
Similar articles
-
Identification and Validation of Hub Genes for Predicting Treatment Targets and Immune Landscape in Rheumatoid Arthritis.Biomed Res Int. 2022 Oct 22;2022:8023779. doi: 10.1155/2022/8023779. eCollection 2022. Biomed Res Int. 2022. PMID: 36317112 Free PMC article.
-
Integrative analysis and validation of necroptosis-related molecular signature for evaluating diagnosis and immune features in Rheumatoid arthritis.Int Immunopharmacol. 2024 Apr 20;131:111809. doi: 10.1016/j.intimp.2024.111809. Epub 2024 Mar 13. Int Immunopharmacol. 2024. PMID: 38484666
-
Machine learning to identify immune-related biomarkers of rheumatoid arthritis based on WGCNA network.Clin Rheumatol. 2022 Apr;41(4):1057-1068. doi: 10.1007/s10067-021-05960-9. Epub 2021 Nov 12. Clin Rheumatol. 2022. PMID: 34767108
-
Identification of Disease-Specific Hub Biomarkers and Immune Infiltration in Osteoarthritis and Rheumatoid Arthritis Synovial Tissues by Bioinformatics Analysis.Dis Markers. 2021 May 17;2021:9911184. doi: 10.1155/2021/9911184. eCollection 2021. Dis Markers. 2021. PMID: 34113405 Free PMC article.
-
Identification and validation of metabolism-related genes signature and immune infiltration landscape of rheumatoid arthritis based on machine learning.Aging (Albany NY). 2023 May 10;15(9):3807-3825. doi: 10.18632/aging.204714. Epub 2023 May 10. Aging (Albany NY). 2023. PMID: 37166429 Free PMC article.
Cited by
-
Identification and validation of CKAP2 as a novel biomarker in the development and progression of rheumatoid arthritis.Front Immunol. 2025 Jun 25;16:1606201. doi: 10.3389/fimmu.2025.1606201. eCollection 2025. Front Immunol. 2025. PMID: 40636121 Free PMC article.
-
Explainable Boosting Machines Identify Key Metabolomic Biomarkers in Rheumatoid Arthritis.Medicina (Kaunas). 2025 Apr 30;61(5):833. doi: 10.3390/medicina61050833. Medicina (Kaunas). 2025. PMID: 40428791 Free PMC article.
References
MeSH terms
Substances
LinkOut - more resources
Full Text Sources
Medical
Research Materials
Miscellaneous
