. 2024 Jan 25;20(4):1194-1217.
doi: 10.7150/ijbs.91624. eCollection 2024.

The NAD+ Precursor Nicotinamide Riboside Rescues Mitochondrial Defects and Neuronal Loss in iPSC derived Cortical Organoid of Alpers' Disease

Affiliations

The NAD+ Precursor Nicotinamide Riboside Rescues Mitochondrial Defects and Neuronal Loss in iPSC derived Cortical Organoid of Alpers' Disease

Yu Hong et al. Int J Biol Sci. .

Abstract

Alpers' syndrome is an early-onset neurodegenerative disorder usually caused by biallelic pathogenic variants in the gene encoding the catalytic subunit of polymerase-gamma (POLG), which is essential for mitochondrial DNA (mtDNA) replication. The disease is progressive, incurable, and inevitably it leads to death from drug-resistant status epilepticus. The neurological features of Alpers' syndrome are intractable epilepsy and developmental regression, with no effective treatment; the underlying mechanisms are still elusive, partially due to lack of good experimental models. Here, we generated the patient derived induced pluripotent stem cells (iPSCs) from one Alpers' patient carrying the compound heterozygous mutations of A467T (c.1399G>A) and P589L (c.1766C>T), and further differentiated them into cortical organoids and neural stem cells (NSCs) for mechanistic studies of neural dysfunction in Alpers' syndrome. Patient cortical organoids exhibited a phenotype that faithfully replicated the molecular changes found in patient postmortem brain tissue, as evidenced by cortical neuronal loss and depletion of mtDNA and complex I (CI). Patient NSCs showed mitochondrial dysfunction leading to ROS overproduction and downregulation of the NADH pathway. More importantly, the NAD+ precursor nicotinamide riboside (NR) significantly ameliorated mitochondrial defects in patient brain organoids. Our findings demonstrate that the iPSC model and brain organoids are good in vitro models of Alpers' disease; this first-in-its-kind stem cell platform for Alpers' syndrome enables therapeutic exploration and has identified NR as a viable drug candidate for Alpers' disease and, potentially, other mitochondrial diseases with similar causes.

Keywords: Alpers' disease; NAD+; NR; cortical organoids; induced pluripotent stem cells; mitochondrial function.


Conflict of interest statement

Competing Interests: E.F.F. has a CRADA arrangement with ChromaDex (USA) and a commercialization agreement with Molecule AG/VITADAO and is consultant to Aladdin Healthcare Technologies (UK and Germany), the Vancouver Dementia Prevention Centre (Canada), Intellectual Labs (Norway), and MindRank AI (China). All other authors declare that the research was conducted in the absence of any commercial or financial relationships that could be construed as a potential conflict of interest.

Figures

Figure 1
Figure 1
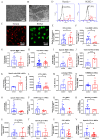
Measurement of mitochondrial function, mtDNA alteration and mitochondrial complexes in Alpers' iPSCs. A. Illustration of reprogramming of Alpers' patient's fibroblasts into iPSCs. B. Molecular Structure of POLG protein and position of A467T and P589L mutations. C. Representative fluorescent images of Alpers' iPSCs for pluripotent markers OCT4 and SSEA4. Nuclei are stained with DAPI (blue). Scale bar is 50 µm. D. A467T and P589L mutation verified by sanger sequencing using Alpers' reprogrammed iPSCs. E. Flow cytometric analysis for mitochondrial volume using MTG in iPSCs. F-G. Flow cytometric analysis for total MMP and specific MMP in iPSCs. H-K. Flow cytometric analysis for total ROS, specific ROS, total mito-ROS, and specific mito-ROS in iPSCs. L-M. Flow cytometric analysis for ATP and lactate production in iPSCs. N. Flow cytometric analysis for TOMM20 levels in iPSCs. O. Flow cytometric analysis for TFAM in iPSCs. P-R. Flow cytometric analysis for CI, specific CI, and specific CIV levels in iPSCs. The numbers of clones and replications in each experiment was listed in Table S 13.
Figure 2
Figure 2
Measurement of mitochondrial function, mtDNA alteration and mitochondrial complexes in Alpers' NSCs. A. Representative phase-contrast images of NSCs of Alpers' patient. Scale bar is 200 µm. B. Representative TEM images of NSCs of Alpers' patient. Scale bar is 200 nm. C. Representative fluorescent images of Alpers' NSCs for NSC markers Nestin and SOX2. D. Flow cytometric analysis for NSC markers Nestin and SOX2 in NSCs. E. Flow cytometric analysis for mitochondrial volume using MTG in NSCs. F-G. Flow cytometric analysis for total MMP and specific MMP in NSCs. H-K. Flow cytometric analysis for total ROS, specific ROS, total mito-ROS, and specific mito-ROS in NSCs. L-M. Flow cytometric analysis for ATP and lactate production in NSCs. N. Flow cytometric analysis for TOMM20 levels in NSCs. O-P. Flow cytometric analysis for TFAM and mtDNA copy number levels in NSCs. Q-V. Flow cytometric analysis for CI, specific CI, CII, specific II, CIV, specific CIV levels in NSCs. The numbers of clones and replications in each experiment was listed in Table S 13.
Figure 3
Figure 3
Transcriptomic status and dysregulated mitochondrial related pathways of Alpers' patient derived iPSCs and NSCs. A. Sample correlation in transcriptomic status of Alpers' patient derived iPSCs and NSCs, and the corresponding controls. B. PCA analysis of transcriptomic expression data for Alpers' patient derived iPSC and NSCs and controls. C. Number of upregulated and down-regulated DE genes between Alpers' and NSCs in iPSCs and NSCs, respectively. D. Downregulated metabolic pathways in Alpers' iPSCs compared with controls. E. Upregulated metabolic pathways in Alpers' iPSCs compared with controls. F. Downregulated metabolic pathways in Alpers' NSCs compared with controls. G. Upregulated metabolic pathways in Alpers' NSCs compared with controls. H-I. RNA expressions of mitochondrial genes in Alpers' iPSCs and NSCs.
Figure 4
Figure 4
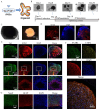
Generation of cortical brain organoid from iPSCs. A. Illustration of generation of cortical brain organoid. B. Generation of cortical brain organoid using iPSCs. Scale bar is 100 µm or 200 µm. C. Phase-contrast images of cortical organoids of Alpers' patient and controls at day 54. Scale bar is 200 µm (left) or 150 µm (right). D. Fluorescent staining of cortical organoid section using mature neuron marker MAP2 at day 40. Nuclei are stained with DAPI (blue). Scale bar is 20 µm. E. Fluorescent staining of cortical organoid section using neuron marker Tuj1 and neural progenitor marker SOX2 at day 40. Nuclei are stained with DAPI (blue). Scale bar is 20 µm. F. Fluorescent staining of cortical organoid section using cortical neuronal markers SATB2, CTIP2 and astrocyte marker GFAP at day 90. Nuclei are stained with DAPI (blue). Scale bar is 20 µm. G. Fluorescent staining of cortical organoid section using neuron marker NeuN and astrocyte marker GFAP at day 90. Nuclei are stained with DAPI (blue). Scale bar is 20 µm.
Figure 5
Figure 5
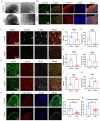
Cortical layer deformation, neuronal loss, and astrocyte proliferation in Alpers' cortical organoid. A. Phase-contrast images of cortical organoids of Alpers' patient and controls at day 90. Scale bar is 100 µm or 200 µm. B. Fluorescent staining of Alpers' and control cortical organoid section using cortical neuronal markers SATB2, CTIP2 and astrocytes marker GFAP at day 90. Nuclei are stained with DAPI (blue). Scale bar is 50 µm. C. Fluorescent staining of Alpers' and control cortical organoid (day 90) section using neural fiber marker MAP2 and cortical neuronal markers SATB2, CTIP2. Nuclei are stained with DAPI (blue). Scale bar is 30 µm. D. Fluorescent staining of Alpers' and control cortical organoid (day 90) section using astrocyte marker GFAP, neural marker NEUN, and neural progenitor marker SOX2. Nuclei are stained with DAPI (blue). Scale bar is 50 µm. E. Fluorescent staining of Alpers' and control cortical organoid (day 90) section using mitochondrial CI marker NDUFB10 and neural marker Tuj1. Nuclei are stained with DAPI (blue). Scale bar is 50 µm. F-M. Quantification of immunofluorescent staining of MAP2, CTIP2, SATB2, NEUN, GFAP, SOX2, Tuj1 and CI in Alpers' cortical organoids compared with controls. Nuclei are stained with DAPI (blue). Scale bar is 50 µm. The numbers of clones and replications in each experiment were listed in Table S 14.
Figure 6
Figure 6
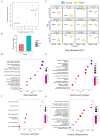
Transcriptomic status and dysregulated pathways of Alpers' patient derived cortical organoids. A. PCA analysis of transcriptomic expression data for Alpers' patient derived cortical organoids and controls. B. Number of upregulated and down-regulated DE genes in Alpers' cortical organoids compared with controls. C. RNA expressions of Mitochondrial encoded genes in Alpers' cortical organoids. D. Mitochondrial related pathways were downregulated in Alpers' cortical organoids. E. Synapse maturation related pathways were downregulated in Alpers' cortical organoids. F. Astrocytes and glial related pathways were upregulated in Alpers' cortical organoids. G. Neural inflammation related pathways were upregulated in Alpers' cortical organoids.
Figure 7
Figure 7
Long time treatment of NR partially rescues changes of Alpers' cortical organoids. A. Illustration of treatment of NR of Alpers' cortical organoids. B. Phase-contrast images of NR treatment of cortical organoids of Alpers' patient. Scale bar is 200 µm. C. Fluorescent staining of NR treated Alpers' cortical organoid section using neural fiber marker MAP2 and cortical neuronal markers SATB2, CTIP2. Nuclei are stained with DAPI (blue). Scale bar is 30 µm. D-F. Quantification of immunofluorescent staining of MAP2, SATB2 and CTIP2 in NR treated Alpers' cortical organoids compared with organoids without treatment. G. Fluorescent staining of NR treated Alpers' cortical organoid section using astrocyte marker GFAP, neural marker NeuN, and neural progenitor marker SOX2. Nuclei are stained with DAPI (blue). Scale bar is 50 µm. H-J. Quantification of immunofluorescent staining of NeuN, GFAP and SOX2 in NR treated Alpers' cortical organoids compared with organoids without treatment. K. Fluorescent staining of NR treated Alpers' cortical organoid section using complex I marker NDUFB10 and neural marker Tuj1. Nuclei are stained with DAPI (blue). Scale bar is 50 µm. L-M. Quantification of immunofluorescent staining of Tuj1 and complex I marker NDUFB10 in NR treated Alpers' cortical organoids compared with organoids without treatment. The numbers of clones and replications in each experiment were listed in Table S 14.
Figure 8
Figure 8
Transcriptomic data shows the treatment effect of NR on Alpers' cortical organoids. A. PCA analysis of transcriptomic expression data for NR, non-NR treated Alpers' cortical organoid and healthy controls. B. Mitochondrial related pathways were upregulated in NR treated Alpers' cortical organoids. C. Synapse maturation related pathways were upregulated in NR treated Alpers' cortical organoids. D. Astrocytes and glial related pathways were downregulated in NR treated Alpers' cortical organoids. E. Neural inflammation related pathways were downregulated in NR treated Alpers' cortical organoids. F. Heatmap showing the genes that were involved in significantly enriched synapse formation related pathways in NR treated Alpers' cortical organoids. X-axis on right panel represents log transformed fold change.

References

    1. Chrysostomou A, Grady JP, Laude A. et al. Investigating complex I deficiency in Purkinje cells and synapses in patients with mitochondrial disease. Neuropathol Appl Neurobiol. 2016;42(5):477–92. - PMC - PubMed
    1. ALPERS BJ. DIFFUSE PROGRESSIVE DEGENERATION OF THE GRAY MATTER OF THE CEREBRUM. Arch NeurPsych. 1931;25(3):469–505.
    1. Saneto RP, Cohen BH, Copeland WC. et al. Alpers-Huttenlocher syndrome. Pediatr Neurol. 2013;48(3):167–78. - PMC - PubMed
    1. Delarue A, Paut O, Guys JM. et al. Inappropriate liver transplantation in a child with Alpers-Huttenlocher syndrome misdiagnosed as valproate-induced acute liver failure. Pediatr Transplant. 2000;4(1):67–71. - PubMed
    1. Kayihan N, Nennesmo I, Ericzon BG. et al. Fatal deterioration of neurological disease after orthotopic liver transplantation for valproic acid-induced liver damage. Pediatr Transplant. 2000;4(3):211–4. - PubMed