Rapamycin inhibits B16 melanoma cell viability invitro and invivo by inducing autophagy and inhibiting the mTOR/p70‑S6k pathway
- PMID: 38385108
- PMCID: PMC10877231
- DOI: 10.3892/ol.2024.14273
Rapamycin inhibits B16 melanoma cell viability invitro and invivo by inducing autophagy and inhibiting the mTOR/p70‑S6k pathway
Abstract
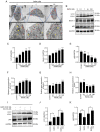
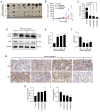
Rapamycin is an immunosuppressant that has been shown to prevent tumor growth following organ transplantation. However, its exact mode of antitumor action remains unknown. The present study used the B16-F10 (B16) murine melanoma model to explore the antitumor mechanism of rapamycin, and it was revealed that rapamycin reduced B16 cell viability in vitro and in vivo. In addition, in vitro and in vivo, the results of western blotting showed that rapamycin reduced Bcl2 expression, and enhanced the protein expression levels of cleaved caspase 3 and Bax, indicating that it can induce the apoptosis of B16 melanoma cells. Furthermore, the results of cell cycle analysis and western blotting showed that rapamycin induced B16 cell cycle arrest in the G1 phase, based on the reduction in the protein expression levels of CDK1, cyclin D1 and CDK4, as well as the increase in the percentage of cells in G1 phase. Rapamycin also significantly increased the number of autophagosomes in B16 melanoma cells, as determined by transmission electron microscopy. Furthermore, the results of RT-qPCR and western blotting showed that rapamycin upregulated the protein expression levels of microtubule-associated protein light chain 3 (LC3) and Beclin-1, while downregulating the expression of p62 in vitro and in vivo, thus indicating that rapamycin could trigger cellular autophagy. The present study revealed that rapamycin in combination with chloroquine (CQ) further increased LC3 expression compared with that in the CQ group, suggesting that rapamycin induced an increase in autophagy in B16 cells. Furthermore, the results of western blotting showed that rapamycin blocked the phosphorylation of p70 ribosomal S6 kinase (p70-S6k) and mammalian target of rapamycin (mTOR) proteins in vitro and in vivo, thus suggesting that rapamycin may exert its antitumor effect by inhibiting the phosphorylation of the mTOR/p70-S6k pathway. In conclusion, rapamycin may inhibit tumor growth by inducing cellular G1 phase arrest and apoptosis. In addition, rapamycin may exert its antitumor effects by inducing the autophagy of B16 melanoma cells in vitro and in vivo, and the mTOR/p70-S6k signaling pathway may be involved in this process.
Keywords: B16 melanoma cells; apoptosis; autophagy; cell cycle; mTOR/p70-S6k signaling pathway; rapamycin.
Copyright: © Wang et al.
Conflict of interest statement
The authors declare that they have no competing interests.
Figures


Similar articles
-
Selective interference of mTORC1/RAPTOR protects against human disc cellular apoptosis, senescence, and extracellular matrix catabolism with Akt and autophagy induction.Osteoarthritis Cartilage. 2017 Dec;25(12):2134-2146. doi: 10.1016/j.joca.2017.08.019. Epub 2017 Sep 6. Osteoarthritis Cartilage. 2017. PMID: 28888905
-
The KLF4-p62 axis prevents vascular endothelial cell injury via the mTOR/S6K pathway and autophagy in diabetic kidney disease.Endokrynol Pol. 2022;73(5):837-845. doi: 10.5603/EP.a2022.0072. Endokrynol Pol. 2022. PMID: 36621906
-
Tanshinone IIA induces autophagic cell death via activation of AMPK and ERK and inhibition of mTOR and p70 S6K in KBM-5 leukemia cells.Phytother Res. 2014 Mar;28(3):458-64. doi: 10.1002/ptr.5015. Epub 2013 Jun 27. Phytother Res. 2014. PMID: 23813779
-
Sinomenine inhibits the growth of melanoma by enhancement of autophagy via PI3K/AKT/mTOR inhibition.Drug Des Devel Ther. 2018 Aug 6;12:2413-2421. doi: 10.2147/DDDT.S155798. eCollection 2018. Drug Des Devel Ther. 2018. PMID: 30122899 Free PMC article.
-
Hernandezine Regulates Proliferation and Autophagy-Induced Apoptosis in Melanoma Cells.J Nat Prod. 2022 May 27;85(5):1351-1362. doi: 10.1021/acs.jnatprod.2c00098. Epub 2022 May 11. J Nat Prod. 2022. PMID: 35544345 Review.
Cited by
-
mTORC1 regulates the proliferation of SOX9+ porcine skin-derived stem cells (pSDSCs) by promoting S6K phosphorylation.Histochem Cell Biol. 2025 Jan 20;163(1):25. doi: 10.1007/s00418-025-02354-9. Histochem Cell Biol. 2025. PMID: 39833550
-
The Influence of Autophagy-Modulating Drugs on the Expression of Markers Associated with Cancer-Associated Fibroblasts and Epithelial-Mesenchymal Transition in a Mouse Model of Skin Melanoma.Bull Exp Biol Med. 2025 Apr;178(6):769-773. doi: 10.1007/s10517-025-06414-x. Epub 2025 May 30. Bull Exp Biol Med. 2025. PMID: 40445543
-
Bibliometric analysis of autophagy in the diagnosis and treatment of osteosarcoma: a bibliometric analysis (2007-2023).Cancer Biol Ther. 2025 Dec;26(1):2484825. doi: 10.1080/15384047.2025.2484825. Epub 2025 Mar 27. Cancer Biol Ther. 2025. PMID: 40146196 Free PMC article.
-
Antagonistic roles for MITF and TFE3 in melanoma plasticity.Cell Rep. 2025 Apr 22;44(4):115474. doi: 10.1016/j.celrep.2025.115474. Epub 2025 Mar 25. Cell Rep. 2025. PMID: 40138313 Free PMC article.
-
Antagonistic Roles for MITF and TFE3 in Melanoma Plasticity.bioRxiv [Preprint]. 2025 Feb 18:2024.07.11.603140. doi: 10.1101/2024.07.11.603140. bioRxiv. 2025. Update in: Cell Rep. 2025 Apr 22;44(4):115474. doi: 10.1016/j.celrep.2025.115474. PMID: 39026725 Free PMC article. Updated. Preprint.
References
LinkOut - more resources
Full Text Sources
Research Materials
Miscellaneous
