. 2024 Aug 1;109(8):2606-2618.
doi: 10.3324/haematol.2023.284443.

A NOTCH3-CXCL12-driven myeloma-tumor niche signaling axis promotes chemoresistance in multiple myeloma

Affiliations

A NOTCH3-CXCL12-driven myeloma-tumor niche signaling axis promotes chemoresistance in multiple myeloma

Hayley M Sabol et al. Haematologica. .

Abstract

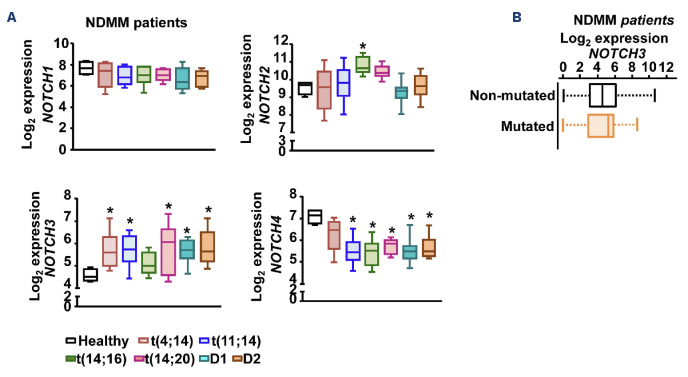
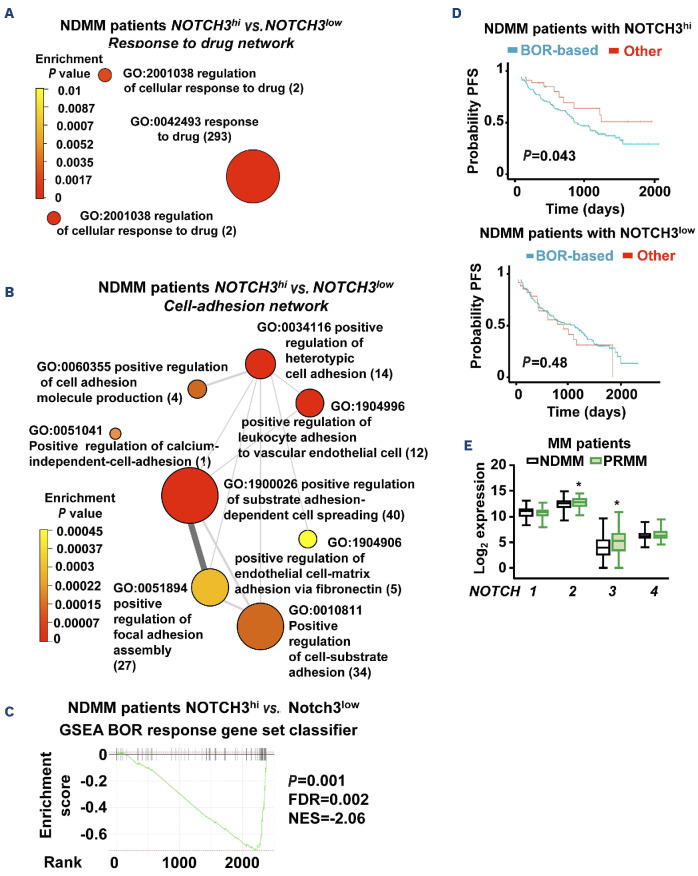
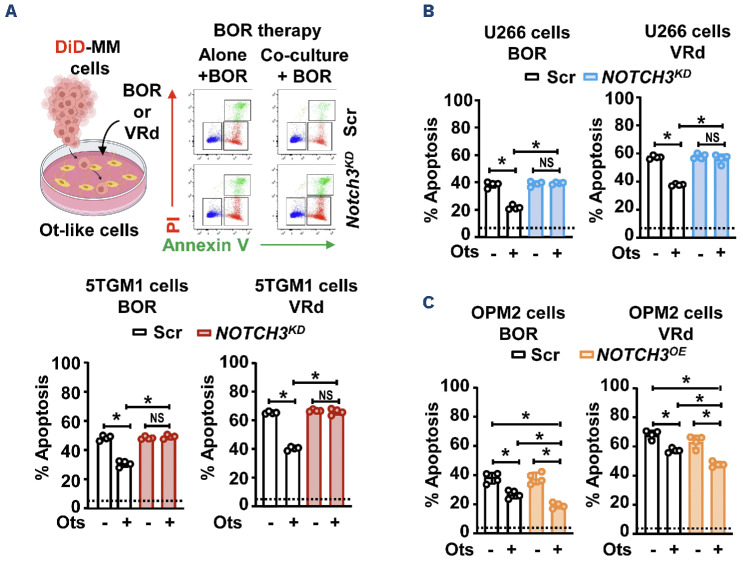
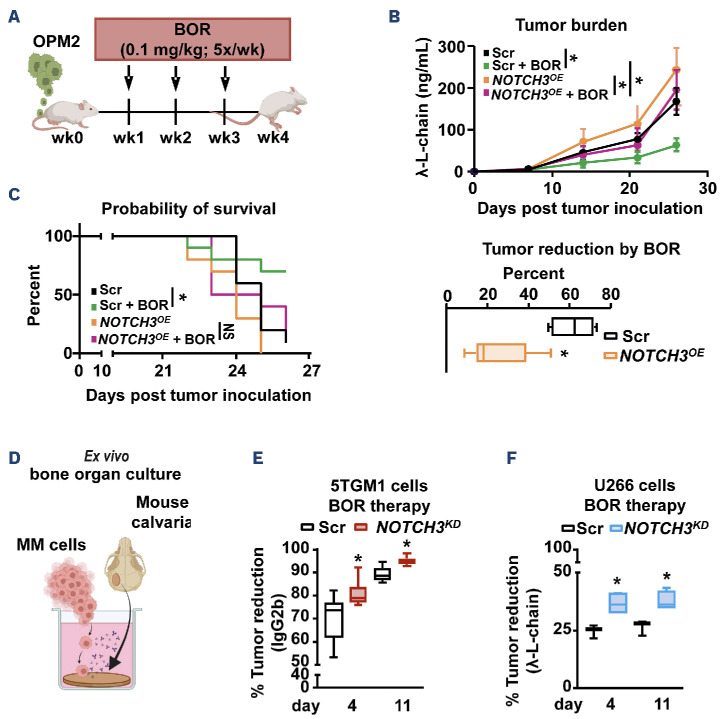
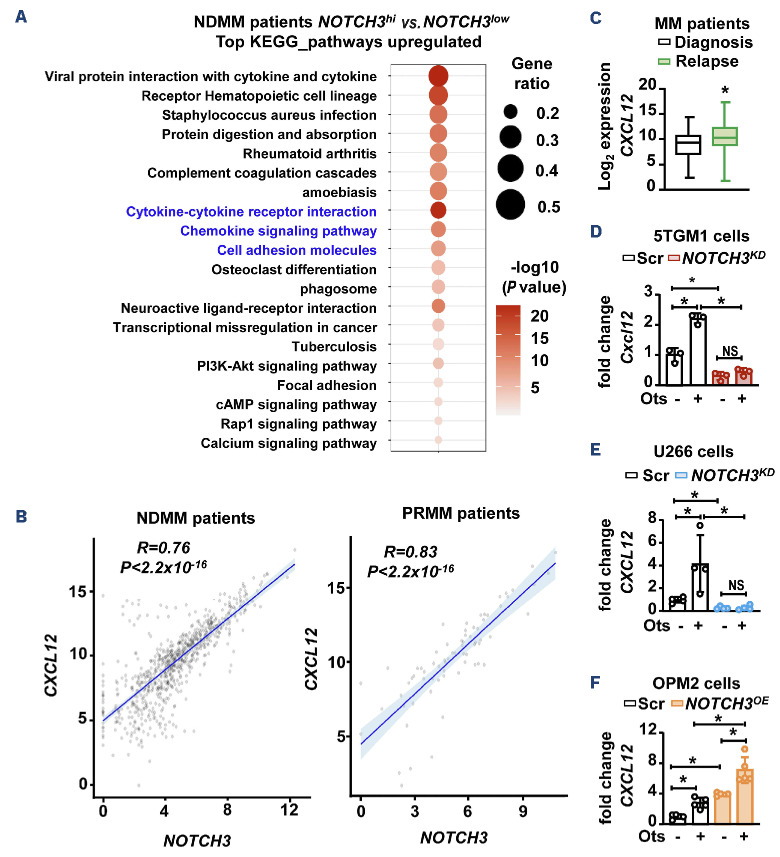
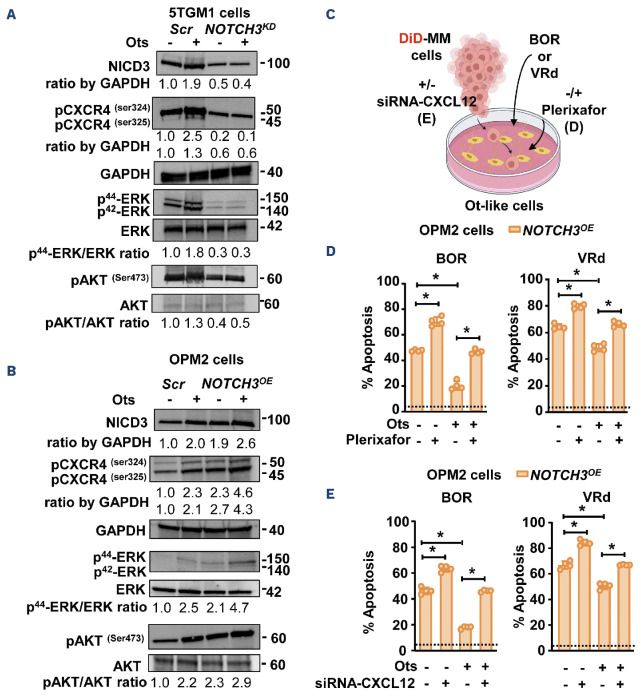
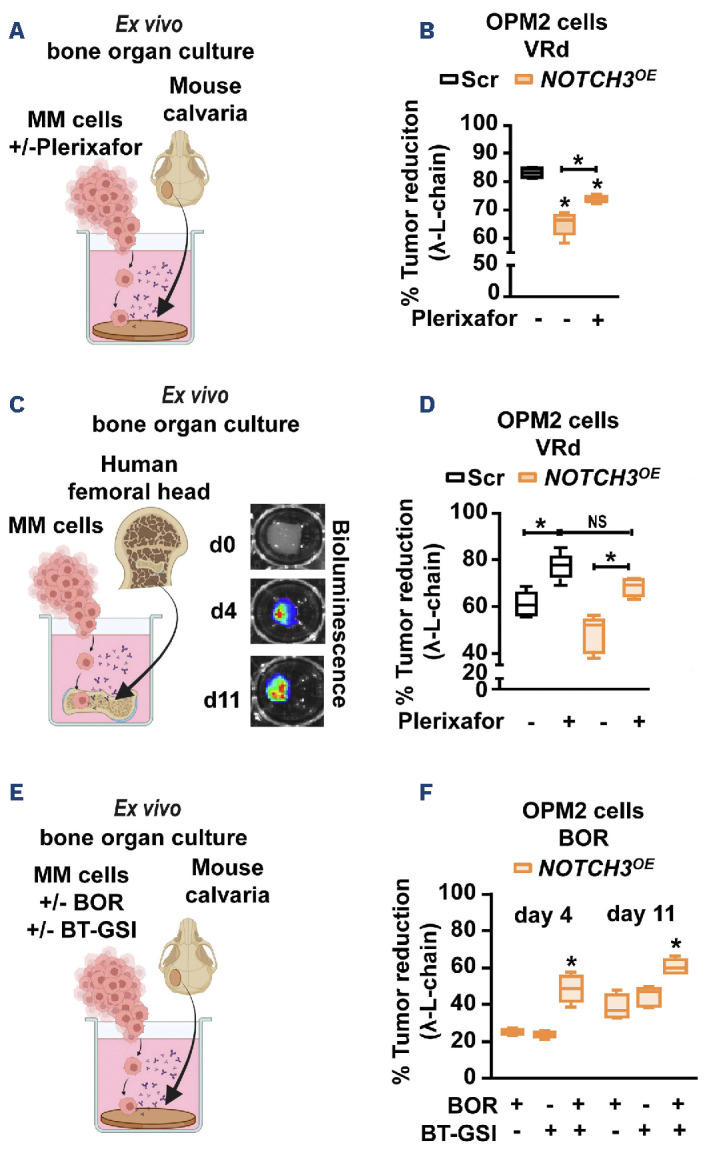
Multiple myeloma (MM) remains incurable due to disease relapse and drug resistance. Notch signals from the tumor microenvironment (TME) confer chemoresistance, but the cellular and molecular mechanisms are not entirely understood. Using clinical and transcriptomic datasets, we found that NOTCH3 is upregulated in CD138+ cells from newly diagnosed MM (NDMM) patients compared to healthy individuals and increased in progression/relapsed MM (PRMM) patients. Further, NDMM patients with high NOTCH3 expression exhibited worse responses to bortezomib (BOR)-based therapies. Cells of the TME, including osteocytes, upregulated NOTCH3 in MM cells and protected them from apoptosis induced by BOR. NOTCH3 activation (NOTCH3OE) in MM cells decreased BOR anti-MM efficacy and its ability to improve survival in in vivo myeloma models. Molecular analyses revealed that NDMM and PRMM patients with high NOTCH3 exhibit CXCL12 upregulation. TME cells upregulated CXCL12 and activated the CXCR4 pathway in MM cells in a NOTCH3-dependent manner. Moreover, genetic or pharmacologic inhibition of CXCL12 in NOTCH3OE MM cells restored sensitivity to BOR regimes in vitro and in human bones bearing NOTCH3OE MM tumors cultured ex vivo. Our clinical and preclinical data unravel a novel NOTCH3-CXCL12 pro-survival signaling axis in the TME and suggest that osteocytes transmit chemoresistance signals to MM cells.


Figures

Figure 1.
Figure 1.
NOTCH3 expression is increased in newly diagnosed multiple myleoma patients and regulated by the cells of the tumor niche. (A) Gene expression of NOTCH 1-4 receptors in CD138+ cells from newly diagnosed multiple myeloma (NDMM) or healthy donors. N=52 patients. *P<0.05 versus healthy donors by one-way ANOVA, followed by a Tukey post hoc test. Boxes show the data interquartile range, the middle line in the box represents the median, and whiskers the 95% confidence interval of the mean. (B) NOTCH3 gene expression in CD138+ cells from NDMM patients with or without point mutations in the NOTCH3 gene. N=725 (12 with mutations) NDMM patients.
Figure 2.
Figure 2.
NOTCH3 expression is increased in relapsed multiple myleoma patients and correlates with poor responses to bortezomib-based therapies. Network plot of selected upregulated functional enrichment analysis of gene ontology (GO) terms related to (A) responses to drugs or (B) cell-adhesion in CD138+ cells from newly diagnosed multiple myeloma (NDMM) patients with high versus low NOTCH3 expression. The size of the circles represents the number of genes in the individual GO terms. The thickness of the lines represents the number of overlapped genes between the individual GO terms. (C) Gene set enrichment analysis (GSEA) shows NDMM patients with high NOTCH3 have enrichment in genes involved in poor responses to bortezomib (BOR) therapy in MM patients compared to NDMM patients with low NOTCH3 expression. Data were analyzed using a weighted Kolmogorov-Smirnov-like statistical test. (D) Kaplan-Meier plot of the progression-free survival (PFS) of NDMM patients with high (top) versus low (bottom) NOTCH3 expression receiving BOR-based (blue line) versus other therapies (other) not including BOR (red line). N=708 patients. Data were analyzed using a log-rank (Mantel-Cox) test. (E) Gene expression of NOTCH 1-4 receptors in CD138+ cells from paired diagnosis (NDMM) and progression/relapsed MM (PRMM) patients. N=70/group. *P<0.05 versus diagnosis by Student’s t test. Boxes show the data interquartile range, the middle line in the box represents the median, and whiskers the 95% confidence interval of the mean. FDR: false discovery rate; NES: normalized enrichment score.
Figure 3.
Figure 3.
NOTCH3 integrates tumor micorenvironment-mediated signals dictating multiple myeloma cell responses to bortezomibbased therapies. (A) Multiple myeloma (MM) cells were co-cultured with osteocytes (Ots) and treated with bortezomib (BOR; 48 hours [h]) or dexamethasone + BOR + lenalidomide (VRd; 24 h). Percent apoptosis in scramble (Scr) or NOTCH3 knockdown (NOTCH3KD) 5TGM1 or U266 (B) MM cells, and in Scr or NOTCH3-activated (NOTCH3OE) OPM2 (C) MM cells co-cultured in the absence/presence of Ots and treated with/without BOR or VRd. N=4/group. *P<0.05 by two-way ANOVA, followed by a Tukey post hoc test. The dotted line represents the percent apoptosis in vehicle-treated Scr MM cells cultured alone. NS: non-significant. Data are shown as mean ± standard deviation; each dot represents an independent sample. Representative experiments out of 2 are shown. DiD: cell label dye; PI: propidium iodide.
Figure 4.
Figure 4.
NOTCH3 activation in multiple myeloma cells promotes chemoresistance to bortezomib therapy. (A) Experimental design. Tumor progression and bortezomib (BOR)-induced tumor reduction (B) and probability of survival (C) in mice injected with scramble (Scr) or NOTCH3-activated (NOTCH3OE) OPM2 MM cells treated with/without BOR. N=6/11 mice/group. A two-way ANO-VA test was used for (B, endpoint), followed by a Tukey post hoc test. Tumor reduction by BOR therapy by Student’s t test, *P<0.05 versus mice bearing Scr tumors treated with BOR. For (C), a log-rank (Mantel-Cox) test was performed. (D) Tumor reduction by BOR in ex vivo organ cultures of calvarial disc bones from KaLwRijHsd bearing murine 5TGM1 (E) or NSG mice bearing human U266 (F) Scr/NOTCH3 knockdown (NOTCH3KD) MM cells. N=4-8/group. *P<0.05 versus Scr MM cells treated with BOR by Student’s t test for each time point. NS: non-significant. wk: week. Boxes show the data interquartile range, the middle line in the box represents the median, and whiskers the 95% confidence interval of the mean (D, E, F).
Figure 5.
Figure 5.
Activation of NOTCH3 transcriptional reprogramming by the tumor microenvironment increases CXCL12 expression in multiple myeloma cells. Top 20 most significantly upregulated pathways (A) in newly diagnosed multiple myeloma (NDMM) patients with high versus low NOTCH3 expression. N=768 patients. (B) CXCL12 and NOTCH3 expression correlation in CD138+ cells from NDMM and progression/relapsed (PRMM) patients. N=70/group. For (B), Pearson’s correlation tests were performed. (C) Gene expression of CXCL12 in CD138+ cells from paired diagnosis and relapsed MM patients. N=70/group. *P<0.05 versus diagnosis by Student’s t test. Boxes show the data interquartile range, the middle line in the box represents the median, and whiskers the 95% confidence interval of the mean. CXCL12 gene expression in scramble (Scr)/NOTCH3 knockdown (NOTCH3KD) 5TGM1 (D) or U266 (E) MM cells and Scr/NOTCH3 activated (NOTCH3OE) OPM2 (F) MM cells cultured in the absence/presence of osteocytes (Ots). N=4/group. *P<0.05 by two-way ANOVA, followed by a Tukey post hoc test. NS: non-significant. Data are shown as mean ± standard deviation; each dot represents an independent sample; representative experiments out of 2 are shown (F).
Figure 6.
Figure 6.
NOTCH3-CXCL12-CXCR4 signaling mediates tumor microenvironment-induced chemoresistance in multiple myeloma cells. Effects of osteocytes (Ots) and manipulation of NOTCH3 signaling in MM cells on protein levels of activated NOTCH3 receptor (NICD3), phosphorylated (p) CXCR4, pERK, pAKT in (A) scramble (Scr)/NOTCH3 knockdown (NOTCH3KD) 5TGM1 MM cells and (B) Scr/NOTCH3-activated (NOTCH3OE) OPM2 MM cells. Representative images from 3 independent experiments are shown (see Online Supplementary Figure S11). (C) Experimental design. (D) Percent apoptosis of OPM2 NOTCH3OE MM cells treated with/ without plerixafor, bortezomib (BOR), or dexamethasone + BOR + lenalidomide (VRd) in the absence/presence of Ots. N=4/group; BOR=48 hours (h), VRd=24h. (E) Percent apoptosis of OPM2 NOTCH3OE MM cells with/without CXCL12 silencing and treated with BOR or VRd in the absence/presence of Ots. *P<0.05 by two-way ANOVA, followed by a Tukey post hoc test. The dotted line represents the percent apoptosis in vehicle-treated OPM2 NOTCH3OE MM cells cultured alone. NS: non-significant. DiD: cell label dye. siRNA: small interference RNA. Data are shown as mean ± standard deviation; each dot represents an independent sample; representative experiments out of 2 are shown.
Figure 7.
Figure 7.
Pharmacological inhibition of CXCL12-CXCR4 or Notch signaling enhances therapeutic responses to bortezomib-based therapy in NOTCH3-activated multiple myeloma cells. (A) Ex vivo bone-multiple myeloma (MM) organ cultures established with scramble (Scr)/ NOTCH3-activated (NOTCH3OE) OPM2 human MM cells and calvarial disc bones from NSG mice. (B) Percent tumor reduction by co-administration of dexamethasone + bortezomib (BOR) + lenalidomide (VRd) and plerixafor. N=6/group. *P<0.05 versus bones bearing Scr MM cells treated with VRd alone for 11 days by one-way ANOVA, followed by a Tukey post hoc test. (C) Ex vivo bone-MM organ cultures established with Scr/NOTCH3OE OPM2 human MM cells and femoral head bone fragments from healthy human donors. Representative bioluminescence images of human bones showing engraftment and growth of human MM cells through the length of the experiment. (D) Percent tumor reduction by co-administration of VRd and plerixafor. N=6/group. *P<0.05 by two-way ANOVA, followed by a Tukey post hoc test. (E) Ex vivo bone-MM organ cultures established with NOTCH3OE OPM2 human MM cells and calvarial disc bones from NSG mice. (F) Percent tumor reduction by co-administration of BOR and bone-targeted γ-secretase inhibitor (BT-GSI) after 4 and 11 days. N=6/group. *P<0.05 versus bones bearing NOTCH3OE MM cells treated with BOR alone by one-way ANOVA, followed by a Tukey post hoc test. NS: non-significant. Boxes show the interquartile range, the middle line in the box represents the median, and whiskers the 95% confidence interval of the mean. d: day.

References

    1. Rajkumar SV, Kumar S. Multiple myeloma current treatment algorithms. Blood Cancer J. 2020;10(9):94. - PMC - PubMed
    1. Maiso P, Mogollón P, Ocio EM, Garayoa M. Bone marrow mesenchymal stromal cells in multiple myeloma: their role as active contributors to myeloma progression. Cancers (Basel). 2021;13(11):2542. - PMC - PubMed
    1. Ria R, Vacca A. Bone marrow stromal cells-induced drug resistance in multiple myeloma. Int J Mol Sci. 2020;21(2):613. - PMC - PubMed
    1. Nefedova Y, Landowski TH, Dalton WS. Bone marrow stromal-derived soluble factors and direct cell contact contribute to de novo drug resistance of myeloma cells by distinct mechanisms. Leukemia. 2003;17(6):1175-1182. - PubMed
    1. Colombo M, Galletti S, Garavelli S, et al. . Notch signaling deregulation in multiple myeloma: a rational molecular target. Oncotarget. 2015;6(29):26826-26840. - PMC - PubMed

Publication types