. 2024 Feb;30(2):e14592.
doi: 10.1111/cns.14592.

Cellular iron depletion enhances behavioral rhythm by limiting brain Per1 expression in mice

Affiliations

Cellular iron depletion enhances behavioral rhythm by limiting brain Per1 expression in mice

Qiong Wu et al. CNS Neurosci Ther. 2024 Feb.

Abstract

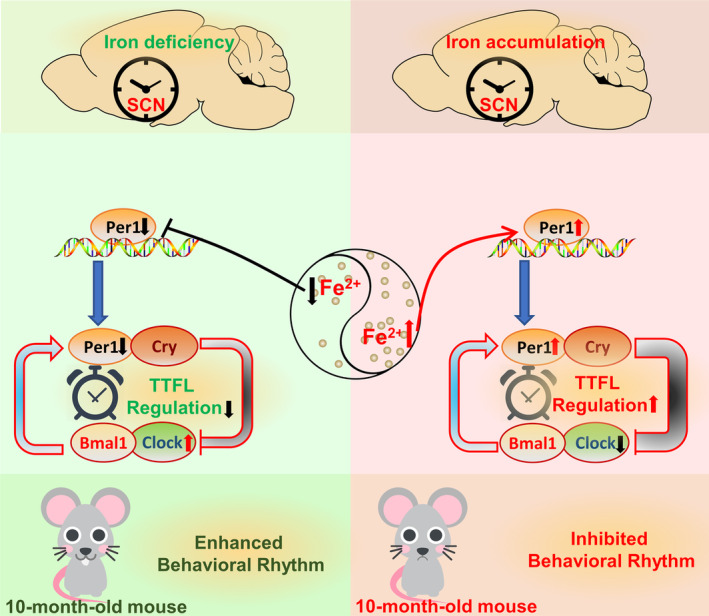
Aims: Disturbances in the circadian rhythm are positively correlated with the processes of aging and related neurodegenerative diseases, which are also associated with brain iron accumulation. However, the role of brain iron in regulating the biological rhythm is poorly understood. In this study, we investigated the impact of brain iron levels on the spontaneous locomotor activity of mice with altered brain iron levels and further explored the potential mechanisms governing these effects in vitro.

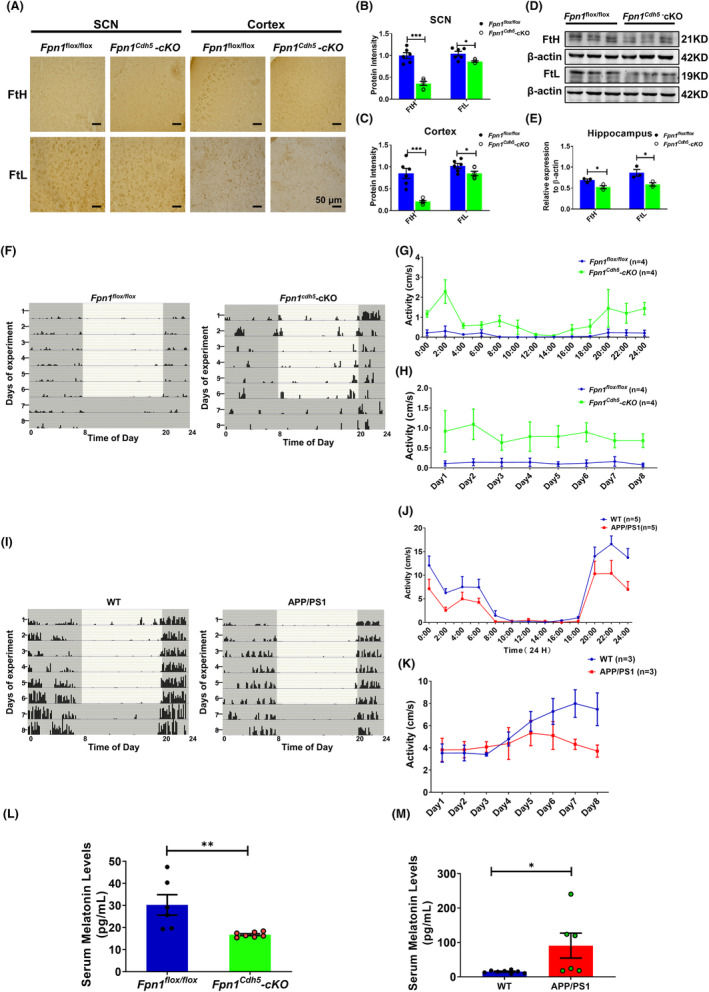
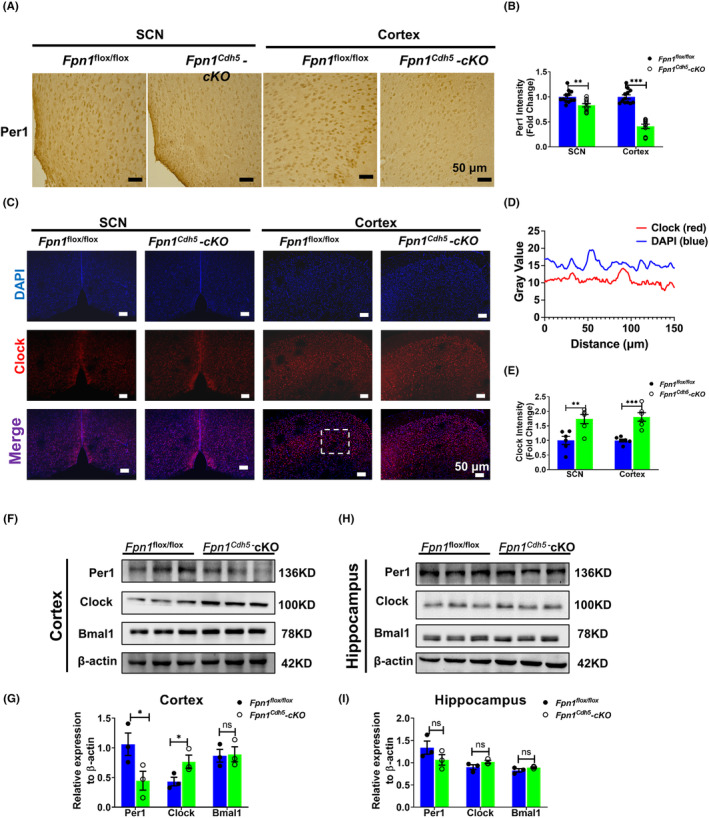
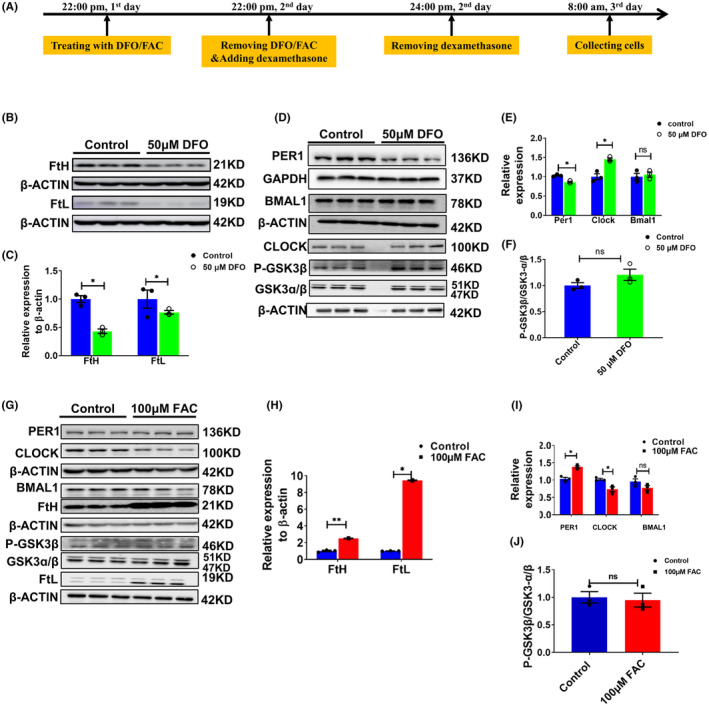
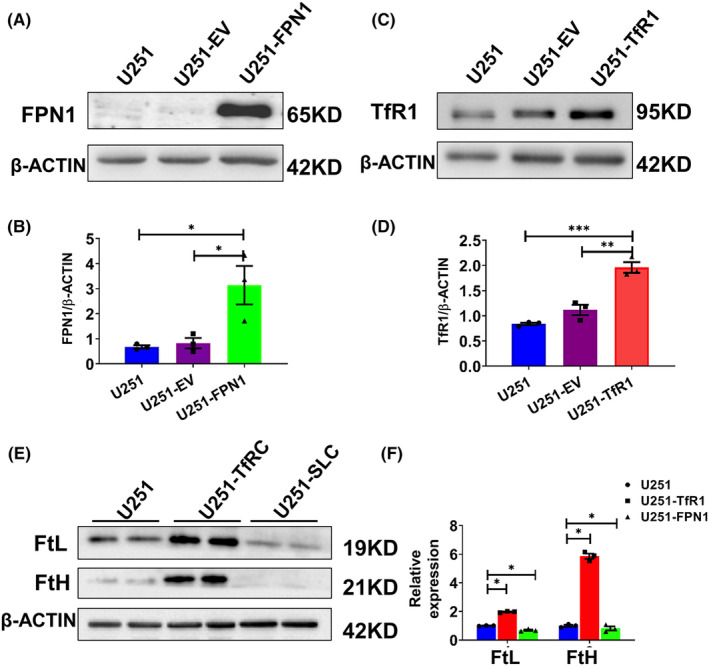
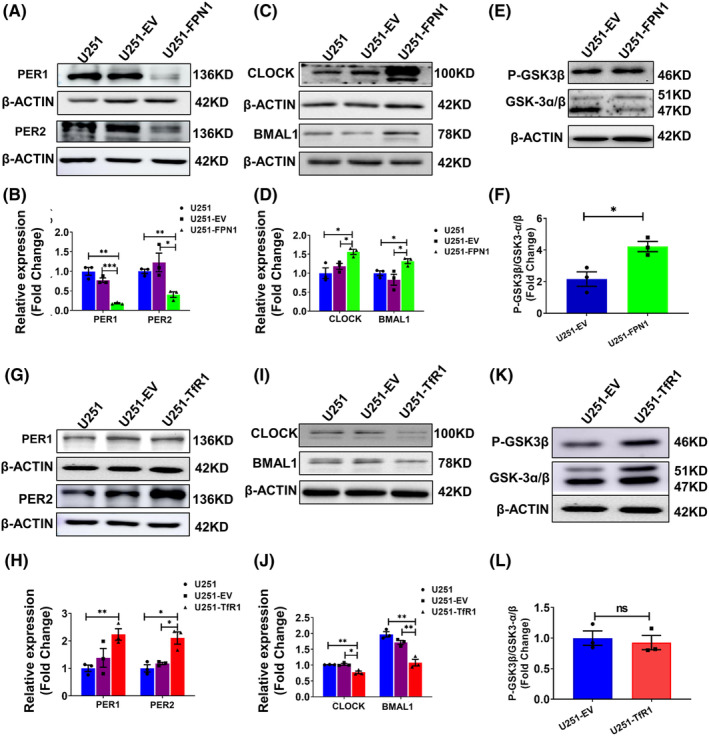
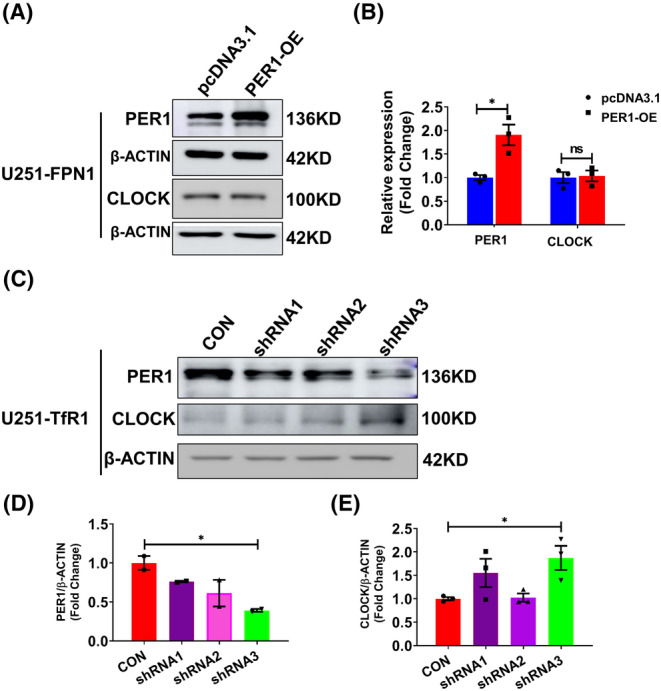
Results: Our results revealed that conditional knockout of ferroportin 1 (Fpn1) in cerebral microvascular endothelial cells led to brain iron deficiency, subsequently resulting in enhanced locomotor activity and increased expression of clock genes, including the circadian locomotor output cycles kaput protein (Clock) and brain and muscle ARNT-like 1 (Bmal1). Concomitantly, the levels of period circadian regulator 1 (PER1), which functions as a transcriptional repressor in regulating biological rhythm, were decreased. Conversely, the elevated brain iron levels in APP/PS1 mice inhibited autonomous rhythmic activity. Additionally, our findings demonstrate a significant decrease in serum melatonin levels in Fpn1cdh5 -CKO mice compared with the Fpn1flox/flox group. In contrast, APP/PS1 mice with brain iron deposition exhibited higher serum melatonin levels than the WT group. Furthermore, in the human glioma cell line, U251, we observed reduced PER1 expression upon iron limitation by deferoxamine (DFO; iron chelator) or endogenous overexpression of FPN1. When U251 cells were made iron-replete by supplementation with ferric ammonium citrate (FAC) or increased iron import through transferrin receptor 1 (TfR1) overexpression, PER1 protein levels were increased. Additionally, we obtained similar results to U251 cells in mouse cerebellar astrocytes (MA-c), where we collected cells at different time points to investigate the rhythmic expression of core clock genes and the impact of DFO or FAC treatment on PER1 protein levels.

Conclusion: These findings collectively suggest that altered iron levels influence the circadian rhythm by regulating PER1 expression and thereby modulating the molecular circadian clock. In conclusion, our study identifies the regulation of brain iron levels as a potential new target for treating age-related disruptions in the circadian rhythm.

Keywords: Per1; aging; circadian rhythm; clock genes; iron.


Conflict of interest statement

The authors declare that they have no conflicts of interest.

Figures

FIGURE 1
FIGURE 1
Altered expression of FtH and FtL in Fpn1 Cdh5 ‐cKO mice and the locomotor activity of Fpn1 Cdh5 ‐cKO and APP/PS mice. The distribution and expression of FtH and FtL were detected by immunohistochemistry (IHC); the representative IHC results of FtH and FtL staining in the SCN and cortex regions are shown in (A). Scale bar = 50 μm. (B, C) Quantitative analysis of the protein intensities of FtH and FtL in the SCN and cortex regions from two separate fields for each mouse. The data are presented as the mean ± SEM, n = 3. (D) Hippocampal FtH and FtL proteins, as evaluated by western blot analysis. (E) Quantitative analysis of FtH and FtL protein levels from the western blot data, compared to the Fpn1 flox/flox group, after normalizing to the respective β‐actin expression. The data are presented as the mean ± SEM, n = 3. The locomotor activities of the mice were measured using a Mouse Wheel Running Activity Monitoring System. The monitoring data represent the distance traveled for each animal per second (cm/s). (F, I) Representative double‐plotted actograms of spontaneous locomotor activity of Fpn1 flox/flox and Fpn1 Cdh5 ‐cKO mice (F) or WT (control) and APP/PS1 mice (I) that were kept in a standard photoperiod of 12 h light (L) and 12 h dark (D) for 6 days, followed by 48 h of constant darkness. In these plots, black bars indicate activity and gray boxes indicate periods of darkness. (G) Average autonomous activities of the Fpn1 flox/flox and Fpn1 Cdh5 ‐cKO mice from 12:00 a.m. to 12:00 p.m. (H) Total activity of the Fpn1 flox/flox and Fpn1 Cdh5 ‐cKO mice per day during the experimental period. (J, K) Daily (J) and total (K) activities for the WT and APP/PS1 mice. (L, M) Serum melatonin levels in the indicated groups. All the data are presented as the mean ± SEM. The numbers of mice (n) for each group are indicated in (G, H), (J, K), and (L, M). Statistical analysis was performed using a two‐tailed Student's t‐test; *p < 0.05, **p < 0.01, ***p < 0.001, compared with the Fpn1 flox/flox group or the WT group.
FIGURE 2
FIGURE 2
Distribution and expression of Per1 and Clock in the SCN, cortex, and hippocampus regions of Fpn1 flox/flox and Fpn1 Cdh5 ‐cKO mice. (A) Per1 distribution in the SCN and cortex, as detected by IHC. (B) Average intensity of Per1 in these regions, for each mouse. The data were calculated from four separate fields. The data are presented as the mean ± SEM, n = 3. Scale bar = 50 μm. (C) Double‐immunofluorescence assays were performed to detect the distribution and expression of Clock in the SCN and cortex. Scale bar = 50 μm. (D) The intensity profile (dashed box in panel C of the signals from both fluorescent channels indicates the colocalization of Clock and DAPI). (E) Quantified average intensity of Clock in the SCN and Cortex regions from two separate fields for each mouse. The data are presented as the mean ± SEM, n = 3. (F–I) Representative western blots for the expression levels of Per1, Clock, and Bmal1 in the cortex (F) and hippocampus (H) and quantification of the western blot analysis results in the cortex (G) and hippocampus (I). The data are presented as the mean ± SEM, n = 3. Statistical analysis was performed using a two‐tailed Student's t‐test; *p < 0.05, **p < 0.01, ***p < 0.001, compared with the Fpn1 flox/flox group, “ns” refers to no significance.
FIGURE 3
FIGURE 3
Altered expression of PER1, CLOCK, BMAL1 and P‐GSK3β in U251 cells treated with 50 μM DFO or 100 μM FAC at 8 am. (A) Schematic illustration of the treatment of cells with DFO or FAC; the cells were collected and detected at 8 a.m. (B) Representative western blot analysis results for FtH and FtL in U251 cells treated with 50 μM DFO. (C) Statistical analysis of the results from the experiment presented in panel B. FtH and FtL were compared to the control group after normalizing to the respective β‐ACTIN expression. (D) Protein levels of PER1, CLOCK, BMAL1 and p‐GSK3β, as detected by western blot analysis. (E) Statistical analysis of the results of the experiment shown in panel D. (F) Statistical analysis of phosphorylated GSK3β levels. The data represented in panels E and F were quantified after normalizing to the respective GAPDH or β‐ACTIN expression. (G) Representative western blot analysis results for PER1, CLOCK, BMAL1 FtH, p‐GSK3β, GSK3α/β and FtL, as detected by western blot analysis, in U251 cells treated with 100 μM FAC for 24 h. (H) Statistical analysis of FtH and FtL compared to the control group after normalizing to the respective β‐ACTIN expression. (I) Quantification of the results of PER1, CLOCK, and BMAL1 protein expression. (J) Statistical analysis of P‐GSK3β levels. The data represented in panels I and J were quantified after normalizing to β‐ACTIN expression. The data are presented as the mean ± SEM, n = 3. Statistical analysis was performed using a two‐tailed Student's t‐test; *p < 0.05, **p < 0.01 compared to the Control group. “ns” refers to no significance.
FIGURE 4
FIGURE 4
Construction and verification of U251 cells endogenously overexpressing FPN1 and TfR1. After generating U251 cells stably overexpressing FPN1 or TfR1, we evaluated the protein levels of FPN1 and TfR1 by western blot analysis. (A, C) Western blot analysis results for FPN1 and TfR1 in U251, U251 cells transfected with empty vector (U251‐EV), and U251 cells overexpressing FPN1 (U251‐FPN1) or TfR1 (U251‐TfR1). (B, D) Quantification of the results of the experiments presented in panels A and C. The protein levels were normalized to β‐ACTIN expression. The data are presented as the mean ± SEM, n = 3. Statistical analysis was performed using a two‐tailed Student's t‐test; *p < 0.05, **p < 0.01, ***p < 0.001. (E) Western blot analysis results for FtL and FtH expression in U251‐TfR1 and U251‐FPN1 cells. (F) Statistical analysis for FtH and FtL compared to the U251 group after normalizing to the respective β‐ACTIN expression. The data are presented as the mean ± SEM, n = 3. Statistical analysis was performed using a two‐tailed Student's t‐test; *p < 0.05.
FIGURE 5
FIGURE 5
Protein levels of PER1, PER2, CLOCK, BMAL1, and p‐GSK3β in U251‐FPN1 and U251‐TfR1 cells. (A) Western blot analysis results for PER1, PER2 in U251 cells, U251 cells with empty vector (U251‐EV), and U251 cells overexpressing FPN1 (U251‐FPN1). (C) Representative western blot analysis of CLOCK and BMAL1 in these three groups. (E) Levels of phosphorylated GSK3β and GSK‐3α/β in the U251‐EV and U251‐FPN1 groups. (B, D, F) Statistical analysis of the expression of the indicated proteins compared to the U251 or U251‐EV group after normalizing to the respective β‐ACTIN expression. The data are presented as the mean ± SEM, n = 3. (G, I) Representative western blot analysis results for PER1, PER2, BMAL1, and CLOCK in U251, U251‐EV, and U251 cells overexpressing TfR1 (U251‐TfR1). (K) Levels of phosphorylated GSK3β in the indicated groups. (H, J, L) Statistical analysis for the indicated proteins compared to the U251 or U251‐EV group after normalizing to the respective β‐ACTIN expression. The data are presented as the mean ± SEM, n = 3. Statistical analysis was performed using a two‐tailed Student's t‐test; *p < 0.05, **p < 0.01, “ns” refers to no significance.
FIGURE 6
FIGURE 6
Expression levels of CLOCK protein in U251‐FPN1 and U251‐TfR1 cells with modified Per1 expression. (A) Representative western blot analysis results of PER1 and CLOCK in U251‐FPN1 cells overexpressing PER1. (B) Quantification of the experiment presented in panel A. The data are presented as the mean ± SEM after normalizing to the respective β‐ACTIN expression, n = 3. (C) Western blot analysis results of PER1 and CLOCK proteins in U251‐TfR1 cells with inhibited expression of PER1 using Per1‐shRNAs. (D, E) Quantified results of PER1 and CLOCK expression from the experiment shown in panel C. The data are presented as the mean ± SEM after normalizing to the respective β‐ACTIN expression. n = 3, *p < 0.05, “ns” refers to no significance.
FIGURE 7
FIGURE 7
Schematic representation of the proposed molecular mechanism of diverse brain iron levels in circadian clock regulation. Decreased brain iron levels can inhibit the expression of Per1, which further inhibits TTFL regulation, resulting in elevated Clock protein and an enhancement of the behavioral rhythm. On the contrary, accumulated iron can induce increased Per1 level, therefore strengthening TTFL regulation, finally inhibiting rhythmic activity.

Similar articles

Cited by

References

    1. Hoyt KR, Obrietan K. Circadian clocks, cognition, and Alzheimer's disease: synaptic mechanisms, signaling effectors, and chronotherapeutics. Mol Neurodegener. 2022;17:35. - PMC - PubMed
    1. Liu PY, Reddy RT. Sleep, testosterone and cortisol balance, and ageing men. Rev Endocr Metab Disord. 2022;23:1323‐1339. - PMC - PubMed
    1. Mehra R, Chung MK, Olshansky B, et al. Sleep‐disordered breathing and cardiac arrhythmias in adults: mechanistic insights and clinical implications: a scientific Statement from the American Heart Association. Circulation. 2022;146:e119‐e136. - PMC - PubMed
    1. Nassan M, Videnovic A. Circadian rhythms in neurodegenerative disorders. Nat Rev Neurol. 2022;18:7‐24. - PubMed
    1. Castro‐Zavala A, Alegre‐Zurano L, Cantacorps L, et al. Bmal1‐knockout mice exhibit reduced cocaine‐seeking behaviour and cognitive impairments. Biomed Pharmacother. 2022;153:113333. - PubMed

Publication types