. 2024 Feb 22;147(1):44.
doi: 10.1007/s00401-024-02694-1.

MET receptor serves as a promising target in melanoma brain metastases

Affiliations

MET receptor serves as a promising target in melanoma brain metastases

Torben Redmer et al. Acta Neuropathol. .

Erratum in

Abstract

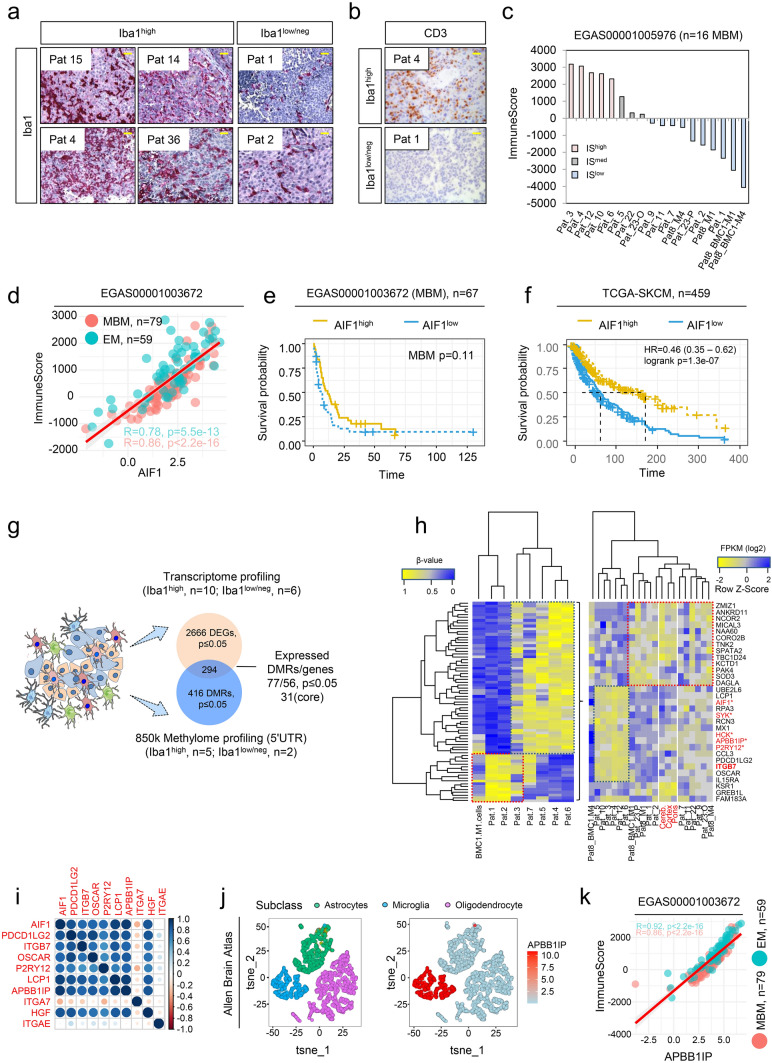
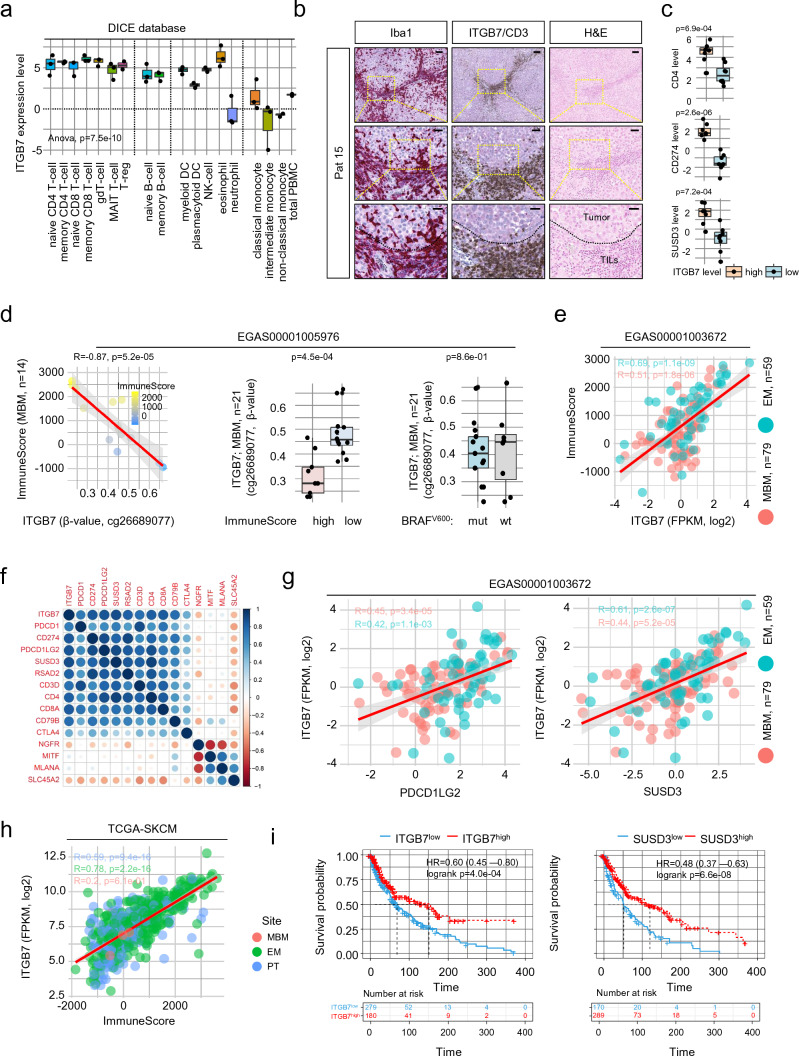
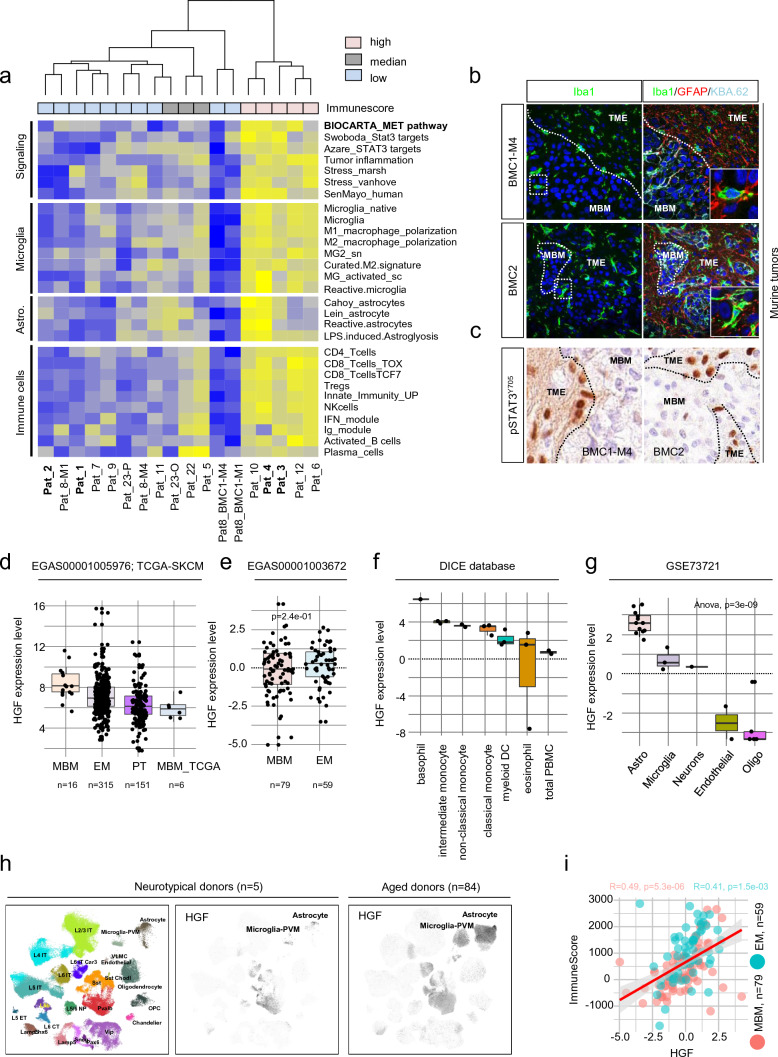
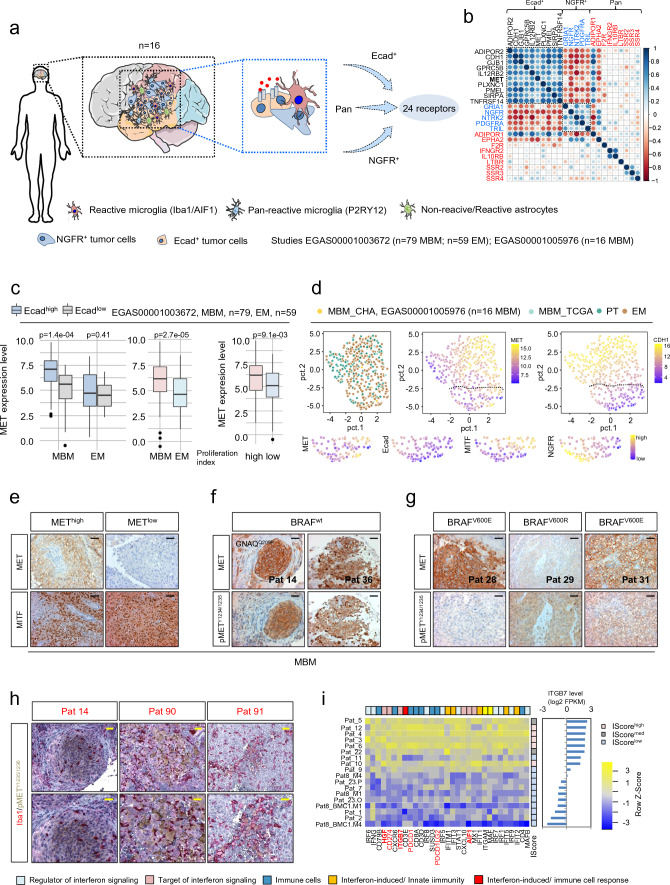
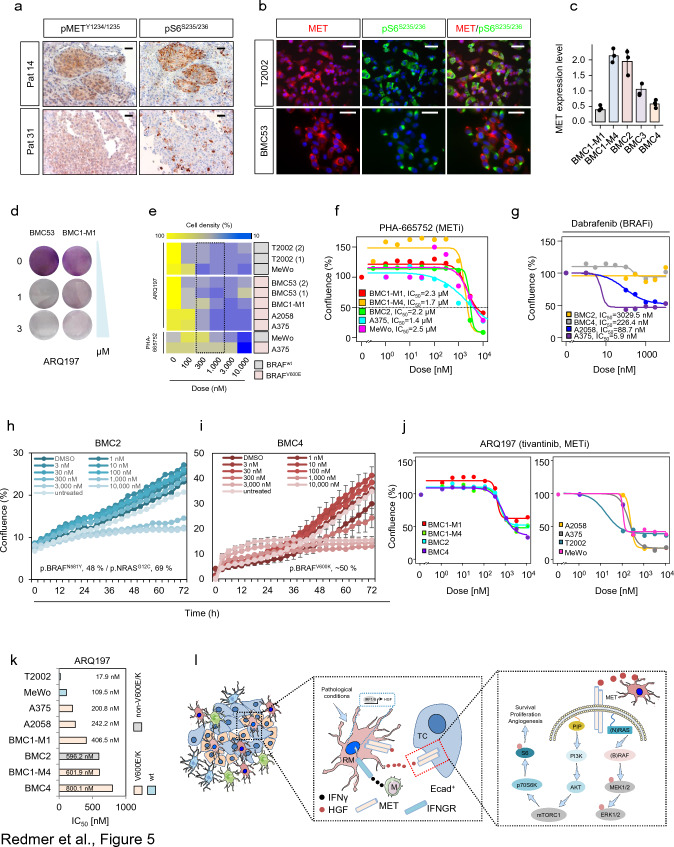
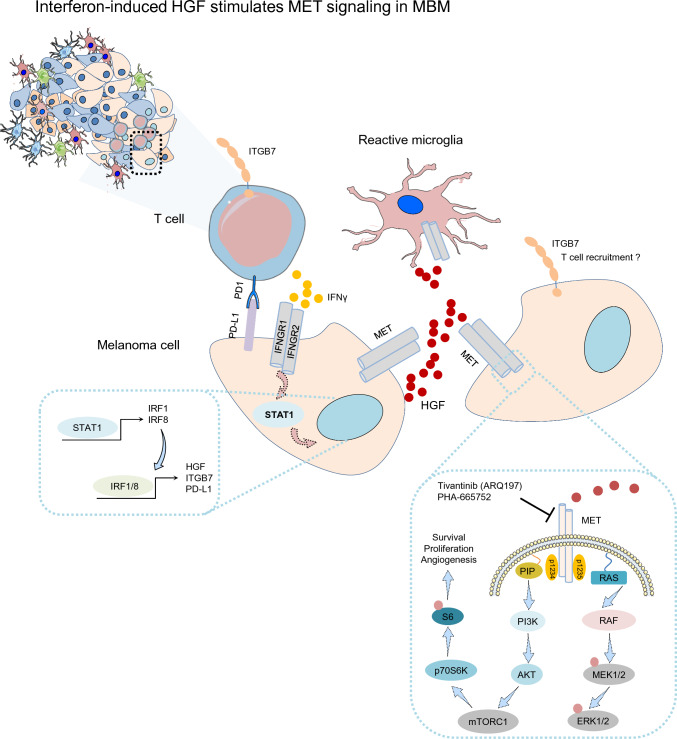
The development of brain metastases hallmarks disease progression in 20-40% of melanoma patients and is a serious obstacle to therapy. Understanding the processes involved in the development and maintenance of melanoma brain metastases (MBM) is critical for the discovery of novel therapeutic strategies. Here, we generated transcriptome and methylome profiles of MBM showing high or low abundance of infiltrated Iba1high tumor-associated microglia and macrophages (TAMs). Our survey identified potential prognostic markers of favorable disease course and response to immune checkpoint inhibitor (ICi) therapy, among them APBB1IP and the interferon-responsive gene ITGB7. In MBM with high ITGB7/APBB1IP levels, the accumulation of TAMs correlated significantly with the immune score. Signature-based deconvolution of MBM via single sample GSEA revealed enrichment of interferon-response and immune signatures and revealed inflammation, stress and MET receptor signaling. MET receptor phosphorylation/activation maybe elicited by inflammatory processes in brain metastatic melanoma cells via stroma cell-released HGF. We found phospho-METY1234/1235 in a subset of MBM and observed a marked response of brain metastasis-derived cell lines (BMCs) that lacked druggable BRAF mutations or developed resistance to BRAF inhibitors (BRAFi) in vivo to MET inhibitors PHA-665752 and ARQ197 (tivantinib). In summary, the activation of MET receptor in brain colonizing melanoma cells by stromal cell-released HGF may promote tumor self-maintenance and expansion and might counteract ICi therapy. Therefore, therapeutic targeting of MET possibly serves as a promising strategy to control intracranial progressive disease and improve patient survival.

Keywords: Brain metastasis; ITGB7; Interferon signaling; MET receptor; Melanoma; TAMs.


Conflict of interest statement

The authors declare no conflicting interests.

Figures

Fig. 1
Fig. 1
Transcriptome and methylome profiling of Iba1high and Iba1neg MBM revealed the identification of subset-specific genes. a Immunohistochemistry (IHC) for Iba1 (red) of MBM of indicated patients. b Representative IHC for levels of CD3 in Iba1high (Pat 4) and Iba1low/neg (Pat 1) MBM. c Immune score of MBM (study EGAS00001005976, n = 16) indicating different immunologic (color coded) subsets of tumors. d Dot plot showing the significant correlation of Iba1/AIF1 expression and immune score of brain metastases (BM, R = 0.86, p < 2.2e-16) and extracranial metastases (EM, R = 0.78, p = 5.5e-13). e Survival analysis of patients with MBM (study, EGAS00001003672), featuring high or low level of Iba1/AIF1 expression revealed no significant difference (p = 0.11). f Survival analysis of TCGA melanoma patients (n = 459), featuring a high or low level of Iba1/AIF1 expression revealed a significant difference (logrank p = 1.3e-07) and Cox-regression analysis showed association with favorable disease course (HR = 0.46). g Schematic representation of candidate identification by methylome and transcriptome profiling of n = 16 MBM of study. Methylome (850 k) profiling of Iba1high (n = 5) or Iba1low/neg (n = 2) identified 416 differentially methylated regions (DMRs), within the 5´-UTR of 316 corresponding genes of which 294 were expressed in MBM with 56 genes (77 DMRs), significantly (p ≤ 0.05) discriminating Iba1high and Iba1low/neg MBM. h Heat map representation of 77 DMRs (left panel) and top expressed (right panel) genes (n = 31). Analysis identified a panel of 12 genes that clustered with expression of microglia/TAM-associated genes AIF1, SYK and HCK. i Correlation analysis of cluster genes with association to immune/TAM regulated processes, the strength of the correlation is color coded. j Comparative t-SNE representation of brain cell subclasses microglia, neurons and oligodendrocytes (left) and expression of APBB1IP (Amyloid Beta Precursor Protein Binding Family B Member 1 Interacting Protein), expression level (log2 RPKM) is color coded. k Dot plot showing the significant correlation of APBB1IP expression and immune score of brain metastases (BM, R = 0.86, p < 2.2e-16) and extracranial metastases (EM, R = 0.92, p < 2.2e-16). Significance was determined by unpaired, two-sided t-test (d, g, k)
Fig. 2
Fig. 2
Expression of ITGB7 serves as an indicator of lymphocyte infiltration. a Box plot representation of levels of ITGB7 indicates a wide pattern of expression among indicated immune cell populations. Monocytes and neutrophil granulocytes show low levels of ITGB7. b IHC of a representative MBM of a patient with refractory intracranial disease for Iba1 (red, first column) and CD3 (brown, second column) indicating focal enrichment of microglia/macrophages and CD3+ T cells within ITGB7 positive areas (red, second column). Hematoxylin and eosin (H&E) staining shows discrimination of tumor cells and tumor-infiltrating lymphocytes (TILs) c Expression (FPKM, log2) of CD4, PD-L1 (CD274) and SUSD3 in MBM with a high or low level of ITGB7, indicating cellular co-occurrence. d Dot plot showing the significant inverse correlation (R =  – 0.87, p = 5.2e-05) of β-values (probe cg26689077) indicating the methylation level at a side located within the proximal enhancer-like structure of the ITGB7 gene and immune score of MBM (n = 14) of study EGAS00001005976 (first panel). Box plots represent a significant (p = 4.5e-04) or non-significant (p = 0.86) association of ITGB7 methylation (probe cg26689077) or BRAF mutation status (center and right panels) of all MBM investigated (n = 21). e Dot plot showing the significant correlation of ITGB7 expression and immune score of MBM (R = 0.51, p = 1.8e-06) and EM (R = 0.61, p = 1.1e-09) indicating immune-related expression of ITGB7 irrespective of the side of metastasis. f.) Correlation map showing high association (p < 0.05) of ITGB7 with relevant immune cell markers such as PD-1 (PDCD1), PD-L1 (CD274), PD-L2 (PDCD1LG2) but low correlation with tumor cell markers NGFR, MITF, MLANA or SLC45A2. g Dot plot showing the significant correlation of ITGB7 and expression of PD-L2 (BM: R = 0.45, p = 3.4e-05; EM: R = 0.42, p = 1.1e-03) and SUSD3 (BM: R = 0.44, p = 5.2e-05; EM: R = 0.61, p = 2.6e-07). h Dot plot showing the correlation of ITGB7 expression and immune scores of primary (PT; R = 0.59, p = 9.4e-16), metastatic (EM; R = 0.78, p = 2.2e-16) and brain metastatic (BM; R = 0.2, p = 0.61) melanoma (TCGA-SKCM), indicating that expression of ITGB7 is independent of melanoma progression stages. i Survival analysis of TCGA melanoma patients (n = 459), featuring a high or low level of ITGB7 and SUSD3 expression revealed a significant difference (log rank p = 4.0e-04 and p = 6.6e-08) and Cox-regression analysis showed association with favorable disease course (HR = 0.60 and HR = 0.48). Box and whisker plots show the median (center line), the upper and lower quartiles (the box), and the range of the data (the whiskers), including outliers (a, c, d). Significance was determined by unpaired, two-sided t-test (c, d) or one-way ANOVA (a)
Fig. 3
Fig. 3
Signature-based deconvolution identified the parameter of MBM featuring a favorable disease course and identified a role of MET signaling. a Single-sample GSEA (ssGSEA)-based deconvolution of MBM of study EGAS00001005976 using customized gene signatures indicating “Signaling” processes, cellular subsets and stages of microglia and astrocyte and immune cell subsets. ssGSEA demonstrated distinct separation of MBM with high, median or low immune score regarding expression levels of signature genes, BMCs served as controls. ssGSEA uncovered differentially activated pathways and processes such as MET and STAT3 and interferon signaling, senescence (SenMayo), stress response and tumor inflammation in tumors enriched for reactive microglia and astrocytes and innate and acquired immune cells subsets. b Confocal microscopy images of orthotopic tumors established by stereotactic injection of BMC1-M4 or BMC2 cells into brains of Crl:CD1-Foxn1nu mice [49], stained for Iba1 (green, microglia) or Iba1, GFAP (red, astrocytes) and KBA.62 (turquoise, pan-melanoma cell marker). DAPI served as a nuclear counterstain. Markers show distinct areas of tumor (MBM) and microenvironment (TME) and regions of microglia infiltration, 21 days after intracranial injection [49]. MBM-TME boarders are indicated by white, dashed lines. c IHC of tumors investigated in (b) for activation and tyrosine phosphorylation (residue Y705) of STAT3. pSTAT3Y705 is particularly present in microenvironmental cells (astrocytes). Black, dashed lines indicate MBM-TME boarders. In b, c, bars indicate 50 µm. d-e Expression levels of hepatocyte growth factor (HGF) in tumors of studies EGAS00001005976, TCGA-SKCM and EGAS00001003672 demonstrating HGF expression in all tumor subsets. f, g Investigation of HGF expression in immune cell subsets (DICE database [61]) and brain cells (study GSE73721) revealed the highest levels in basophil granulocytes and monocytes (f) and in astrocytes and microglia (g). h UMAP projection of expression profiles from nuclei isolated from 5 neurotypical donors as provided by Seattle Alzheimer’s disease brain cell atlas (https://portal.brain-map.org/explore/seattle-alzheimers-disease), cellular subtypes are color coded (left panel). Log-normalized expression levels of HGF in nuclei isolated from 5 neurotypical donors (center panel). Log-normalized expression levels of HGF in nuclei isolated from 84 aged donors (42 cognitively normal and 42 with dementia), right panel, demonstrating an increased number of HGF expressing microglia and astrocytes as triggered by inflammatory processes. i Dot plot showing the correlation of HGF expression and immune score of BM (R = 0.49, p = 5.3e-06) and EM (R = 0.41, p = 1.5e-03) indicating a potential role of HGF in immune cell-related processes. Box and whisker plots show median (center line), the upper and lower quartiles (the box), and the range of the data (the whiskers), including outliers (dg). Significance was determined by unpaired, two-sided t-test (e) or one-way ANOVA (g)
Fig. 4
Fig. 4
Ecad+ MBM are defined by expression of MET receptor. a Schematic summary of the initial screen of MBM expression data of our recent study (EGAS00001005976; n = 16 MBM) for subset expressed receptors. MBM contains Ecad+ and NGFR+ subsets and admixed cells such reactive microglia, labeled by expression of Iba1/AIF1 and or P2RY12. The initial survey yielded 24 receptors that potentially establish cell survival/growth of MBM. b.) Correlation map (Spearman, p < 0.05) showing the relationship of identified receptors expressed in MBM of our previous study, emphasizing the distinct pattern of Ecad+ and NGFR+ molecular subsets. The value of the correlation coefficient is color coded. c Box plots depicting the levels of MET in Ecadhigh and Ecadlow subsets of MBM and EM (left panel, p = 1.4e-04/p = 0.41) or in all subtypes of MBM and EM (p = 2.7e-05) in high and low proliferating tumor cell subsets (right panel, p = 9.1e-03). d Comparative principal component (PCA) representation of primary tumors (PT), extracranial metastases (EM) and MBM (MBM_TCGA) of the TCGA-SKCM cohort as well as MBM of our study (MBM_CHA, EGAS00001005976) depicting gradual levels of MET and Ecad (CDH1) expression. The panels below show a comparison of levels of MET, Ecad, MITF and NGFR of selected tumors showing distinct and overlapping cell states. Expression levels (log2, FPKM) are color coded. e IHC of selected MBM for MET and MITF validated the two subsets. f, g Expression and activation status of MET in BRAF wildtype (wt; Pts 14, 36) and BRAFV600E/R mutated MBM (Pts 28, 29, 31). Phosphorylation of MET at residues Y1234/1235 is critical for kinase activation. h IHC of indicated tumors for co-localization of pMETY1234/1235 (brown) and Iba1 (red) demonstrating potential activation of MET receptor signaling tumor cells by stromal cell-secreted HGF. i Heat map representing expression levels of regulators and targets of interferon signaling and immune-related genes showing clustering according to the level of ITGB7 expression. Box and whisker plots show median (center line), the upper and lower quartiles (the box), and the range of the data (the whiskers), including outliers (c, d). Significance was determined by unpaired, two-sided t-test (c, d)
Fig. 5
Fig. 5
Inhibitors of MET receptor decrease the growth of brain metastatic and conventional melanoma cell lines. a Comparative IHC of selected MBM for levels of phosphorylated and activated MET receptor (pMETY1234/1235) and ribosomal protein S6 (pS6235/236) of consecutive sections suggesting MET-associated activation of mTOR signaling. b Immunofluorescence microscopy of lymph node-metastatic (T2002) and brain metastatic (BMC53) patient-derived melanoma cell lines for the co-occurrence of MET (red) and pS6235/236 (green). DAPI served as a nuclear counterstain. c qPCR analysis of BMCs for expression of MET receptor, bars indicate median levels ± SD of three biological replicates. d Gross initial ARQ197 sensitivity test of BMC53 and BMC1-M1 cells showing high and low levels of MET expression. Cell density was determined by crystal violet staining. e Broad range determination of sensitivity of BMCs, T2002 and conventional melanoma cell lines (A375, A2058, MeWo) to METi PHA-665752 and ARQ197. Cell density and BRAF mutation status are indicated. Dotted line depicts the estimated range of IC50. f PHA-665752 dose–response fit curve-based calculation of IC50 values of A375 cells with overexpression of NGFR or RFP control cells and MeWo cells. g Dabrafenib dose–response fit curve-based calculation of IC50 values of BMCs exhibiting different BRAF mutations (BMC2p.N581Y, BMC4p.V600K) and A375p.V600E, A2058p.V600E cells. h, i Live cell imaging-based tracking of confluence (%) of BMC2 and BMC4 cells in dependence of increasing doses of ARQ197. Shown are median values ± SD of eight technical replicates. A representative out of two experiments is shown. j ARQ197 dose–response fit curves of BMCs, T2002 and conventional cell lines. Calculated IC50 values are indicated, suggesting the response of dabrafenib-resistant cell lines to METi. k Bar diagram summarizing IC50 values (nM) indicating the response of indicated cell lines to ARQ197. The BRAF status is color coded. l Working model suggesting the activation of MET receptor signaling in adjacent tumor cells and in (reactive) microglia (RM) by microglia-released HGF. IRF-mediated HGF expression in turn is triggered by immune cell (monocytes/macrophages, M) released interferon-gamma. HGF binding to tumor cell (TC) expressed MET receptor directs downstream activation of the RAS/RAF/MEK/ERK and the PI3K/AKT/mTOR/p70S6K branch. The latter is leading to phosphorylation and activation of the ribosomal protein S6. Box and whisker plots show the median (center line), the upper and lower quartiles (the box), and the range of the data (the whiskers), including outliers (c)
Fig. 6
Fig. 6
HGF/MET receptor signaling might be activated in tumor cells at immune cell/TAM dense areas. Schematic representation of our working model suggesting the interaction of tumor cells with stromal cells, particularly microglia and immune cells, consequentially leading to activation of MET signaling in tumor cells via stromal cell-released HGF. Expression of HGF in turn and ITGB7 and PD-L1 is likely triggered by T cell-provided interferon-gamma. Increased levels of ITGB7 may foster the recruitment of immune cells

References

    1. Abe N, Nishihara T, Yorozuya T, Tanaka J. Microglia and Macrophages in the pathological central and peripheral nervous systems. Cells. 2020 doi: 10.3390/cells9092132. - DOI - PMC - PubMed
    1. Acker G, Zollfrank J, Jelgersma C, Nieminen-Kelha M, Kremenetskaia I, Mueller S, et al. The CXCR2/CXCL2 signalling pathway - an alternative therapeutic approach in high-grade glioma. Eur J Cancer. 2020;126:106–115. doi: 10.1016/j.ejca.2019.12.005. - DOI - PubMed
    1. Andersen RS, Anand A, Harwood DSL, Kristensen BW. Tumor-associated microglia and macrophages in the glioblastoma microenvironment and their implications for therapy. Cancers (Basel) 2021 doi: 10.3390/cancers13174255. - DOI - PMC - PubMed
    1. Baltschukat S, Engstler BS, Huang A, Hao H-X, Tam A, Wang HQ, et al. Capmatinib (INC280) is active against models of non-small cell lung cancer and other cancer types with defined mechanisms of MET activation. Clin Cancer Res. 2019;25:3164–3175. doi: 10.1158/1078-0432.Ccr-18-2814. - DOI - PubMed
    1. Basilico C, Pennacchietti S, Vigna E, Chiriaco C, Arena S, Bardelli A, et al. Tivantinib (ARQ197) displays cytotoxic activity that is independent of its ability to bind MET. Clin Cancer Res. 2013;19:2381–2392. doi: 10.1158/1078-0432.Ccr-12-3459. - DOI - PubMed

Publication types