

Pivotal Role of GSTO2 in Ferroptotic Neuronal Injury After Intracerebral Hemorrhage
- PMID: 38386166
- PMCID: PMC10884062
- DOI: 10.1007/s12031-023-02187-y
Pivotal Role of GSTO2 in Ferroptotic Neuronal Injury After Intracerebral Hemorrhage
Abstract
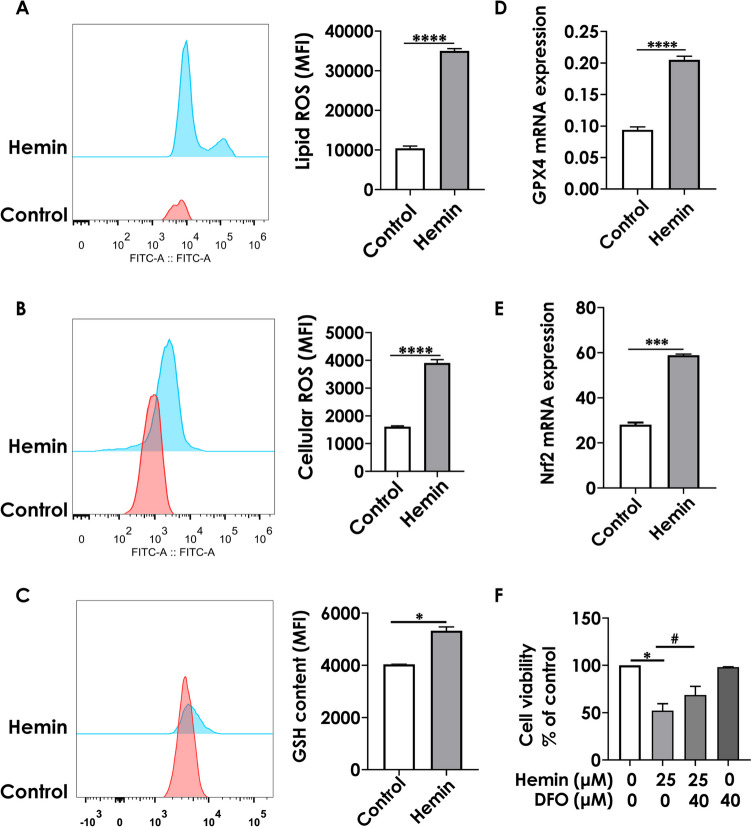
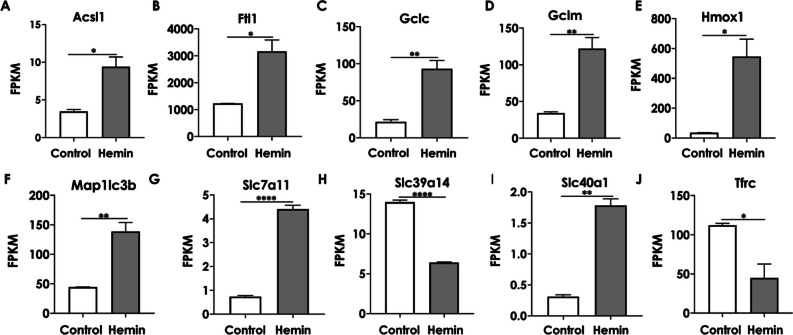
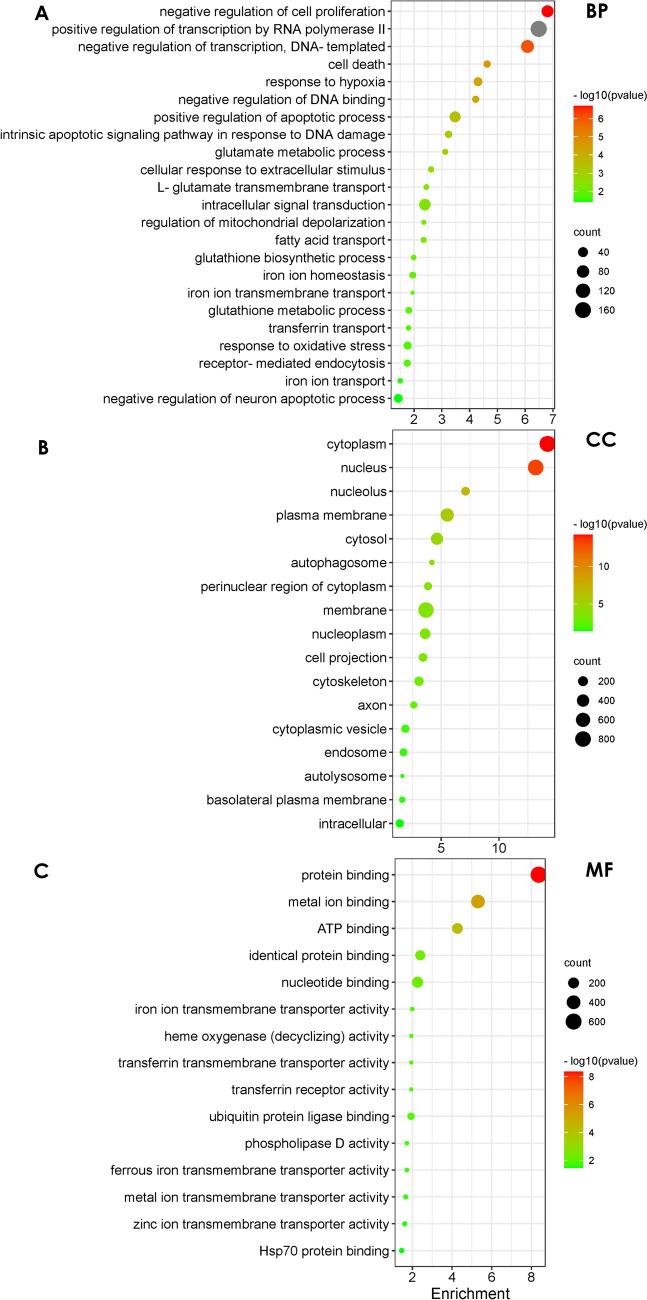
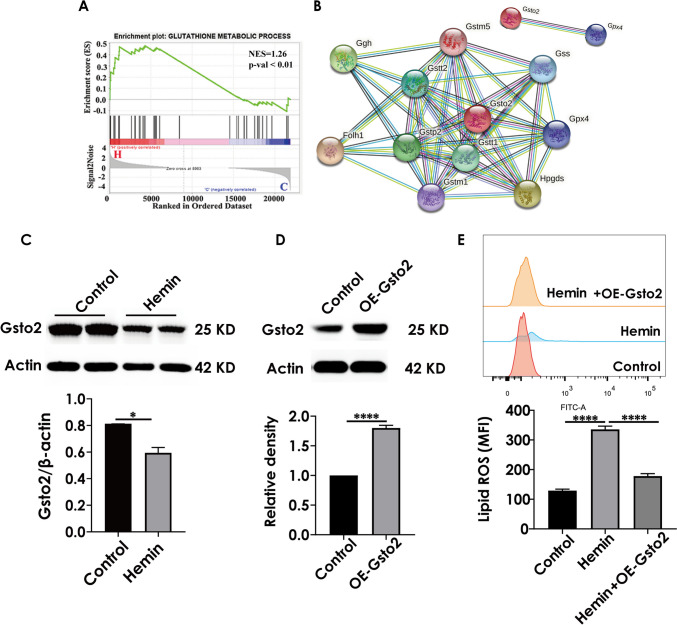
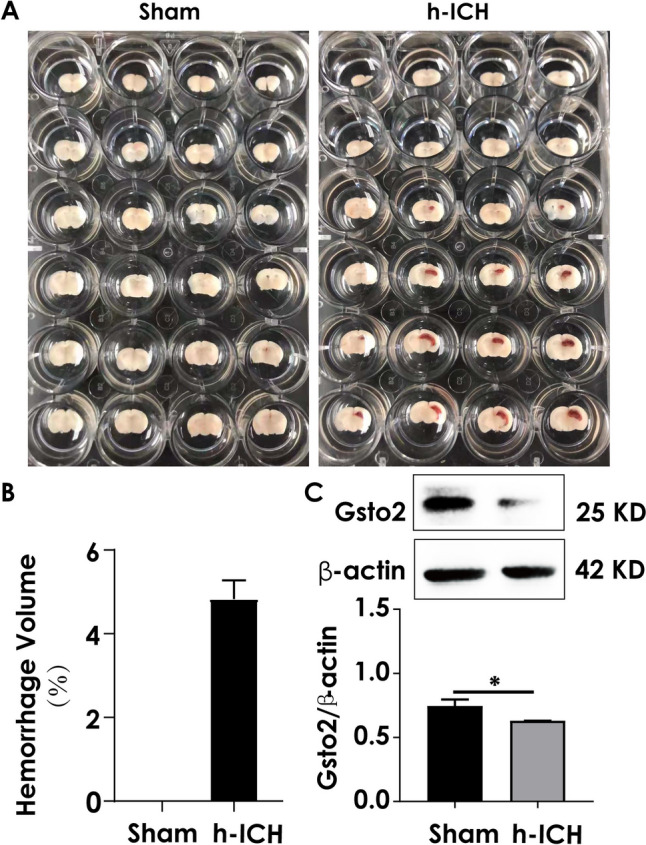
Previous research has found that an adaptive response to ferroptosis involving glutathione peroxidase 4 (GPX4) is triggered after intracerebral hemorrhage. However, little is known about the mechanisms underlying adaptive responses to ferroptosis. To explore the mechanisms underlying adaptive responses to ferroptosis after intracerebral hemorrhage, we used hemin-treated HT22 cells to mimic brain injury after hemorrhagic stroke in vitro to evaluate the antioxidant enzymes and performed bioinformatics analysis based on the mRNA sequencing data. Further, we determined the expression of GSTO2 in hemin-treated hippocampal neurons and in a mouse model of hippocampus-intracerebral hemorrhage (h-ICH) by using Western blot. After hemin treatment, the antioxidant enzymes GPX4, Nrf2, and glutathione (GSH) were upregulated, suggesting that an adaptive response to ferroptosis was triggered. Furthermore, we performed mRNA sequencing to explore the underlying mechanism, and the results showed that 2234 genes were differentially expressed. Among these, ten genes related to ferroptosis (Acsl1, Ftl1, Gclc, Gclm, Hmox1, Map1lc3b, Slc7a11, Slc40a1, Tfrc, and Slc39a14) were altered after hemin treatment. In addition, analysis of the data retrieved from the GO database for the ten targeted genes showed that 20 items on biological processes, 17 items on cellular components, and 19 items on molecular functions were significantly enriched. Based on the GO data, we performed GSEA and found that the glutathione metabolic process was significantly enriched in the hemin phenotype. Notably, the expression of glutathione S-transferase omega (GSTO2), which is involved in glutathione metabolism, was decreased after hemin treatment, and overexpression of Gsto2 decreased lipid reactive oxygen species level in hemin-exposed HT22 cells. In addition, the expression of GSTO2 was also decreased in a mouse model of hippocampus-intracerebral hemorrhage (h-ICH). The decreased expression of GSTO2 in the glutathione metabolic process may be involved in ferroptotic neuronal injury following hemorrhagic stroke.
Keywords: Ferroptosis; Hemin; Hippocampal neurons; Transcriptome analysis.
© 2024. The Author(s).
Conflict of interest statement
The authors declare competing interests.
Figures


Similar articles
-
GSTO2 ameliorates human neuroblastoma cell apoptosis, inflammation, ferroptosis, and oxidative stress by upregulating GPX4 expression in intracerebral hemorrhage.Drug Dev Res. 2024 Sep;85(6):e22245. doi: 10.1002/ddr.22245. Drug Dev Res. 2024. PMID: 39154227
-
Hemin-Induced Death Models Hemorrhagic Stroke and Is a Variant of Classical Neuronal Ferroptosis.J Neurosci. 2022 Mar 9;42(10):2065-2079. doi: 10.1523/JNEUROSCI.0923-20.2021. Epub 2022 Jan 5. J Neurosci. 2022. PMID: 34987108 Free PMC article.
-
Mechanism of SOX10 in ferroptosis of hippocampal neurons after intracerebral hemorrhage via the miR-29a-3p/ACSL4 axis.J Neurophysiol. 2023 Apr 1;129(4):862-871. doi: 10.1152/jn.00374.2022. Epub 2023 Mar 15. J Neurophysiol. 2023. PMID: 36919939
-
Ferroptosis, a Regulated Neuronal Cell Death Type After Intracerebral Hemorrhage.Front Cell Neurosci. 2020 Nov 16;14:591874. doi: 10.3389/fncel.2020.591874. eCollection 2020. Front Cell Neurosci. 2020. PMID: 33304242 Free PMC article. Review.
-
A new strategy for the treatment of intracerebral hemorrhage: Ferroptosis.Exp Neurol. 2024 Dec;382:114961. doi: 10.1016/j.expneurol.2024.114961. Epub 2024 Sep 15. Exp Neurol. 2024. PMID: 39288829 Review.
References
-
- Alim I et al (2019) Selenium drives a transcriptional adaptive program to block ferroptosis and treat stroke. Cell 177(5):1262–1279 e25 - PubMed
MeSH terms
Substances
Grants and funding
LinkOut - more resources
Full Text Sources
Medical
Molecular Biology Databases
Research Materials
Miscellaneous
