. 2024 Mar 5;18(9):6845-6862.
doi: 10.1021/acsnano.3c04471. Epub 2024 Feb 22.

A Cancer Nanovaccine for Co-Delivery of Peptide Neoantigens and Optimized Combinations of STING and TLR4 Agonists

Affiliations

A Cancer Nanovaccine for Co-Delivery of Peptide Neoantigens and Optimized Combinations of STING and TLR4 Agonists

Jessalyn J Baljon et al. ACS Nano. .

Abstract

Immune checkpoint blockade (ICB) has revolutionized cancer treatment and led to complete and durable responses, but only for a minority of patients. Resistance to ICB can largely be attributed to insufficient number and/or function of antitumor CD8+ T cells in the tumor microenvironment. Neoantigen targeted cancer vaccines can activate and expand the antitumor T cell repertoire, but historically, clinical responses have been poor because immunity against peptide antigens is typically weak, resulting in insufficient activation of CD8+ cytotoxic T cells. Herein, we describe a nanoparticle vaccine platform that can overcome these barriers in several ways. First, the vaccine can be reproducibly formulated using a scalable confined impingement jet mixing method to coload a variety of physicochemically diverse peptide antigens and multiple vaccine adjuvants into pH-responsive, vesicular nanoparticles that are monodisperse and less than 100 nm in diameter. Using this approach, we encapsulated synergistically acting adjuvants, cGAMP and monophosphoryl lipid A (MPLA), into the nanocarrier to induce a robust and tailored innate immune response that increased peptide antigen immunogenicity. We found that incorporating both adjuvants into the nanovaccine synergistically enhanced expression of dendritic cell costimulatory markers, pro-inflammatory cytokine secretion, and peptide antigen cross-presentation. Additionally, the nanoparticle delivery increased lymph node accumulation and uptake of peptide antigen by dendritic cells in the draining lymph node. Consequently, nanoparticle codelivery of peptide antigen, cGAMP, and MPLA enhanced the antigen-specific CD8+ T cell response and delayed tumor growth in several mouse models. Finally, the nanoparticle platform improved the efficacy of ICB immunotherapy in a murine colon carcinoma model. This work establishes a versatile nanoparticle vaccine platform for codelivery of peptide neoantigens and synergistic adjuvants to enhance responses to cancer vaccines.

Keywords: adjuvant synergy; cancer vaccine; endosomal escape; immune checkpoint blockade; immunotherapy; nanoparticle.


Conflict of interest statement

The authors declare the following competing financial interest(s): J.T.W. is an inventor on U.S. Patent 10,696,985 Reversibly Crosslinked Endosomolytic Polymer Vesicles for Cytosolic Drug Delivery and on U.S. Patent Application PCT/US2019/058945 Graft Copolymers, Methods of Forming Graft Copolymers, and Methods of Use Thereof, both of which describe drug delivery technologies that have been used for STING agonist delivery.

Figures

Figure 1
Figure 1
Fabrication and characterization of nanoparticle platform. (A) Schematic representation of coloaded nanoparticle vaccine platform promoting MPLA delivery to cell surface and endosome, and cGAMP and peptide antigen delivery to cytosol via endosomal escape. This enhances innate immune signaling for dendritic cell activation and antigen presentation on MHC-I, which together activate a CD8+ T cell response. Made with BioRender.com. (B) Chemical composition and structure of mPEG-block-(DEAEMA-co-BMA) diblock copolymer. (C) Schematic representation of formulation of nanoparticle via confined impingement jet mixing. Made with BioRender.com. (D) Representative cryogenic electron micrograph of nanoparticle coloaded with antigen, cGAMP, and MPLA. (E) Representative size distribution of empty nanoparticle and nanoparticle coloaded with antigen, cGAMP, and MPLA as measured by dynamic light scattering. (F) Representative fluorescent images of NCI H358 cells expressing a Gal9-mCherry fusion protein after treatment with PBS or the loaded nanoparticle (NP). (G) Vesicle count per cell for NCI H358 cells expressing a Gal9-mCherry fusion protein after treatment with indicated formulations (mean ± SD; n = 3–11 biologically independent samples, **P < 0.01; one-way ANOVA with Tukey’s multiple comparisons). (H) In vitro evaluation of IRF3 and NF-κB activation after treatment with indicated formulation for 24 h (mean ± SD; n = 3 biologically independent samples).
Figure 2
Figure 2
Combining NP-cGAMP and NP-MPLA enhances innate immune activation, co-stimulatory molecule expression, and pro-inflammatory cytokine secretion in vitro. (A) In vitro evaluation of interferon activation in RAW-Dual reporter cells after treatment with indicated formulation for 24 h, cGAMP doses indicated on x-axis, MPLA dose for NP-MPLA dose matched to MPLA dose in cGAMP:MPLA 1:16 (mean ± SD; n = 3 biologically independent samples). (B) In vitro evaluation of NF-κB activation in RAW-Dual reporter cells after treatment with indicated formulation for 24 h, MPLA doses indicated on x-axis, cGAMP dose for NP-cGAMP dose matched to cGAMP dose in cGAMP:MPLA 16:1 (mean ± SD; n = 3 biologically independent samples). (C) Flow cytometric quantification of mean fluorescence intensity (MFI) of CD86 expression by BMDCs treated with indicated doses of NP-cGAMP, NP-MPLA, or a mixture of both NPs (n = 3 biologically independent samples). (D–G) Concentration of secreted IFN-β (D), IL-6 (E), TNF-α (F), and IL-1α (G) by BMDCs after treatment with indicated doses of NP-cGAMP, NP-MPLA, or a mixture of both NPs (n = 3 biologically independent samples).
Figure 3
Figure 3
NP-cGAMP/MPLA enhances innate immune activation, co-stimulatory molecule expression, and pro-inflammatory cytokine secretion in vitro. (A) In vitro evaluation of interferon activation in RAW-Dual reporter cells after treatment with indicated formulation for 24 h, cGAMP doses indicated on x-axis, MPLA dose for NP-MPLA dose matched to MPLA dose in NP-cGAMP/MPLA(1:4) (mean ± SD; n = 3 biologically independent samples). (B) In vitro evaluation of NF-κB activation in RAW-Dual reporter cells after treatment with indicated formulation for 24 h, MPLA doses indicated on x-axis, cGAMP dose for NP-cGAMP dose matched to cGAMP dose in NP-cGAMP/MPLA(4:1) (mean ± SD; n = 3 biologically independent samples). (C) Flow cytometric quantification of mean fluorescence intensity (MFI) of CD86 expression by BMDCs treated with indicated doses of NP-cGAMP, NP-MPLA, or NP-cGAMP/MPLA (n = 3 biologically independent samples). (D–G) Concentration of secreted (D) IFN-β, (E) IL-6, (F) TNF-α, and (G) IL-1α by BMDCs after treatment with indicated doses of NP-cGAMP, NP-MPLA, or NP-cGAMP/MPLA (n = 3 biologically independent samples).
Figure 4
Figure 4
Nanoparticle vaccine enhances lymphatic accumulation and uptake by antigen presenting cells. (A) Fluorescent images of vaccine site draining lymph node 6h after subcutaneous injection of vaccine formulated with Cy5-OVAp. (B) Quantification of fluorescence in vaccine site draining lymph node (mean ± SD; n = 5 mice/group; **P < 0.01; one-way ANOVA with Tukey’s multiple comparisons). (C) Percentage of Cy5-OVAp positive cells among immune cell populations in vaccine draining lymph node 6h after injection of vaccine formulated with Cy5-OVAp (mean ± SD; n = 5 mice/group; ***P < 0.001; one-way ANOVA with Tukey’s multiple comparisons). (D) Percentage of Cy5-OVAp positive cells among pDCs and cDCs (cDC1 and cDC2) in the vaccine site draining lymph node 6h after injection of vaccine formulated with Cy5-OVAp (mean ± SD; n = 6–8 mice/group; *P < 0.05, **P < 0.01; unpaired t test).
Figure 5
Figure 5
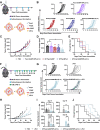
Nanoparticle vaccine enhances dendritic cell activation and cross-presentation, activates antigen-specific CD8+ T cells, and provides therapeutic efficacy in the EG7.OVA model. (A) Flow cytometric quantification of mean fluorescence intensity (MFI) of CD86 expression by BMDCs treated with indicated formulations (mean ± SD; n = 2; **P < 0.01; one-way ANOVA with Tukey’s multiple comparisons). (B) Flow cytometric quantification of mean fluorescence intensity (MFI) or percentage of SIINFEKL-H2Kb positive BMDCs treated with indicated formulations and stained with PE-labeled antibody against SIINFEKL/H-2Kb (mean ± SD; n = 3; ****P < 0.0001; one-way ANOVA with Tukey’s multiple comparisons). (C) Vaccination and downstream analysis scheme. (D) Quantification of the frequency of SIINFEKL-specific CD8+ T cells in spleen after vaccination using peptide/MHC tetramer staining (mean ± SD; n = 10 mice/group; ****P < 0.0001; one-way ANOVA with Tukey’s multiple comparisons). (E) Quantification of the frequency of SIINFEKL-specific CD8+ T cells in spleen after vaccination using peptide/MHC tetramer staining comparing wild-type mice to Batf3–/– mice (mean ± SD; n = 5–8 mice/group; ***P < 0.001, ****P < 0.0001; two-way ANOVA with Tukey’s multiple comparisons). (F) Tumor challenge and therapeutic vaccination scheme. (G) Average EG7.OVA tumor growth in response to indicated formulation (mean ± SEM; n = 8–10 mice/group). (H) Average tumor volume on day 20 after tumor inoculation (mean ± SEM; n = 8–10 mice/group; **P < 0.01, ***P < 0.001; one-way ANOVA with Tukey’s multiple comparisons). (I) Kaplan–Meier survival curve using 2000 mm3 tumor volume as the end point (n = 8–10 mice/group; statistical significance between indicated treatment versus PBS and NP-Pep/cGAMP; *P < 0.05, **P < 0.01; Mantel–Cox log-rank test). (J) Representative flow cytometry plots and quantification of IFNγ+TNFα+ CD8+ T cells after ex vivo restimulation of splenocytes with SIINFEKL peptide (mean ± SD; n = 8 mice/group; ****P < 0.0001; unpaired t test). (K) Percentage of central and effector memory antigen-specific CD8+ T cells (TCM and TEM) in spleen after vaccination (mean ± SD; n = 8 mice/group; ****P < 0.0001; unpaired t test).
Figure 6
Figure 6
Nanoparticle vaccine provides therapeutic efficacy in MC38 adenocarcinoma model and improves the efficacy of αPD-1 ICB therapy. (A) Tumor challenge and therapeutic vaccination scheme. (B) Spider plots of individual tumor growth curves. (C) Average MC38 tumor growth in response to indicated formulation (mean ± SEM; n = 10 mice/group). (D) Average tumor volume on day 22 after tumor inoculation (mean ± SEM; n = 10 mice/group; *P < 0.05; one-way ANOVA with Tukey’s multiple comparisons). (E) Kaplan–Meier survival curve using 2000 mm3 tumor volume as the end point (n = 10 mice/group; statistical significance between NP-Pep/cGAMP/MPLA(1:4) and all other groups shown; *P < 0.05; Mantel–Cox log-rank test). (F) Tumor challenge, therapeutic vaccination, and αPD-1 treatment scheme. (G) Spider plots of individual tumor growth curves. (H) Average MC38 tumor growth in response to indicated formulation (mean ± SEM; n = 8–10 mice/group). (I) Average tumor volume on days 17–25 after tumor inoculation (mean ± SEM; n = 8–10 mice/group; *P < 0.05, **P < 0.01; one-way ANOVA with Tukey’s multiple comparisons). (J) Kaplan–Meier survival curve using 2000 mm3 tumor volume as the end point (n = 8–10 mice/group; statistical significance between NP-Pep/cGAMP/MPLA(1:4) + αPD-1 and all other groups shown; *P < 0.05; Mantel–Cox log-rank test).
Figure 7
Figure 7
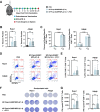
Nanoparticle vaccine activates antigen-specific and functional CD8+ T cells against MC38 neoantigens. (A) Vaccination and downstream analysis scheme. (B) Quantification of the frequency of Reps1-specific and Adpgk-specific CD8+ T cells in spleen after vaccination using peptide/MHC tetramer staining (mean ± SD; n = 7–8 mice/group; *P < 0.05, **P < 0.01; one-way ANOVA with Tukey’s multiple comparisons). (C) Percentage of central and effector memory antigen-specific CD8+ T cells in spleen after vaccination (mean ± SD; n = 7–8 mice/group; ****P < 0.0001; two-way ANOVA with Tukey’s multiple comparisons). (D) Representative ICCS flow cytometry plots evaluating the percentage of IFNγ+TNFα+ CD8+ T cells after ex vivo restimulation of splenocytes with Reps1 (AQLANDVVL) or Adpgk (ASMTNMELM) peptides. (E) Quantification of flow cytometry data in D (mean ± SD; n = 7–8 mice/group; *P < 0.05, **P < 0.01; one-way ANOVA with Tukey’s multiple comparisons). (F) Representative ELISPOT wells after ex vivo restimulation of splenocytes with Reps1 (AQLANDVVL) or Adpgk (ASMTNMELM) peptides. (G) Quantification of images in F to determine the CD8+IFNγ+ T cell response (mean ± SD; n = 7–8 mice/group; *P < 0.05, **P < 0.01, ****P < 0.0001; one-way ANOVA with Tukey’s multiple comparisons).

References

    1. Korman A. J.; Garrett-Thomson S. C.; Lonberg N. The Foundations of Immune Checkpoint Blockade and the Ipilimumab Approval Decennial. Nat. Rev. Drug Discov 2022, 21, 509–528. 10.1038/s41573-021-00345-8. - DOI - PubMed
    1. Sharma P.; Allison J. P. The Future of Immune Checkpoint Therapy. Science 2015, 348, 56–61. 10.1126/science.aaa8172. - DOI - PubMed
    1. Shum B.; Larkin J.; Turajlic S. Predictive Biomarkers for Response to Immune Checkpoint Inhibition. Semin Cancer Biol. 2022, 79, 4–17. 10.1016/j.semcancer.2021.03.036. - DOI - PubMed
    1. Jenkins R. W.; Barbie D. A.; Flaherty K. T. Mechanisms of Resistance to Immune Checkpoint Inhibitors. Br. J. Cancer 2018, 118, 9–16. 10.1038/bjc.2017.434. - DOI - PMC - PubMed
    1. Ye Z.; Qian Q.; Jin H.; Qian Q. Cancer Vaccine: Learning Lessons from Immune Checkpoint Inhibitors. J. Cancer 2018, 9, 263–268. 10.7150/jca.20059. - DOI - PMC - PubMed

Publication types