. 2024 May 1;30(9):1972-1983.
doi: 10.1158/1078-0432.CCR-23-0372.

Broad Next-Generation Integrated Sequencing of Myelofibrosis Identifies Disease-Specific and Age-Related Genomic Alterations

Affiliations

Broad Next-Generation Integrated Sequencing of Myelofibrosis Identifies Disease-Specific and Age-Related Genomic Alterations

Malathi Kandarpa et al. Clin Cancer Res. .

Abstract

Purpose: Myeloproliferative neoplasms (MPN) are characterized by the overproduction of differentiated myeloid cells. Mutations in JAK2, CALR, and MPL are considered drivers of Bcr-Abl-ve MPN, including essential thrombocythemia (ET), polycythemia vera (PV), prefibrotic primary myelofibrosis (prePMF), and overt myelofibrosis (MF). However, how these driver mutations lead to phenotypically distinct and/or overlapping diseases is unclear.

Experimental design: To compare the genetic landscape of MF to ET/PV/PrePMF, we sequenced 1,711 genes for mutations along with whole transcriptome RNA sequencing of 137 patients with MPN.

Results: In addition to driver mutations, 234 and 74 genes were found to be mutated in overt MF (N = 106) and ET/PV/PrePMF (N = 31), respectively. Overt MF had more mutations compared with ET/PV/prePMF (5 vs. 4 per subject, P = 0.006). Genes frequently mutated in MF included high-risk genes (ASXL1, SRSF2, EZH2, IDH1/2, and U2AF1) and Ras pathway genes. Mutations in NRAS, KRAS, SRSF2, EZH2, IDH2, and NF1 were exclusive to MF. Advancing age, higher DIPSS, and poor overall survival (OS) correlated with increased variants in MF. Ras mutations were associated with higher leukocytes and platelets and poor OS. The comparison of gene expression showed upregulation of proliferation and inflammatory pathways in MF. Notably, ADGRL4, DNASE1L3, PLEKHGB4, HSPG2, MAMDC2, and DPYSL3 were differentially expressed in hematopoietic stem and differentiated cells.

Conclusions: Our results illustrate that evolution of MF from ET/PV/PrePMF likely advances with age, accumulation of mutations, and activation of proliferative pathways. The genes and pathways identified by integrated genomics approach provide insight into disease transformation and progression and potential targets for therapeutic intervention.


Figures

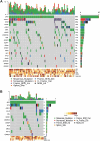
Figure 1. Oncoplot of the most frequently mutated genes in myelofibrosis and ET/PV/PrePMF. A, Summary of the most frequent (>4%) mutations in the MF cohort (N = 106) based on a total of 237 genes and 490 unique variants. The Oncoplot arranges patients along the horizontal axis, while genes and their respective mutations are presented vertically for each patient. The plot is divided into four parts: in the upper area is a bar graph of all somatic mutations in each patient: missense, nonsense single-nucleotide variations, frameshift insertions and deletions, in-frame deletions and splice site mutations per patient (see legend for color codes for variant type). The middle panel summarizes all somatic variants found with a frequency of at least 5%. The right-hand panel summarizes the gene variants in a bar graph, and the length of the bar depicts the frequency at which the gene is mutated. The lower panel is a heatmap depiction of clinical parameters of each patient. White blood cell (WBC) count, platelet count (PLT), hemoglobin levels, DIPSS and spleen size are shown. B, Summary of the most frequent mutations in the ET/PV/PrePMF cohort (N = 31) based on a total of 77 genes and 118 unique variants. The panel descriptions are same as in A.
Figure 1.
Oncoplot of the most frequently mutated genes in myelofibrosis and ET/PV/PrePMF. A, Summary of the most frequent (>4%) mutations in the MF cohort (N = 106) based on a total of 237 genes and 490 unique variants. The Oncoplot arranges patients along the horizontal axis, while genes and their respective mutations are presented vertically for each patient. The plot is divided into four parts: in the upper area is a bar graph of all somatic mutations in each patient: missense, nonsense single-nucleotide variations, frameshift insertions and deletions, in-frame deletions and splice site mutations per patient (see legend for color codes for variant type). The middle panel summarizes all somatic variants found with a frequency of at least 5%. The right-hand panel summarizes the gene variants in a bar graph, and the length of the bar depicts the frequency at which the gene is mutated. The lower panel is a heatmap depiction of clinical parameters of each patient. White blood cell (WBC) count, platelet count (PLT), hemoglobin levels, DIPSS and spleen size are shown. B, Summary of the most frequent mutations in the ET/PV/PrePMF cohort (N = 31) based on a total of 77 genes and 118 unique variants. The panel descriptions are same as in A.
Figure 2. Somatic gene variants in MPN. A, The number of gene variants in MF (N = 106) versus ET/PV/PrePMF (N = 31). The difference between the two groups was statistically significant (P = 0.0059), as calculated by Mann–Whitney test. B, Bar chart of the percentage of patients with number of genetic variants in each patient in MF. ET, PV, and PrePMF cohorts. C, Venn diagram showing the number of common and distinct sets of genes that are mutated in MF and ET/PV/PrePMF. D, The frequency of recurrently mutated genes that occur in more than 4% of MF or ET/PV/PrePMF patients. The asterisk (*) denotes genes that are mutated in MF at a higher rate or exclusively in this cohort. The inset table summarizes these genes.
Figure 2.
Somatic gene variants in MPN. A, The number of gene variants in MF (N = 106) versus ET/PV/PrePMF (N = 31). The difference between the two groups was statistically significant (P = 0.0059), as calculated by Mann–Whitney test. B, Bar chart of the percentage of patients with number of genetic variants in each patient in MF. ET, PV, and PrePMF cohorts. C, Venn diagram showing the number of common and distinct sets of genes that are mutated in MF and ET/PV/PrePMF. D, The frequency of recurrently mutated genes that occur in more than 4% of MF or ET/PV/PrePMF patients. The asterisk (*) denotes genes that are mutated in MF at a higher rate or exclusively in this cohort. The inset table summarizes these genes.
Figure 3. Mutational complexity in myelofibrosis. A Circos plot (A) depicts the relative frequency and pairwise co-occurrence of the top 12 genes mutated in patients with MF. The length of the arc corresponds to the frequency of mutations in the first gene, and the width of the ribbon corresponds to the percentage of patients who also had a mutation in the second gene. Pairwise co-occurrence of mutated genes is denoted only once, beginning with the first gene in the clockwise direction. B, The relative co-occurrence of mutated genes in dendrogram form; the genes on the same branch are co-mutated more frequently.
Figure 3.
Mutational complexity in myelofibrosis. A Circos plot (A) depicts the relative frequency and pairwise co-occurrence of the top 12 genes mutated in patients with MF. The length of the arc corresponds to the frequency of mutations in the first gene, and the width of the ribbon corresponds to the percentage of patients who also had a mutation in the second gene. Pairwise co-occurrence of mutated genes is denoted only once, beginning with the first gene in the clockwise direction. B, The relative co-occurrence of mutated genes in dendrogram form; the genes on the same branch are co-mutated more frequently.
Figure 4. Correlation of the number of variants with clinical presentation. A, The number of genetic variants in different age groups of MF (black bars) and ET/PV/PrePMF patients (open bars). The indicated trendline (R2 = 0.8125) shows a linear relationship of the number of variants with age. B, The overall survival rate of MF patients with 0 to 3 variants as compared with >4 variants (P = 0.0026). C, The number of variants per patient in each DIPSS group. The trendline shows a correlation (R2 = 0.88) of the number of variants with DIPSS. D, The percent survival of patients with ASXL1 mutations in ≤60 and >60 age groups as compared with patients without ASXL1 mutation in the same age brackets (P = 0.0003). E is the same as D for U2AF1 gene mutations (P < 0.0001).
Figure 4.
Correlation of the number of variants with clinical presentation. A, The number of genetic variants in different age groups of MF (black bars) and ET/PV/PrePMF patients (open bars). The indicated trendline (R2 = 0.8125) shows a linear relationship of the number of variants with age. B, The overall survival rate of MF patients with 0 to 3 variants as compared with >4 variants (P = 0.0026). C, The number of variants per patient in each DIPSS group. The trendline shows a correlation (R2 = 0.88) of the number of variants with DIPSS. D, The percent survival of patients with ASXL1 mutations in ≤60 and >60 age groups as compared with patients without ASXL1 mutation in the same age brackets (P = 0.0003). E is the same as D for U2AF1 gene mutations (P < 0.0001).
Figure 5. UPD and allele burden. A, Summarizes the incidence of UPD/gain in the driver genes in MF and ET/PV/PrePMF cohorts. B, The relationship between UPD and allele burden. P value of 7.4e−006 is based on a t test. C, The overall survival of patients with UPD/gain in JAK2 compared with patients who did not have UPD/gain in JAK2. D, VAF in patients with ASXL1, TET2, KRAS, DNMT3A, and high-risk mutations (see text). Patients are separated based on age to show the relationship of VAF with age. Tet2 VAF was significantly different in patients ≤60 years compared with patients >60 years (P = 0.005).
Figure 5.
UPD and allele burden. A, Summarizes the incidence of UPD/gain in the driver genes in MF and ET/PV/PrePMF cohorts. B, The relationship between UPD and allele burden. P value of 7.4e−006 is based on a t test. C, The overall survival of patients with UPD/gain in JAK2 compared with patients who did not have UPD/gain in JAK2. D, VAF in patients with ASXL1, TET2, KRAS, DNMT3A, and high-risk mutations (see text). Patients are separated based on age to show the relationship of VAF with age. Tet2 VAF was significantly different in patients ≤60 years compared with patients >60 years (P = 0.005).
Figure 6. Impact of Ras pathway gene mutations on clinical presentation in MF. Clinical characteristics of patients with Ras pathway gene (see list of genes in Supplemental materials) mutations were compared with those with wild-type genes. A, VAF of Ras pathway mutations in MF patients (CBL n = 17, CUX1 n = 3, KRAS n = 17, NF1 n = 9, NRAS n = 24, PTPN11 n = 5). B, WBC, platelets, hemoglobin, and spleen size measured by physical exam, respectively. Differences in WBC count (P = 0.015) and platelets (P = 0.03) were significant. C, The overall survival of patients with Ras pathway mutations compared with patients without these mutations (P = 0.0154). D, The overall survival of older and younger patients, >60 and ≤60 years, with and without Ras pathway mutations (P = 0.0078).
Figure 6.
Impact of Ras pathway gene mutations on clinical presentation in MF. Clinical characteristics of patients with Ras pathway gene (see list of genes in Supplemental materials) mutations were compared with those with wild-type genes. A, VAF of Ras pathway mutations in MF patients (CBL n = 17, CUX1 n = 3, KRAS n = 17, NF1 n = 9, NRAS n = 24, PTPN11 n = 5). B, WBC, platelets, hemoglobin, and spleen size measured by physical exam, respectively. Differences in WBC count (P = 0.015) and platelets (P = 0.03) were significant. C, The overall survival of patients with Ras pathway mutations compared with patients without these mutations (P = 0.0154). D, The overall survival of older and younger patients, >60 and ≤60 years, with and without Ras pathway mutations (P = 0.0078).
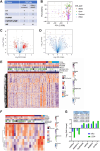
Figure 7. MPN gene expression. Gene expression in ET, PV, PrePMF and MF cells or enriched CD34-positive hematopoietic stem cells was studied by RNA-seq. A, Table summarizes the cell types and disease types included in the differential gene expression analyses. B, PCA of the gene expression patterns shows clustering of CD34 cells versus the BMMC/PBMC and lymphocyte-depleted PBMC. C, A volcano plot illustrates differentially expressed genes between the MF and the ET/PV/PrePMF cohorts when the mononuclear cell (MC) samples were analyzed. The red dots represent 223 genes significantly upregulated and 99 downregulated. D, Volcano plot illustrates differentially expressed genes between CD34-positive HSPC from MF versus ET/PV/PrePMF cohorts. The red dots show four genes significantly upregulated and five downregulated. E, The heatmap represents gene expression differences of the populations in the volcano plot (C), with patients in columns and genes in rows. Clinical characteristics of the patients are shown above the heatmap as a continuous variable or discrete variable as indicated in the figure legend. F, A heatmap of gene expression differences of the populations in the volcano plot (D); components and labels are the same as in E. G, Bar graph shows log fold change gene expression of the six genes that were found to be significantly differentially expressed in both the MC and CD34-enriched cells (CD34).
Figure 7.
MPN gene expression. Gene expression in ET, PV, PrePMF and MF cells or enriched CD34-positive hematopoietic stem cells was studied by RNA-seq. A, Table summarizes the cell types and disease types included in the differential gene expression analyses. B, PCA of the gene expression patterns shows clustering of CD34 cells versus the BMMC/PBMC and lymphocyte-depleted PBMC. C, A volcano plot illustrates differentially expressed genes between the MF and the ET/PV/PrePMF cohorts when the mononuclear cell (MC) samples were analyzed. The red dots represent 223 genes significantly upregulated and 99 downregulated. D, Volcano plot illustrates differentially expressed genes between CD34-positive HSPC from MF versus ET/PV/PrePMF cohorts. The red dots show four genes significantly upregulated and five downregulated. E, The heatmap represents gene expression differences of the populations in the volcano plot (C), with patients in columns and genes in rows. Clinical characteristics of the patients are shown above the heatmap as a continuous variable or discrete variable as indicated in the figure legend. F, A heatmap of gene expression differences of the populations in the volcano plot (D); components and labels are the same as in E. G, Bar graph shows log fold change gene expression of the six genes that were found to be significantly differentially expressed in both the MC and CD34-enriched cells (CD34).

References

    1. Barbui T, Thiele J, Gisslinger H, Kvasnicka HM, Vannucchi AM, Guglielmelli P, et al. . The 2016 WHO classification and diagnostic criteria for myeloproliferative neoplasms: document summary and in-depth discussion. Blood Cancer J 2018;8:15. - PMC - PubMed
    1. Vannucchi AM, Lasho TL, Guglielmelli P, Biamonte F, Pardanani A, Pereira A, et al. . Mutations and prognosis in primary myelofibrosis. Leukemia 2013;27:1861–9. - PubMed
    1. Tefferi A, Lasho TL, Guglielmelli P, Finke CM, Rotunno G, Elala Y, et al. . Targeted deep sequencing in polycythemia vera and essential thrombocythemia. Blood Adv 2016;1:21–30. - PMC - PubMed
    1. Abdel-Wahab O, Adli M, LaFave Lindsay M, Gao J, Hricik T, Shih Alan H, et al. . ASXL1 mutations promote myeloid transformation through loss of PRC2-mediated gene repression. Cancer Cell 2012;22:180–93. - PMC - PubMed
    1. Yang Y, Akada H, Nath D, Hutchison RE, Mohi G. Loss of Ezh2 cooperates with Jak2V617F in the development of myelofibrosis in a mouse model of myeloproliferative neoplasm. Blood 2016;127:3410–23. - PMC - PubMed

Publication types