Undiagnosed Cancer Cases in the US During the First 10 Months of the COVID-19 Pandemic
- PMID: 38386344
- PMCID: PMC10884945
- DOI: 10.1001/jamaoncol.2023.6969
Undiagnosed Cancer Cases in the US During the First 10 Months of the COVID-19 Pandemic
Abstract
Importance: The COVID-19 pandemic disrupted the normal course of cancer screening and detection in the US. A nationwide analysis of the extent of this disruption using cancer registry data has not been conducted.
Objective: To assess the observed and expected cancer rate trends for March through December 2020 using data from all 50 US states and the District of Columbia.
Design, settings, and participants: This was a population-based cross-sectional analysis of cancer incidence trends using data on cases of invasive cancer diagnosis reported to the US Cancer Statistics from January 1, 2018, through December 31, 2020. Data analyses were performed from July 6 to 28, 2023.
Exposure(s): Age, sex, race, urbanicity, and state-level response to the COVID-19 pandemic at the time of cancer diagnosis.
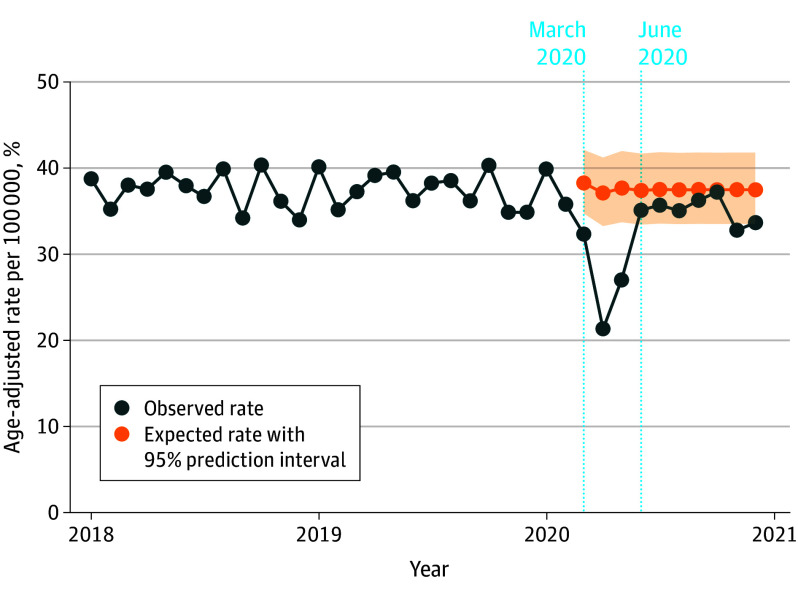
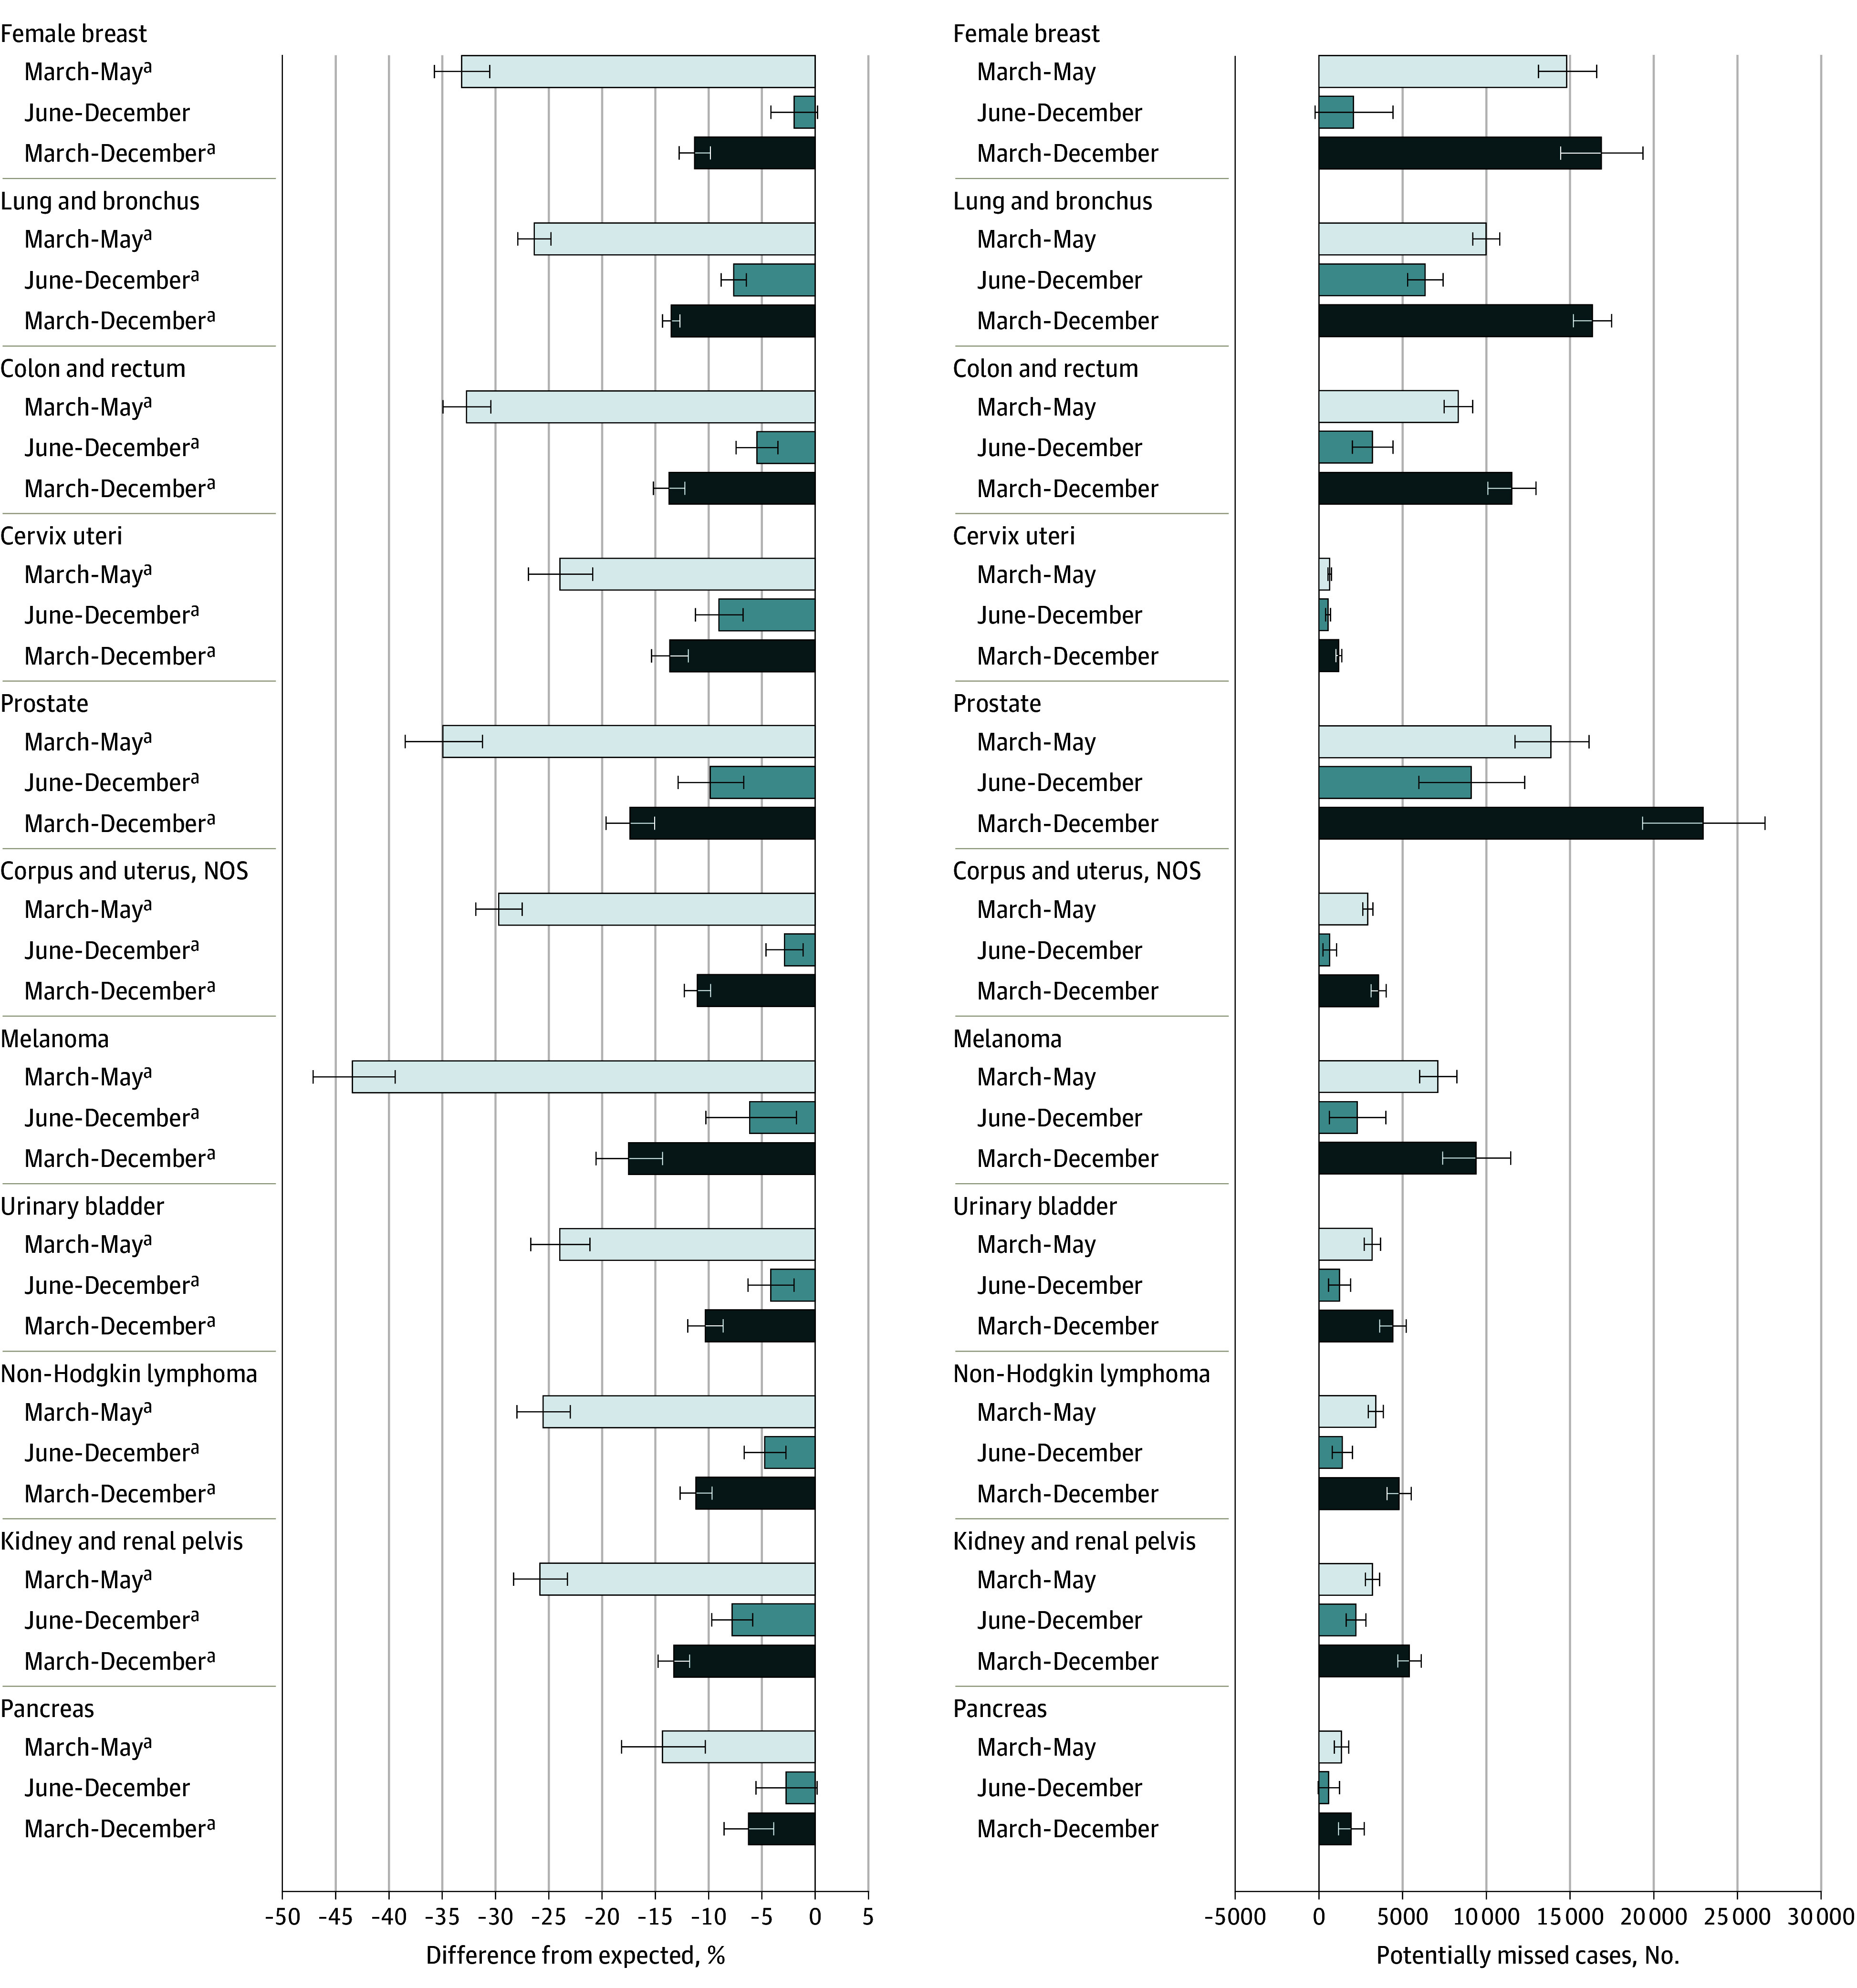
Main outcomes and measures: Used time-series forecasting methods to calculate expected cancer incidence rates for March 1 through December 31, 2020, from prepandemic trends (January 2018-February 2020). Measured relative difference between observed and expected cancer incidence rates and numbers of potentially missed cancer cases.
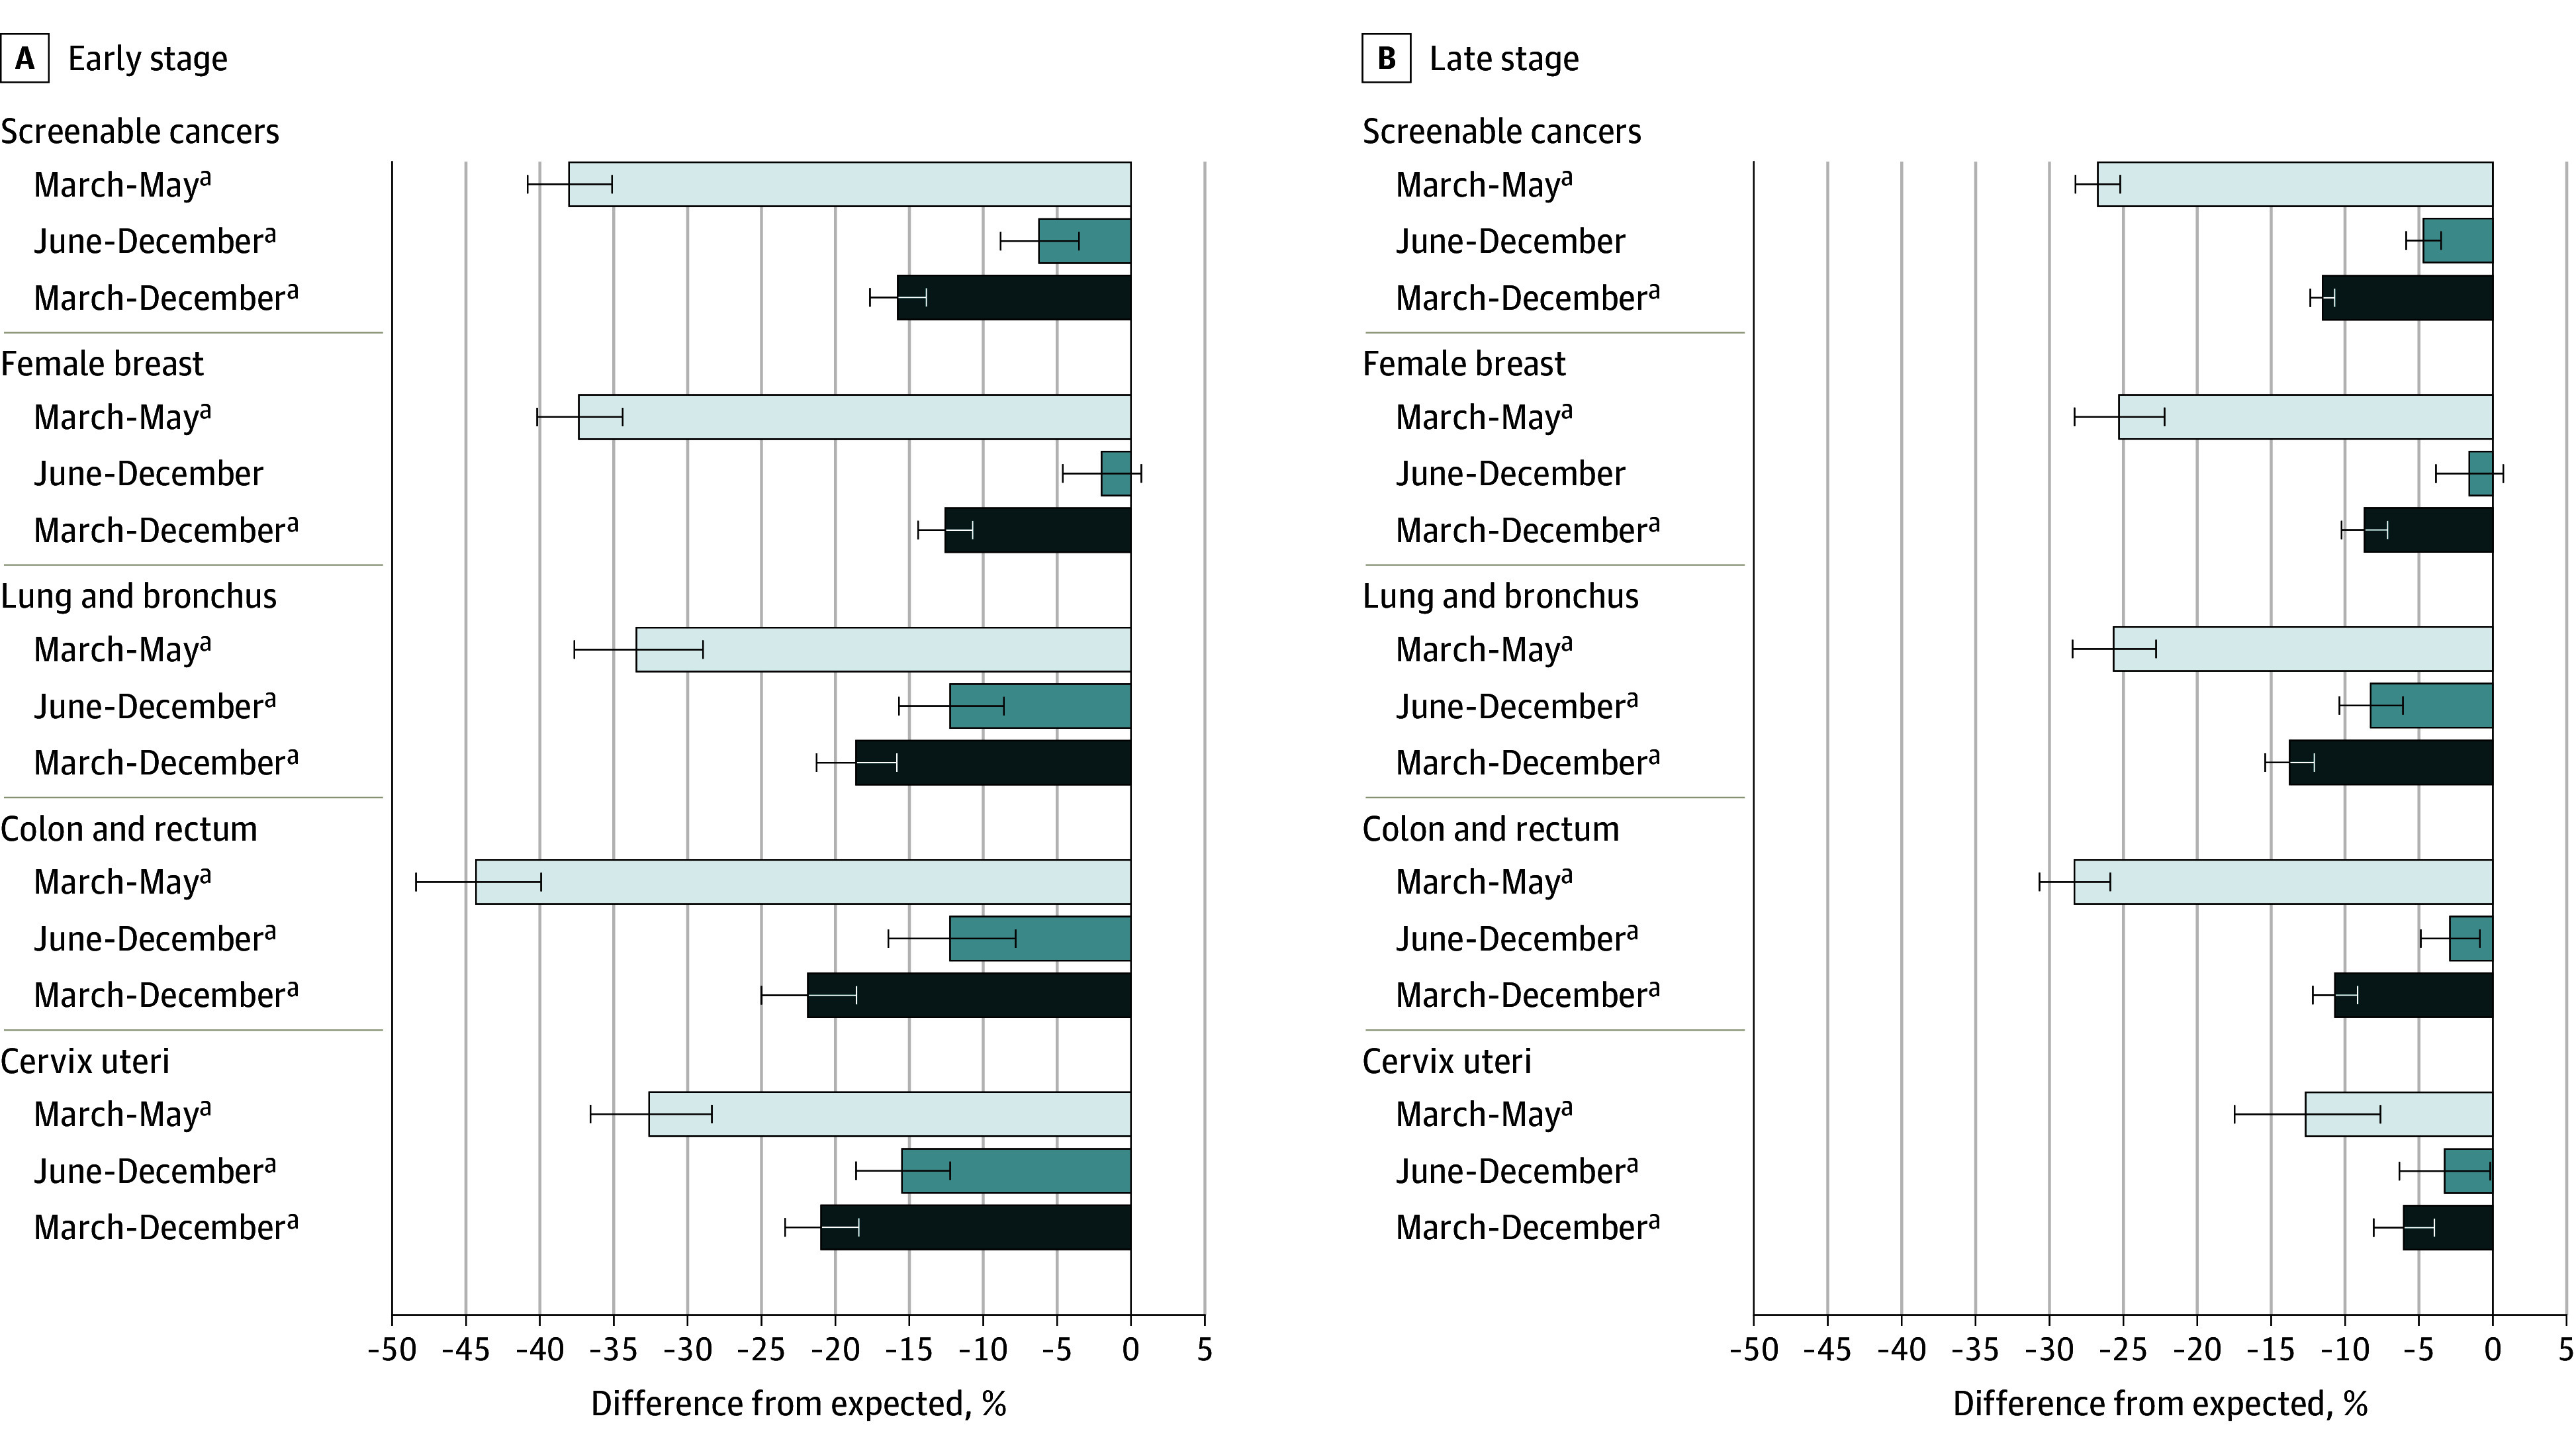
Results: This study included 1 297 874 cancer cases reported in the US from March 1 through December 31, 2020, with an age-adjusted incidence rate of 326.5 cases per 100 000 population. Of the observed cases, 657 743 (50.7%) occurred in male patients, 757 106 (58.3%) in persons 65 years or older, and 1 066 566 (82.2%) in White individuals. Observed rates of all-sites cancer incidence in the US were 28.6% (95% prediction interval [PI], 25.4%-31.7%) lower than expected during the height of the COVID-19 pandemic response (March-May 2020); 6.3% (95% PI, 3.8%-8.8%) lower in June to December 2020; and overall, 13.0% (95% PI, 11.2%-14.9%) lower during the first 10 months of the pandemic. These differences indicate that there were potentially 134 395 (95% PI, 112 544-156 680) undiagnosed cancers during that time frame. Prostate cancer accounted for the largest number of potentially missed cases (22 950), followed by female breast (16 870) and lung (16 333) cancers. Screenable cancers saw a total rate reduction of 13.9% (95% PI, 12.2%-15.6%) compared with the expected rate. The rate of female breast cancer showed evidence of recovery to previous trends after the first 3 months of the pandemic, but levels remained low for colorectal, cervical, and lung cancers. From March to May 2020, states with more restrictive COVID-19 responses had significantly greater disruptions, yet by December 2020, these differences were nonsignificant for all sites except lung, kidney, and pancreatic cancer.
Conclusions and relevance: This cross-sectional analysis of cancer incidence trends found a substantial disruption to cancer diagnoses in the US during the first 10 months of the COVID-19 pandemic. The overall and differential findings can be used to inform where the US health care system should be looking to make up ground in cancer screening and detection.
Conflict of interest statement
Figures
References
Publication types
MeSH terms
Grants and funding
LinkOut - more resources
Full Text Sources
Medical
Research Materials
Miscellaneous