. 2024 Feb 1;13(2):18.
doi: 10.1167/tvst.13.2.18.

Simulating the Effects of Partial Neural Conduction Delays in the Visual Evoked Potential

Affiliations

Simulating the Effects of Partial Neural Conduction Delays in the Visual Evoked Potential

Enyam K A Morny et al. Transl Vis Sci Technol. .

Abstract

Purpose: The purpose of this study was to understand the double peaks or broadening of P100 observed in some cases of optic neuritis by inducing conduction delays in healthy eyes through stimulus luminance manipulation in analogy to the perceptual Pulfrich effect.

Methods: Checkerboard pattern reversal visual evoked potentials (VEPs) with check sizes of 0.8 degrees, 0.4 degrees, and 0.2 degrees were recorded in healthy participants using two experiment variants. Variant (1) involved binocular stimulation with inter-ocular luminance difference achieved by a 1.8 neutral density (ND) filter, along with monocular control conditions. Variant (2) included monocular stimulation with hemifields having a luminance difference (half of monitor with ND filter), along with single-hemifield control conditions. In both variants, VEP curves under mixed stimulation were compared to synthesized VEPs computed from offline summation of curves from the relevant control conditions, followed by assessing P100 characteristics.

Results: Despite considerable variability between participants, the binocular variant demonstrated marked differences between VEPs from mixed recordings and synthesized curves, whereas in the hemifield variant, agreement was strong. The anticipated double peak or broadened deflection pattern was observed to varying extents in participants, often contingent on check size, with nominal peak time frequently failing to indicate partial conduction delays.

Conclusions: The present findings corroborate the hypothesis that nominal peak time does not always reflect conduction delays if only a subset of fiber bundles is affected. Peak shape might provide additional diagnostic evidence of a partial conduction delay.

Translational relevance: Enhancing the understanding of VEP waveform changes associated with partial conduction delays could offer diagnostic insights for optic neuritis.


Conflict of interest statement

Disclosure: E.K.A. Morny, None; J. Haldina, None; S.P. Heinrich, None

Figures

Figure 1.
Figure 1.
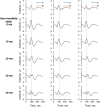
VEP traces of a case of optic neuritis followed up for 2 years, with normal right eye and affected left eye. Left: VEP is almost flat at day 0, double peaks appear at day 30, persist through day 182, and disappear by day 758. Credit: Treatment of Optic Neuritis with Erythropoietin Study.
Figure 2.
Figure 2.
Participant and stimulus set up for VEP recording. Two variants of the experiment were recorded. (A) Interocular variant following the classical induction of the Pulfrich effect and (B) inter-hemifield variant following a modified Pulfrich-like effect for monocular induction. ND – neutral density filter; RE – right eye; LE – left eye; OU – VEP with both eyes open; OUND – VEP with both eyes open but with 1.8 ND in front of right eye; OD – VEP from right eye only; OS – VEP from left eye only; ODND – VEP from right eye only but with 1.8 ND in front of it; Lscr – Left half of screen; Rscr – right half of screen; FS – VEP from full screen (also the same as OD in panel A); FSND – VEP from full screen with 1.8 ND in front of left half of screen; LH – VEP from left hemifield; RH – VEP from right hemifield; LHND – VEP from left hemifield with 1.8 ND covering it.
Figure 3.
Figure 3.
Example VEP traces of four participants for the interocular variant. First column shows the comparison of control VEP traces from the right (OD, blue trace) and left (OS, orange trace) eyes. Second column compares the real control binocular VEP trace (OU-Real, black trace) and its synthesized counterpart (OU-Sim, yellow dash trace). Third column shows the comparison between the VEP of the right eye with a 1.8 ND in front of it (ODND) and the unfiltered left eye (OS). Fourth column compares the binocular VEP recorded with both eyes open but with a 1.8 ND in front of the right eye (OUND, red trace), and its synthesized counterpart (blue dash trace). The traces are arranged vertically in order of increasing time difference between the P100 of the ODND and OS. The time differences are shown as numbers in the boxes in the third column.
Figure 4.
Figure 4.
Example VEP traces of four participants for the inter-hemifield variant. Participants are the same as in Figure 3. First column shows the comparison of control traces from the right (RH, blue trace) and left (LH, orange trace) hemifields. Second column compares the real control full screen VEP trace (FS-Real, black trace) and its synthesized counterpart (FS-Sim, yellow dash trace). Third column shows the comparison between the VEP of the unfiltered right hemifield (RH) and the left 1.8 ND filtered hemifield (LHND). Fourth column compares full screen VEP recorded with from the right eye but with a 1.8 ND in front of the left hemifield (FSND, red trace), to its synthesized counterpart (blue dash trace). The traces are arranged vertically in order of increasing time difference between the P100 of the RH and LHND. The time differences are shown as numbers in the boxes in the third column.
Figure 5.
Figure 5.
Left column: correlation between the interocular difference (IOD) in amplitude (between filtered [ODND] and unfiltered [OD] eye) and the amplitude of test binocular VEP (OUND), as well as the correlation between the IOD in implicit time and the implicit time of the OUND. Right column: Correlation between the inter-hemifield difference (IHD) in amplitude (between filtered [LHND] and unfiltered [LH] hemifield0 and the amplitude of test monocular VEP (FSND) as well as correlation between the IHD in implicit time and the implicit time of the FSND.
Figure 6.
Figure 6.
Grand mean traces for the various control and test conditions for three check sizes. The VEP traces are shown on the left half are composed of data from all the 15 participants whereas the PERG traces in the right half are composed of data from six participants.
Figure 7.
Figure 7.
Comparison of P100 amplitude (top row) and implicit time (bottom row) between control (solid colors) and test (hatched colors) conditions for interocular (left) and inter-hemifield (right) conditions. Outlier data were values greater than 3 times the interquartile range above the third quartile (upper outliers) or below the first quartile (lower outliers) and are circled.
Figure 8.
Figure 8.
Interaction of hypothetical waves. The first column shows the results of combining two identical waves (A and B; top row) with increasing time differences in implicit time from 0 m to 40 ms in 10 ms steps (rows 2 to 5). The second column shows the case when wave A is twice the size of wave B and the final column shows the case when wave A is half the size of wave B. In all three cases, wave A is fixed in time, whereas wave B is shifted in time to the right.

Similar articles

References

    1. Fahle M, Bach M.. Origin of the visual evoked potential. In: Heckenlively J, Arden G, eds. Principles and Practice of Clinical Electrophysiology of Vision. Cambridge, MA: MIT Press; 2006: 207–234.
    1. Odom JV, Bach M, Brigell M, et al. .. ISCEV standard for clinical visual evoked potentials: (2016 update). Documenta Ophthalmologica. 2016; 133(1): 1–9, doi:10.1007/s10633-016-9553-y. - DOI - PubMed
    1. Matthews WB, Small DG, Small M, Pountney E.. Pattern reversal evoked visual potential in the diagnosis of multiple sclerosis. J Neurol Neurosurg Psychiatry. 1977; 40(10): 1009–1014, doi:10.1136/jnnp.40.10.1009. - DOI - PMC - PubMed
    1. Jones SJ, Brusa A.. Neurophysiological evidence for long-term repair of MS lesions: implications for axon protection. J Neurol Sci. 2003; 206(2): 193–198, doi:10.1016/S0022-510X(02)00428-8. - DOI - PubMed
    1. Halliday AM, McDonald WI, Mushin J.. Visual evoked response in diagnosis of multiple sclerosis. BMJ. 1973; 4(5893): 661–664, doi:10.1136/bmj.4.5893.661. - DOI - PMC - PubMed