. 2024 Apr;11(16):e2304501.
doi: 10.1002/advs.202304501. Epub 2024 Feb 22.

Tumor-Associated Monocytes Reprogram CD8+ T Cells into Central Memory-Like Cells with Potent Antitumor Effects

Affiliations

Tumor-Associated Monocytes Reprogram CD8+ T Cells into Central Memory-Like Cells with Potent Antitumor Effects

Zeliang Yang et al. Adv Sci (Weinh). 2024 Apr.

Abstract

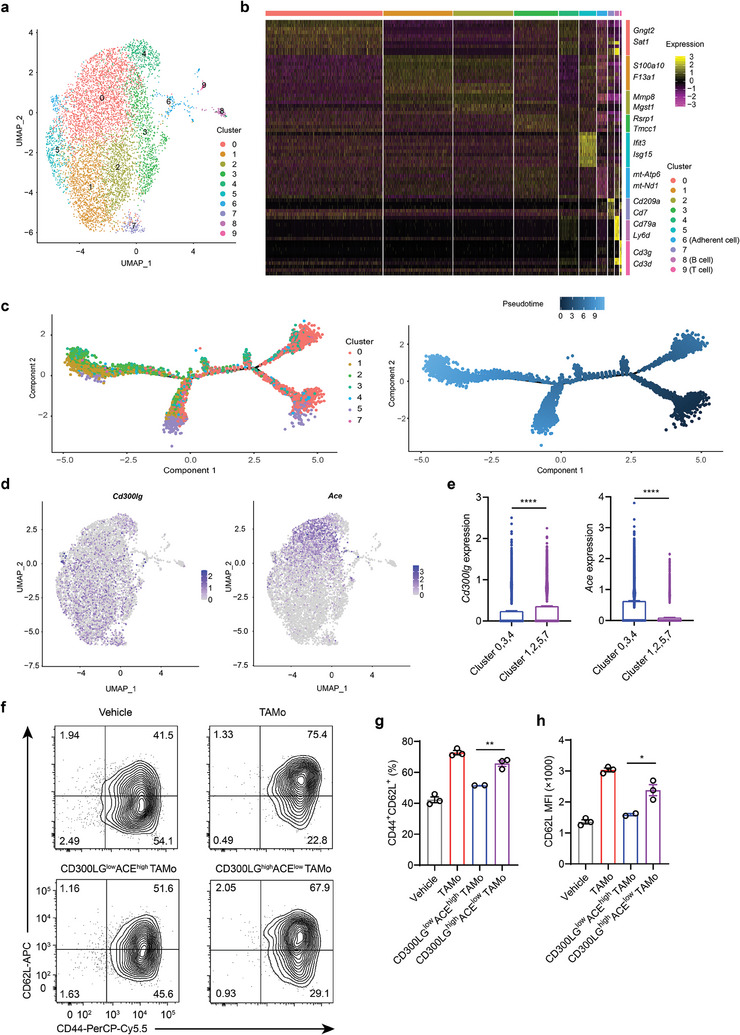
CD8+ T cells are critical for host antitumor responses, whereas persistent antigenic stimulation and excessive inflammatory signals lead to T cell dysfunction or exhaustion. Increasing early memory T cells can improve T cell persistence and empower T cell-mediated tumor eradication, especially for adoptive cancer immunotherapy. Here, it is reported that tumor-associated monocytes (TAMos) are highly correlated with the accumulation of CD8+ memory T cells in human cancers. Further analysis identifies that TAMos selectively reprogram CD8+ T cells into T central memory-like (TCM-like) cells with enhanced recall responses. L-NMMA, a pan nitric oxide synthase inhibitor, can mitigate TAMo-mediated inhibition of T cell proliferation without affecting TCM-like cell generation. Moreover, the modified T cells by TAMo exposure and L-NMMA treatment exhibit long-term persistence and elicit superior antitumor effects in vivo. Mechanistically, the transmembrane protein CD300LG is involved in TAMo-mediated TCM-like cell polarization in a cell-cell contact-dependent manner. Thus, the terminally differentiated TAMo subset (CD300LGhighACElow) mainly contributes to TCM-like cell development. Taken together, these findings establish the significance of TAMos in boosting T-cell antitumor immunity.

Keywords: CD300LG; T cell exhaustion; T central memory‐like cells; nitric oxide synthase; tumor‐associated monocytes (TAMos).


Conflict of interest statement

The authors declare no conflict of interest.

Figures

Figure 1
Figure 1
Tumor‐associated monocytes are related to TM cell abundance. a) The correlation and p value between monocyte scores and SELL, IL7R, CCR7 mRNA levels in different types of tumor tissues. b) PBMCs from lung cancer patients were stimulated with anti‐CD3 and anti‐CD28 antibodies plus rhIL‐2 for 96 h. The percentage of monocytes in untreated PBMCs and expression levels of the memory markers CD62L and CCR7 in CD8+ T cells from stimulated PBMCs were determined by flow cytometry, followed by Pearson's correlation test (n = 13). c) Overall survival curves of TCGA LIHC and SKCM patients grouped by mean expression values of monocyte signature genes (n (LIHC) = 364 patient samples, n (SKCM) = 458 patient samples). d), CD14 expression levels in tumor tissue samples from melanoma patients with PD, PR, or CR using RNA‐seq data from GSE100797_ACT_Melanoma or GSE91061_αPD‐1_Melanoma cohorts. Data are shown as means ± SEM d). Statistical significance was assessed using Pearson's correlation test a,b) a log‐rank (Mantel‐Cox) test c) or a two‐tailed unpaired Student's t test d). * p < 0.05, ** p < 0.01.
Figure 2
Figure 2
TAMos derived from the spleens of tumor‐bearing mice promote TCM cell generation. a) CD8+ T cells were cocultured with TAMos or TANs from the spleens of LLC tumor‐bearing mice (four pooled mice) and stimulated with anti‐CD3 and anti‐CD28 antibodies (α‐CD3 + α‐CD28), followed by flow cytometry to determine the proportion of CD44+CD62L+ cells in the activated CD8+ T cells (n = 3 cell cultures). FMO, fluorescence minus one. b–d) Expression levels of CD62L b), CCR7 c), and IL‐7R d) in CD8+ T cells cocultured with TAMos or TANs in the presence of anti‐CD3 and anti‐CD28 antibodies (n = 3 cell cultures). FMO, fluorescence minus one. e) OT‐I cells were cocultured with TAMos or TANs sorted from the spleens of LLC tumor‐bearing mice (six pooled mice) under OVA257‐264 stimulation, and the percentages of CD44+CD62L+ cells were determined by flow cytometry (n = 3 cell cultures). FMO, fluorescence minus one. f) CD62L, CCR7, and IL‐7R expression levels in OT‐I CD8+ T cells cocultured with TAMos or TANs in the presence of OVA257‐264 peptides (n = 3 cell cultures). g,h) TANs, TAMos, or TAMs were sorted from B16‐OVA tumor‐bearing mice (ten pooled mice) and cocultured with OT‐I cells under OVA257‐264 stimulation. CD44+CD62L+ cell proportions (g, n = 3 cell cultures) and CD62L levels (h, n = 3 cell cultures) in CD8+ T cells were determined by flow cytometry. Data are representative of three independent experiments and shown as means ± SEM. Statistical significance was assessed using a two‐tailed unpaired Student's t test. * p < 0.05, ** p < 0.01, *** p < 0.001, and **** p < 0.0001. NS, not significant.
Figure 3
Figure 3
TAMos reprogram the T cell landscape during T cell activation. RNA‐seq analysis a–d) of CD8+ T cells purified from coculture systems in which murine OT‐I cells were exposed to vehicle, TAMos, or TANs sorted from the spleens of LLC tumor‐bearing mice and stimulated with OVA257‐264 peptides (n = 2 cell cultures). a) Principal components analysis of transcriptomes of CD8+ T cells under different conditions. b) Enrichment analysis of upregulated genes in T cells cocultured with TAMos compared with T cells cultured alone using GO datasets. Pathways related to T cell biological processes are highlighted in red. c) Bubble map displaying the similarities among vehicle, TAN, or TAMo‐treated murine T cells and different T cell subsets isolated from the PBMCs and tumor tissues of human NSCLC patients. TNaïve, naïve T cells; TCM, central memory T cells; TEM, effector memory T cells; TEFF, effector T cells; TEX, exhausted T cells. d) GSEA plots showing representative pathways enriched in murine CD8+ T cells cocultured with TAMos or cultured alone. NES, normalized enrichment score. e) CD8+ T cells were cultured alone or cocultured with TAMos derived from the spleens of LLC tumor‐bearing mice (five pooled mice) and stimulated with anti‐CD3 and anti‐CD28 antibodies for 48 h, followed by flow cytometry to determine TCF‐1 and EOMES protein levels. Unstained activated CD8+ T cells were used as a negative control (n = 3 cell cultures). f) IGV plots of ATAC‐seq peaks at Ccr7, Sell, Tcf7, Eomes, Ifng, Prf1, Ctla4, or Il10 loci in OT‐I CD8+ T cells cultured alone or cocultured with TAMos derived from the spleens of LLC tumor‐bearing mice. Data are representative of three independent experiments e) and shown as means ± SEM. Statistical significance was assessed using a two‐tailed unpaired Student's t test e). ** p < 0.01.
Figure 4
Figure 4
TAMos potentiate the T cell memory phenotype and attenuate the T cell exhaustion state after antigen rechallenge. a) Flow diagram illustrating the protocol used for antigen rechallenge experiments. b) Expanded CD8+ T cells were cocultured with TAMos derived from the spleens of LLC tumor‐bearing mice at different ratios and reactivated with anti‐CD3 and anti‐CD28 antibodies for 48 h, followed by flow cytometry to determine the percentages of CD44+CD62L+ cells and CD62L levels (four pooled mice, n = 3 cell cultures). c) CD8+ T cells were sorted from the TME of LLC tumor‐bearing mice and cocultured with autogenous TAMos in the presence of anti‐CD3 and anti‐CD28 antibodies plus IL‐2 for 48 h, followed by flow cytometry to determine the percentages of CD44+CD62L+ cells in CD8+ T cells (eight pooled mice, n = 3 cell cultures). d) Expression levels of PD‐1 in CD8+ T cells sorted from the TME of LLC or B16‐OVA tumor‐bearing mice and cocultured with TAMos after anti‐CD3 and anti‐CD28 plus IL‐2 stimulation for 48 h (eight pooled LLC tumor‐bearing mice or six pooled B16‐OVA tumor‐bearing mice, n = 3 cell cultures). e,f) Human CD8+ T cells and TAMos were sorted from PBMCs of lung cancer patients (n = 7 pooled samples). CD8+ T cells were cultured alone or cocultured with the sorted TAMos and activated with anti‐CD3 and anti‐CD28 antibodies plus rhIL‐2 for 96 h, followed by flow cytometry to determine the proportions of different T cell subsets (e, TNaïve, CCR7+CD45RO; TCM, CCR7+CD45RO+; TEM, CCR7CD45RO+; TEFF, CCR7CD45RO; n = 3 cell cultures) and CD62L expression levels in CD8+ T cells (f, n = 3 cell cultures). FMO, fluorescence minus one. Data are representative of two independent experiments and shown as means ± SEM b–f). Statistical significance was assessed using a two‐tailed unpaired Student's t test b–f). * p < 0.05, ** p < 0.01, *** p < 0.001, and **** p < 0.0001. NS, not significant.
Figure 5
Figure 5
TAMos promote TCM cell differentiation independent of NOS2‐mediated inhibition of T cell proliferation. a,b) CFSE‐labeled CD8+ T cells were cultured alone or cocultured with TAMos derived from the spleens of LLC tumor‐bearing mice (ten pooled mice) in the presence or absence of L‐NMMA under stimulation of anti‐CD3 and anti‐CD28 antibodies, and T cell proliferation was determined by mean fluorescence intensity of CFSE at 12, 24, or 48 h post T cell activation (n = 3 cell cultures). c) NO concentrations in supernatants of CD8+ T cell activated with anti‐CD3 and anti‐CD28 antibodies alone (Vehicle), in the presence of L‐NMMA, in the presence of TAMos or in the presence of TAMos and L‐NMMA (n = 3 cell cultures). ND, not detected. d,e) Flow cytometry analysis of the proportions of different T cell subsets (d, n = 3 cell cultures) and the expression levels of CD62L, CCR7, IL‐7R, and TCF‐1 (e, n = 3 cell cultures) in activated CD8+ T cells cultured alone or cocultured with TAMos sorted from LLC tumor‐bearing mice (ten pooled mice) for 12, 24, or 48 h with or without L‐NMMA. Data are shown as means ± SEM. Statistical significance was assessed using a two‐tailed unpaired Student's t test. ** p < 0.01, *** p < 0.001, and **** p < 0.0001. NS, not significant.
Figure 6
Figure 6
T cells cocultured with TAMos exhibited enhanced antitumor activity in vitro and in vivo independent of NO signaling. a) Diagram illustrating protocol for T cell killing assay. b) OT‐I cells were cultured alone or cocultured with TAMos derived from the spleens of LLC tumor‐bearing mice (ten pooled mice) and activated with OVA257‐264 peptides for 48 h in the presence or absence of L‐NMMA, followed by incubation with LLC‐OVA tumor cells. The percentages of specific lysis were determined by flow cytometry (n = 3 cell cultures). E refers to effector cells (OT‐I cells); T refers to target cells (LLC‐OVA tumor cells). c) Flow diagram illustrating the adoptive T cell transfer model. d–h) OT‐I cells were cultured alone or cocultured with TAMos derived from the spleens of LLC tumor‐bearing mice (twenty pooled mice) in the presence or absence of L‐NMMA upon OVA257‐264 stimulation for 48 h. After expansion for 4 days using IL‐2, those T cells were transferred into NOD‐SCID mice bearing LLC‐OVA tumor. d) Fold changes in the number of T cells in different groups after IL‐2 expansion normalized by the vehicle‐treated T cell group (n = 3 replicates). e) Tumor volumes in the different groups of mice were monitored every two days (n = 5 mice per group). f,g) On day 4 after T cell transfer, the proportions of CD8+ T cells in TDLNs (f, n = 6 or 7 mice per group) and tumors (g, n = 7 or 8 mice per group) were determined by flow cytometry. h) Flow cytometry analysis showing the expression levels of TCF‐1 and TOX in transferred CD8+ T cells infiltrating tumors (n = 7 or 8 mice per group). FMO, fluorescence minus one. Data are shown as means ± SEM. Statistical significance was assessed using a two‐tailed unpaired Student's t test b,d,f–h) or two‐way ANOVA e). ** p < 0.01, **** p < 0.0001. NS, not significant.
Figure 7
Figure 7
CD300LG upregulated in TAMos is associated with TCM cell differentiation. a) Schematic representation of the direct coculture and Transwell indirect coculture protocols with OT‐I T cells and TAMos. b) OT‐I T cells were cocultured with TAMos sorted from the spleens of LLC tumor‐bearing mice (nine pooled mice) together or in a Transwell system for 48 h, followed by flow cytometry to determine percentages of CD44+CD62L+ cells in CD8+ T cells (n = 3 cell cultures). c) Venn diagram denoting the overlap of genes encoding the top upregulated surface transmembrane proteins in TAMos (fold change > 10, adjusted p value < 0.05 and FPKM > 0.5) from the spleens and the TME of tumor‐bearing mice. d) Schematic plot of the MCTOC screening assay. e) Flow cytometry analysis of fold changes of TCM cell percentages in CD8+ T cells from coculture of OT‐I T cells and mitomycin C‐treated HEK293T cells expressing mCherry‐tagged mock or surface transmembrane proteins (n = 2 cell cultures). f) The proportion of TCM cells in CD8+ T cells from coculture of OT‐I T cells and mitomycin C‐treated HEK293T cells expressing mCherry‐tagged mock or CD300LG protein. g) Flow cytometry analysis showing CD300LG levels in TAMos expressing shRNA targeting Cd300lg or scramble shRNA. h) OT‐I T cells were cocultured with TAMos infected with lentivirus encoding shRNA targeting Cd300lg or scramble shRNA during T cell activation, followed by flow cytometry to determine proportion of TCM cells. i) Coomassie‐stained SDS‐polyacrylamide gel of recombinant CD300LG‐EC. j,k) OT‐I cells were cultured in the presence of recombinant CD300LG‐EC for 48 h during T cell activation, followed by flow cytometry to determine percentages of CD44+CD62L+ cells (j, n = 3 cell cultures) and the expression levels of TCF‐1, EOMES, IL‐7R, and CD62L (k, n = 3 cell cultures). Data are representative of two independent experiments b,e–h) and shown as means ± SEM b,e,h,j,k). Statistical significance was assessed using a two‐tailed unpaired Student's t test b,e,h,j,k). NS, not significant, * p < 0.05, ** p < 0.01, **** p < 0.0001.
Figure 8
Figure 8
CD300LGhighACElow subset in TAMos plays a major role in TCM cell differentiation. ScRNA‐seq analysis of TAMos purified from the spleens of B16‐OVA tumor‐bearing mice (twelve pooled mice, a–e). a) UMAP plot showing ten subclusters of TAMos utilizing graph‐based clustering (n = 7113 single cells). b) Heatmap showing scaled expression patterns of the top marker genes in each cell cluster. Clusters 8 and 9 represent B and T cells, respectively. Cluster 6 represents adherent cells. c) Trajectory of cells from the TAMo clusters 0–5 and 7 using the Monocle 2 algorithm. Each dot represents a single cell (n = 6788 cells). d) UMAP plots showing expression levels of Cd300lg and Ace in the different clusters of TAMos. e) Cd300lg and Ace expression levels in clusters 0, 3, 4 and clusters 1, 2, 5, 7 of TAMos. f–h) CD8+ T cells were cocultured with purified TAMos, CD300LGlowACEhigh TAMos, or CD300LGhighACElow TAMos derived from B16‐OVA tumor‐bearing mice (five pooled mice) or cultured alone in the presence of anti‐CD3 and anti‐CD28 antibodies, followed by flow cytometry to determine proportions of CD44+CD62L+ cells f,g) and CD62L levels h) in CD8+ T cells (n = 2 or 3 cell cultures). Data are representative of two independent experiments f–h) and shown as means ± SEM e,g,h). Statistical significance was assessed using a two‐tailed unpaired Student's t test e,g,h). *p < 0.05, ** p < 0.01, **** p < 0.0001.

Similar articles

Cited by

References

    1. Oliveira G., Wu C. J., Nat. Rev. Cancer 2023, 23, 295. - PMC - PubMed
    1. Fraietta J. A., Nobles C. L., Sammons M. A., Lundh S., Carty S. A., Reich T. J., Cogdill A. P., Morrissette J. J. D., DeNizio J. E., Reddy S., Hwang Y., Gohil M., Kulikovskaya I., Nazimuddin F., Gupta M., Chen F., Everett J. K., Alexander K. A., Lin‐Shiao E., Gee M. H., Liu X., Young R. M., Ambrose D., Wang Y., Xu J., Jordan M. S., Marcucci K. T., Levine B. L., Garcia K. C., Zhao Y., Nature 2018, 558, 307. - PMC - PubMed
    1. Zhang Q., Ding J., Sun S., Liu H., Lu M., Wei X., Gao X., Zhang X., Fu Q., Zheng J., Am. J. Cancer Res. 2019, 9, 2379. - PMC - PubMed
    1. Mo F., Yu Z., Li P., Oh J., Spolski R., Zhao L., Glassman C. R., Yamamoto T. N., Chen Y., Golebiowski F. M., Hermans D., Majri‐Morrison S., Picton L. K., Liao W., Ren M., Zhuang X., Mitra S., Lin J. X., Gattinoni L., Powell J. D., Restifo N. P., Garcia K. C., Leonard W. J., Nature 2021, 597, 544. - PMC - PubMed
    1. Jameson S. C., Masopust D., Immunity 2018, 48, 214. - PMC - PubMed

Publication types

LinkOut - more resources