. 2024 Feb 22;134(7):e170559.
doi: 10.1172/JCI170559.

Comparative genomics incorporating translocation renal cell carcinoma mouse model reveals molecular mechanisms of tumorigenesis

Affiliations

Comparative genomics incorporating translocation renal cell carcinoma mouse model reveals molecular mechanisms of tumorigenesis

Gopinath Prakasam et al. J Clin Invest. .

Abstract

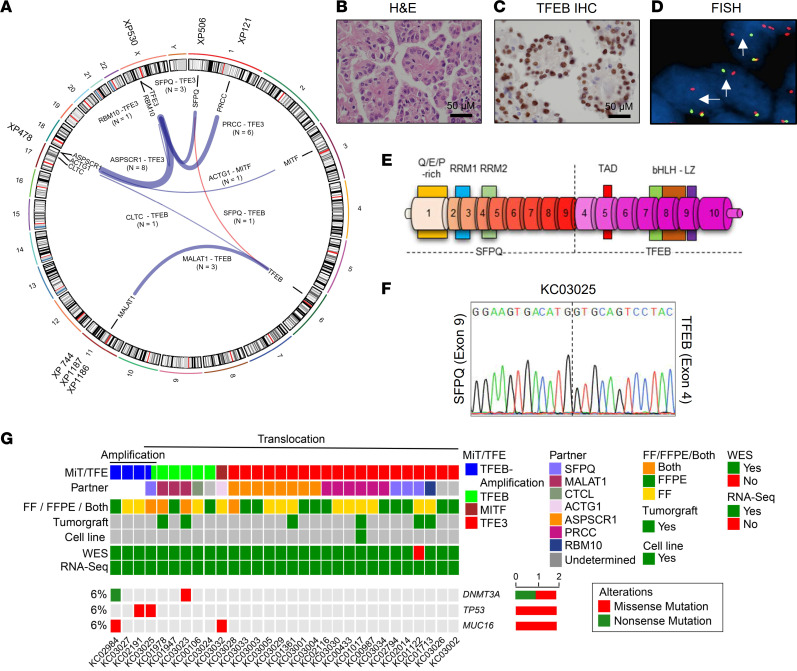
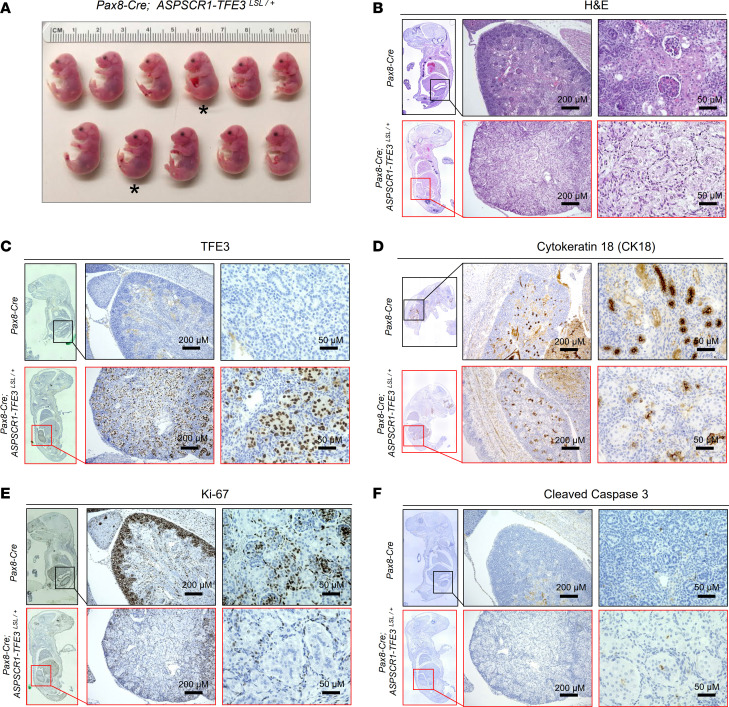
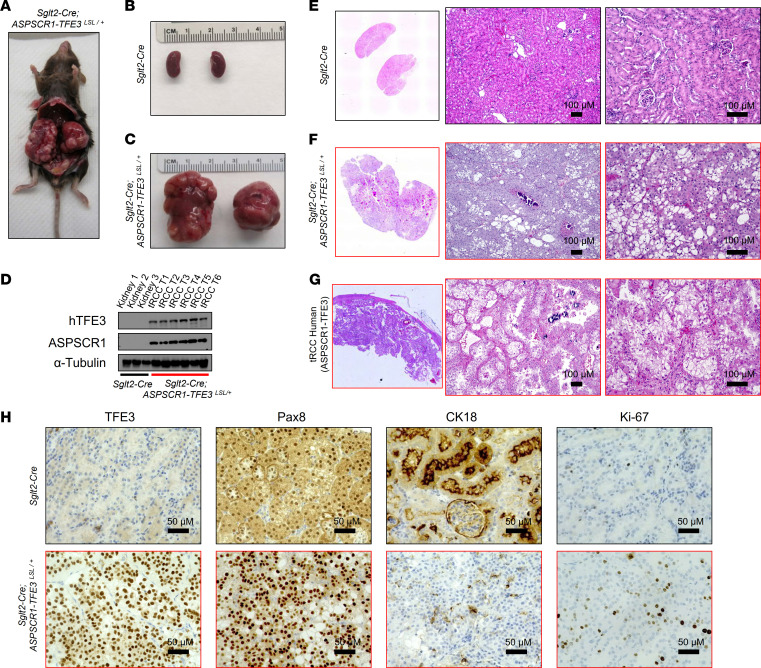
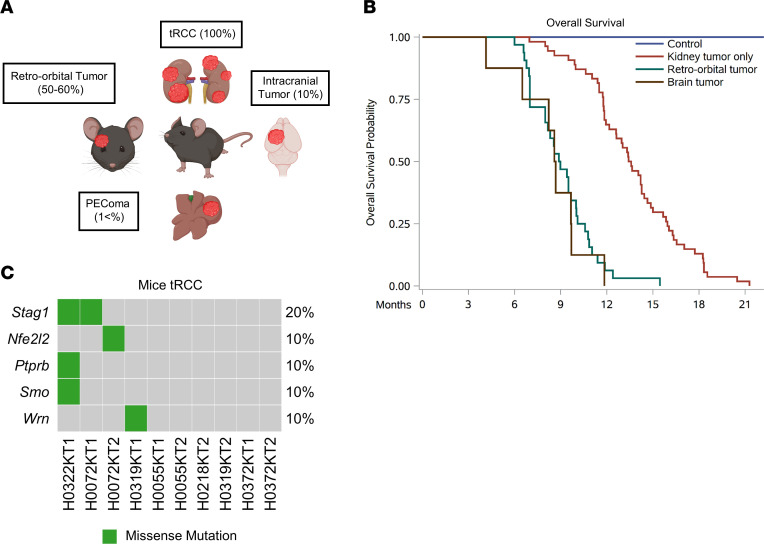
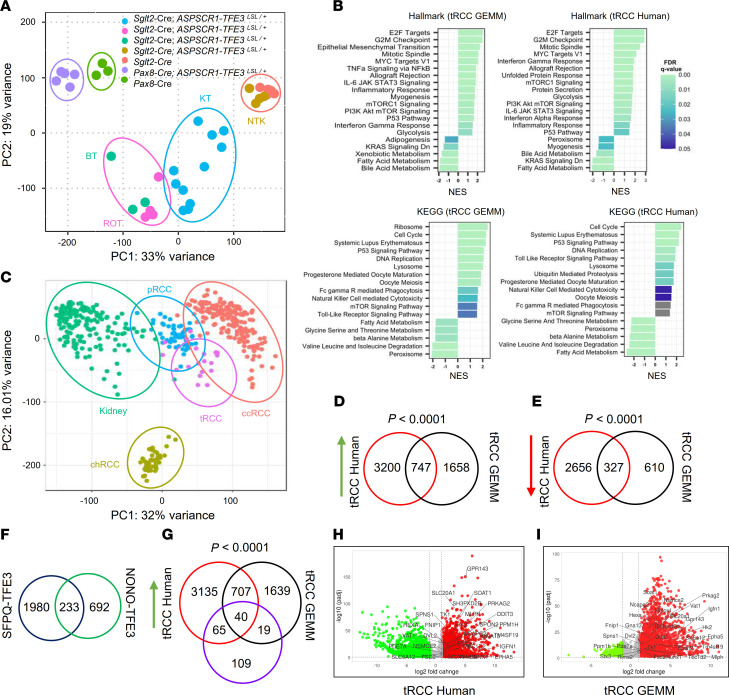
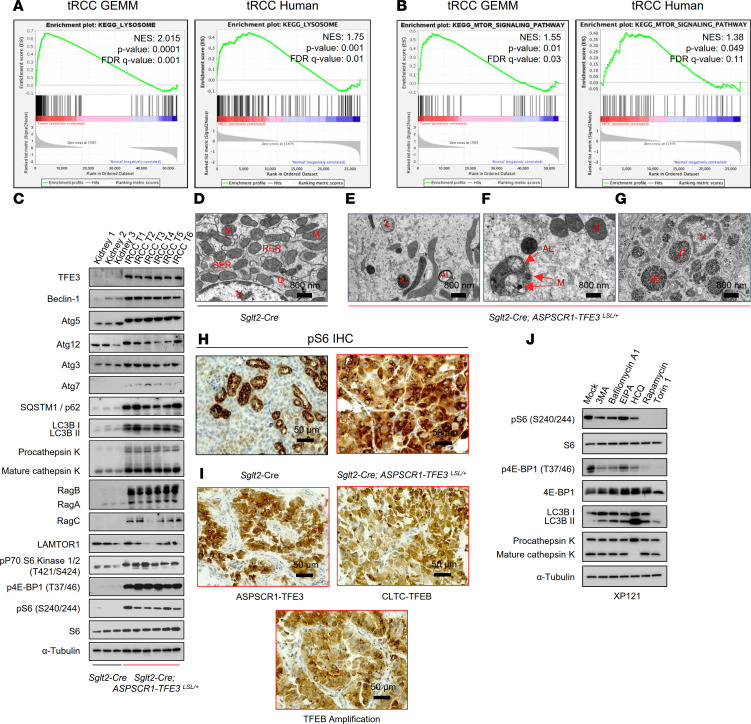
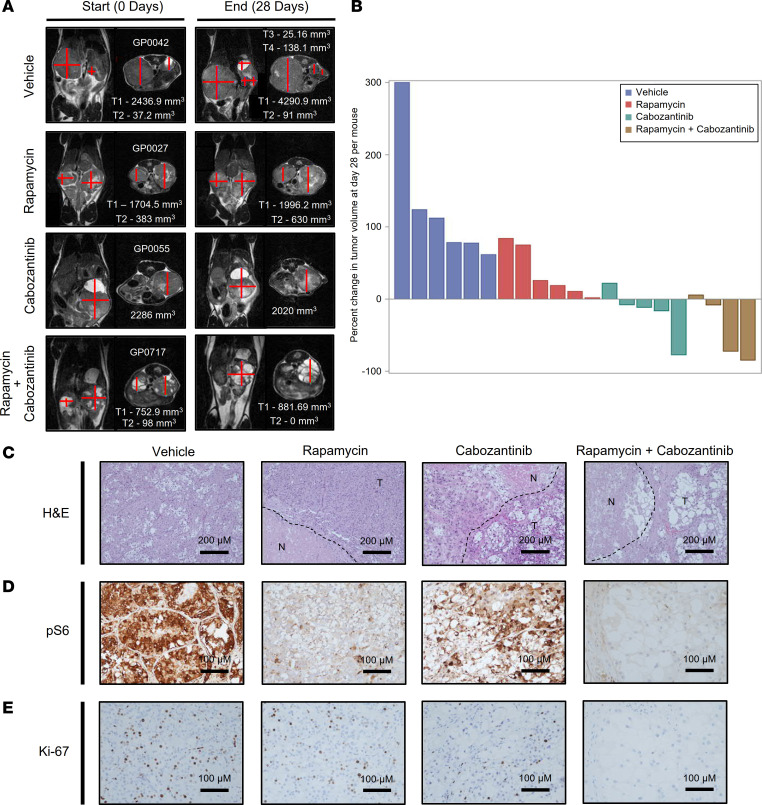
Translocation renal cell carcinoma (tRCC) most commonly involves an ASPSCR1-TFE3 fusion, but molecular mechanisms remain elusive and animal models are lacking. Here, we show that human ASPSCR1-TFE3 driven by Pax8-Cre (a credentialed clear cell RCC driver) disrupted nephrogenesis and glomerular development, causing neonatal death, while the clear cell RCC failed driver, Sglt2-Cre, induced aggressive tRCC (as well as alveolar soft part sarcoma) with complete penetrance and short latency. However, in both contexts, ASPSCR1-TFE3 led to characteristic morphological cellular changes, loss of epithelial markers, and an epithelial-mesenchymal transition. Electron microscopy of tRCC tumors showed lysosome expansion, and functional studies revealed simultaneous activation of autophagy and mTORC1 pathways. Comparative genomic analyses encompassing an institutional human tRCC cohort (including a hitherto unreported SFPQ-TFEB fusion) and a variety of tumorgraft models (ASPSCR1-TFE3, PRCC-TFE3, SFPQ-TFE3, RBM10-TFE3, and MALAT1-TFEB) disclosed significant convergence in canonical pathways (cell cycle, lysosome, and mTORC1) and less established pathways such as Myc, E2F, and inflammation (IL-6/JAK/STAT3, interferon-γ, TLR signaling, systemic lupus, etc.). Therapeutic trials (adjusted for human drug exposures) showed antitumor activity of cabozantinib. Overall, this study provides insight into MiT/TFE-driven tumorigenesis, including the cell of origin, and characterizes diverse mouse models available for research.

Keywords: Cancer; Cell biology; Molecular genetics; Mouse models; Oncology.


Conflict of interest statement

Conflict of interest: ORT serves as a consultant for Eisai and has received honoraria from Bristol Myers Squibb, Ipsen, Pfizer, Sanofi, Janssen-Cilag, and Bayer. ZM and SD hold Roche stock. JB serves as a consultant for Eisai, Johnson and Johnson, Exelixis, Telix, and Calithera; was a recipient of a research grant from Arrowhead Pharmaceuticals; has a patent, “Methods of identifying and treating patients with HIF-2 inhibitor resistance” (US patent 11,576,889-B2); and has patent applications, “Biomarkers of response to HIF-2α inhibition in cancer and methods for the use thereof” (US application no. 17/206,895) and “PET radiopharmaceuticals for non-invasive evaluation of HIF-2α” (US application no. 17/153,128).

Figures

Figure 1
Figure 1. MiT/TFE gene rearrangements and mutational landscape of UTSW tRCC cohort.
(A) Circos plot with weighted lines for MiT/TFE gene fusions identified by RNA-Seq (n = 24). A previously unreported SFPQ-TFEB gene fusion t(6;1) (p21.1; p34.3) is shown in red. Where available, tumorgrafts are included in the periphery. (BD) Characterization of novel SFPQ-TFEB tRCC case (KC03025) by H&E (B), TFEB IHC (C), and FISH using TFEB break-apart probes stained with CytoRed and CytoGreen (D). Scale bar: 50 μm (B and C). (E) Illustration of SFPQ-TFEB chimeric transcript. RRM, RNA recognition motif; TAD, transcription activation domain; bHLH, basic helix-loop-helix domain; LZ, leucine zipper. (F) Sanger sequencing electropherogram (one direction shown) of SFPQ-TFE3 gene fusion cDNA. (G) Oncoprint representation of somatic mutations for COSMIC database genes in tRCC cohort (n = 30).
Figure 2
Figure 2. Characterization of the Pax8-Cre; ASPSCR1-TFE3LSL/+ model.
(A) Macroscopic images of fetuses at E19–20 (Pax8-Cre; ASPSCR1-TFE3LSL/+ fetuses marked by an asterisk). (B) H&E-stained images of representative Pax8-Cre; ASPSCR1-TFE3LSL/+ fetuses and littermate controls. (CF) IHC for TFE3 (using human-specific antibody), CK18, Ki-67, and cleaved caspase-3 in kidneys from Pax8-Cre; ASPSCR1-TFE3LSL/+ fetuses compared with controls. Scale bars: 200 μm, middle panels; 50 μm, right panels.
Figure 3
Figure 3. Characterization of Sglt2-Cre; ASPSCR1-TFE3LSL/+ tRCC model.
(A) Gross anatomical image of 13-month-old Sglt2-Cre; ASPSCR1-TFE3LSL/+ mouse with multiple bilateral renal tumors. (B and C) Macroscopic images of the kidney from a representative 13-month-old Sglt2-Cre (control) (B) and an age-matched Sglt2-Cre; ASPSCR1-TFE3LSL/+ mouse (C). (D) Western blot analysis of Sglt2-Cre; ASPSCR1-TFE3LSL/+ tRCC tumors and control kidneys (Sglt2-Cre) for human TFE3 and ASPSCR1. (E and F) H&E staining of murine kidney tumor and control kidney. Scale bars: 100 μm. (G) H&E images of a human ASPSCR1-TFE3 fusion tRCC. Scale bars: 100 μm. (H) IHC for TFE3 (human-specific antibody), Pax8, CK18, and Ki-67 in Sglt2-Cre; ASPSCR1-TFE3LSL/+ tRCC tumor and control mouse kidney. Scale bars: 50 μm.
Figure 4
Figure 4. Sglt2-Cre; ASPSCR1-TFE3LSL/+ tumors and tRCC mutational landscape.
(A) Illustration highlighting tumors in Sglt2-Cre; ASPSCR1-TFE3LSL/+ mice. (B) Kaplan-Meier survival analyses of Sglt2-Cre; ASPSCR1-TFE3LSL/+ mice that exclusively developed kidney tumors (n = 54) or additional retro-orbital tumors (n = 32) or brain tumors (n = 8) compared with Sglt2-Cre control mice (n = 10). (C) Oncoprint representation of murine tRCC with somatically mutated genes (COSMIC).
Figure 5
Figure 5. Comparative transcriptomic analyses of murine and human tRCC.
(A) Principal component analysis (PCA) representation of normalized gene expression read counts of kidney tumors (KT), retro-orbital tumors (ROT), intracranial brain tumors (BT), and non-tumor kidney (NTK) from Sglt2-Cre; ASPSCR1-TFE3LSL/+ mice (or adult Sglt2-Cre kidney controls) as well as deformed kidneys from Pax8-Cre; ASPSCR1-TFE3LSL/+ fetuses and fetal kidney controls (Pax8-Cre). (B) GSEA for Hallmark or KEGG gene signatures exhibiting top upregulated and downregulated pathways enriched in murine and human tRCC. NES, normalized enrichment score; FDR, false discovery rate. (C) PCA plot representation of normalized gene expression read counts for the UTSW pan-RCC cohort — tRCC (n = 19), clear cell RCC (ccRCC) (n = 193), papillary RCC (pRCC) (n = 55), and chromophobe RCC (chRCC) (n = 43) — and tumor-matched normal kidney (n = 179). (D) Venn diagram of significantly upregulated genes in human and murine tRCC. (E) Venn diagram of significantly downregulated genes in human and murine tRCC. (F) Venn diagram of SFPQ-TFE3 and NONO-TFE3 direct target genes from 2 independent ChIP-Seq studies. (G) Venn diagram of significantly upregulated genes in human/mouse tRCC and their interaction with shared (SFPQ-TFE3 and NONO-TFE3) direct target genes. Hypergeometric tests were carried out to test the overlap between gene expression signatures (D, E, and G). (H and I) Volcano plots of differentially expressed genes in human (H) and murine (I) tRCC. Green, downregulated genes; red, upregulated genes; gray, unchanged genes. Putative direct targets of MiT/TFE fusion protein are marked.
Figure 6
Figure 6. Simultaneous activation of mTORC1 and autophagy-lysosome pathways in tRCC.
(A and B) GSEA plots for lysosome (A) and mTOR signaling pathway (B) in murine and human tRCC. NES, normalized enrichment score; FDR, false discovery rate. (C) Western blot analyses of murine tRCC (Sglt2-Cre; ASPSCR1-TFE3LSL/+) and control kidneys (Sglt2-Cre). Assembly from membranes of different gels run with the same protein lysate. (DG) Representative transmission electron micrographs of Sglt2-Cre kidney (control) (D) and tRCC from Sglt2-Cre; ASPSCR1-TFE3LSL/+ mice showing atypical mitochondria and abundant lysosome/autolysosome (E), engulfed organelles (F), and intra-lysosomal glycogen (G). AL, autolysosome; G, Golgi; L, lysosome; LG, lysosomal glycogen; M, mitochondria; N, nucleus; RER, rough endoplasmic reticulum; SER, smooth endoplasmic reticulum. Scale bars: 800 nm. (H) IHC for phospho-S6 of murine tRCC model and control. Scale bars: 50 μm. (I) IHC for phospho-S6 of human tRCC (representative cases shown with TFE3 gene fusion, TFEB gene fusion, and TFEB amplification). Scale bars: 50 μm. (J) Western blot analysis of XP121 cells treated with 3MA (5 mM), bafilomycin-A1 (1 nM), EIPA (50 μM), hydroxychloroquine (HCQ; 25 μM), rapamycin (100 nM), and Torin 1 (250 nM) for 24 hours.
Figure 7
Figure 7. Inhibition of tRCC growth by cabozantinib and rapamycin.
(A) Representative MRI images of Sglt2-Cre; ASPSCR1-TFE3LSL/+ mice with kidney tumor volume measurements (see Methods) at baseline and end of the trial. (B) Waterfall plot with percentage change in overall kidney tumor burden per mouse. (CE) Representative H&E and IHC (phospho-S6 and Ki-67) at the end of drug trials. N, necrosis; T, tumor. Scale bars: 200 μm (C); 100 μm (D and E).

References

    1. Argani P. MiT family translocation renal cell carcinoma. Semin Diagn Pathol. 2015;32(2):103–113. doi: 10.1053/j.semdp.2015.02.003. - DOI - PubMed
    1. Malouf GG, et al. Genomic heterogeneity of translocation renal cell carcinoma. Clin Cancer Res. 2013;19(17):4673–4684. doi: 10.1158/1078-0432.CCR-12-3825. - DOI - PMC - PubMed
    1. Argani P, et al. Xp11 translocation renal cell carcinoma in adults: expanded clinical, pathologic, and genetic spectrum. Am J Surg Pathol. 2007;31(8):1149–1160. doi: 10.1097/PAS.0b013e318031ffff. - DOI - PubMed
    1. Shipley JM, et al. Mapping the X chromosome breakpoint in two papillary renal cell carcinoma cell lines with a t(X;1) (p11.2;q21.2) and the first report of a female case. Cytogenet Cell Genet. 1995;71(3):280–284. doi: 10.1159/000134127. - DOI - PubMed
    1. Weterman MA, et al. Fusion of the transcription factor TFE3 gene to a novel gene, PRCC, in t(X;1) (p11;q21)-positive papillary renal cell carcinomas. Proc Natl Acad Sci U S A. 1996;93(26):15294–15298. doi: 10.1073/pnas.93.26.15294. - DOI - PMC - PubMed

MeSH terms

Substances