. 2024 Mar 26;43(3):113823.
doi: 10.1016/j.celrep.2024.113823. Epub 2024 Feb 21.

Kin17 regulates proper cortical localization of Miranda in Drosophila neuroblasts by regulating Flfl expression

Affiliations

Kin17 regulates proper cortical localization of Miranda in Drosophila neuroblasts by regulating Flfl expression

Marisa Connell et al. Cell Rep. .

Abstract

During asymmetric division of Drosophila larval neuroblasts, the fate determinant Prospero (Pros) and its adaptor Miranda (Mira) are segregated to the basal cortex through atypical protein kinase C (aPKC) phosphorylation of Mira and displacement from the apical cortex, but Mira localization after aPKC phosphorylation is not well understood. We identify Kin17, a DNA replication and repair protein, as a regulator of Mira localization during asymmetric cell division. Loss of Kin17 leads to aberrant localization of Mira and Pros to the centrosome, cytoplasm, and nucleus. We provide evidence to show that the mislocalization of Mira and Pros is likely due to reduced expression of Falafel (Flfl), a component of protein phosphatase 4 (PP4), and defects in dephosphorylation of serine-96 of Mira. Our work reveals that Mira is likely dephosphorylated by PP4 at the centrosome to ensure proper basal localization of Mira after aPKC phosphorylation and that Kin17 regulates PP4 activity by regulating Flfl expression.

Keywords: CP: Cell biology; CP: Developmental biology; Drosophila; Falafel; Kin17; Miranda; Prospero; cell polarity; neuroblast; protein phosphatase 4; splicing.


Conflict of interest statement

Declaration of interests The authors declare no competing interests.

Figures

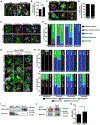
Figure 1.
Figure 1.. Kin17 knockdown leads to a reduction in brain size and nuclear Pros.
(A,B) Brain size in control (ctrl), Kin17 RNAi, and Kin17 rescue brains. Scale bar, 50 μm; n ≥ 6 brains. (C,D) Quantification of type I neuroblast (NB) number in Kin17 RNAi brains. Scale bars, 50 μm; n ≥ 10 brains. (E,F) Mitotic index in Kin17 RNAi. Yellow circles, mitotic NBs; White circles, non-mitotic NBs; Scale bars, 20 μm; n=3 biological replicates. (G) Pros+ progeny in Kin17 RNAi brains. Yellow arrowheads, Pros+ GMCs; white dashed line, Pros+, Elav+ neurons; Scale bars, 50 μm. (H) Quantification of GMC number in Kin17 RNAi NB lineages. N ≥ 6 brains with each n representing an average of 5 lineages from 1 brain. (I,J) Pros staining in Kin17 RNAi brains and quantification of the NBs with nuclear Pros. Scale bars, 5 μm; n ≥ 8 brains. (K,L) Pros nuclear localization in Kin17 RNAi; pros17/+ NBs. Dashed lines outline NBs. Scale bar, 5 μm; n ≥ 6 brains. (M,N) Mitotic index in Kin17 RNAi; pros17/+ NBs. Yellow circles, mitotic NBs; Grey circles, non-mitotic NBs; Scale bar, 20 μm; n ≥ 8 brains. (O) Pros+ progeny in Kin17 RNAi; pros17/+ brains. Scale bar, 50 μm. (P) Quantification of GMC number in Kin17 RNAi; pros17/+ NB lineages. n ≥ 7 brains with each n represents an average of 5 lineages from 1 brain. (Q) Quantification of brain size in Kin17 RNAi; pros17/+ brains. n ≥ 7 brains. Data are presented as the mean ± 1 Standard deviation (SD). n.s., not significant; **, p<0.01; ***, p<0.001, unpaired student’s t-test for (D) and unpaired student’s t-test with the Bonferroni correction for (B, H, J, L, N, P, Q).
Figure 2.
Figure 2.. Kin17 knockdown leads to centrosomal localization of Pros and Mira.
(A,B) Pros localization to the centrosome (marked by Pericentrin-like protein (Plp)) in ctrl and Kin17 RNAi; pros17/+ NBs. Inset, Pros localization at apical (yellow boxes) and basal (grey boxes) centrosomes; Scale bars, 5 μm; n ≥ 16 NBs. (C,D) Mira localization in ctrl, Kin17 RNAi, pros17/+, and Kin17 RNAi pros17/+ NBs throughout the cell cycle. Inset, Mira localization at apical (yellow boxes) and basal (grey boxes) centrosomes; Arrow, Mira localization on spindle; Scale bar, 5 μm; n ≥ 18 NBs. (E,F) Cortical localization of Mira in ctrl, pros17/+, and Kin17 RNAi pros17/+ NBs. Metaphase depicts normal (left) and weak (right) basal cortical localization of Mira. Scale bars, 5 μm; n ≥ 18 NBs. (G,H) Colocalization of Mira and Pros at the centrosome in Kin17 RNAi NBs. Insets, Grey boxes, Pros; Purple boxes, Mira; Scale bar, 5 μm; r, Spearman coefficient; n = 50 NBs. (I,J) Neuroblast numbers in Kin17 and Eiger single knockdown or double knockdown brains. Scale bar, 5 μm; n ≥ 6 brains. Data are presented as the mean ± 1 SD. n.s., not significant; **, p<0.001; ***, p<0.001, unpaired student’s t-test for (B), unpaired student’s t-test with the Bonferroni correction for (D, J), and Spearmann’s rank correlation coefficient for (H). See also Figures S1 and S2.
Figure 3.
Figure 3.. Phosphorylation of Mira residue S96 is required and sufficient for centrosomal localization.
(A,B) Localization of MiraWT-mCherry, MiraS96D-mCherry, and MiraS96A-mCherry in NBs. Inset, Mira localization at apical (yellow boxes) and basal (grey boxes) centrosomes; Arrow, spindle localization of Mira; Scale bar, 5 μm; n ≥ 30 NBs. (C) Localization of MiraWT-mCherry, MiraS96D-mCherry, and MiraS96A-mCherry in syncytial embryos. Scale bar, 25 μm. (D,E) Nuclear localization of Pros in embryonic NBs homozygous for MiraWT-mCherry, MiraS96D-mCherry, and MiraS96A-mCherry. Arrow, centrosome; Arrowhead, nuclear Pros; Scale bar, 5 μm; n ≥ 8 embryos. (F,G) Pros localization to the centrosome in interphase embryonic NBs homozygous for MiraWT-mCherry, MiraS96D-mCherry, and MiraS96A-mCherry. Yellow boxes, Pros localization at the centrosome; Scale bar, 5 μm; n ≥ 80 NBs. Data are presented as the mean ± 1 SD. **, p<0.01; ***, p<0.001, unpaired student’s t-test with the Bonferroni correction. See also Figure S3.
Figure 4.
Figure 4.. PP4 is required for displacement of Mira from the centrosome.
(A,B) Localization of Mira in PP4-19c and Flfl RNAi NBs throughout the cell cycle. Inset, Mira localization at apical (yellow) and basal (grey) centrosomes; Scale bar, 5 μm; n ≥ 27 NBs. (C) IP of PP4-19c (left) and quantification of dephosphorylation of Mira phosho-Serine96 peptide by PP4 precipitates (right). n = 4 biological replicates. (D) Localization of RFP-Flfl in NBs. Arrowheads, mitotic spindle; Arrows, centrosome; Scale bar, 5 μm. (E,F) Localization of PP4-19c in ctrl and PP4-19c RNAi NBs. Inset, PP4-19c localization at apical (yellow) and basal (grey) centrosomes; Scale bar, 5 μm; n ≥ 61 NBs. (G,H) Localization of Mira in prophase NBs expressing V5-PACT or V5-Flfl-PACT. Inset, Mira localization at apical (yellow boxes) and basal (grey boxes) centrosomes; Scale bar, 5 μm; n ≥ 25 NBs. Data are presented as the mean ± 1 SD. n.s., not significant; *, p<0.05; **, p<0.01; ***, p<0.001, paired student’s t-test for (C), unpaired student’s t-test for (H), and unpaired Student’s t-test with the Bonferroni correction for (B, F). See also Figure S4.
Figure 5.
Figure 5.. Centrosomes are required for proper localization and dephosphorylation of Mira.
(A,B) Flfl levels in Sas-4 RNAi NBs. Dotted lines, NBs; Scale bar, 10 μm; n = 3 biological replicates. (C,D) aPKC localization in Sas-4 RNAi NBs. Arrows, apical aPKC crescent; Scale bar, 5 μm; n ≥ 116 NBs. (E,F) Cortical localization of Mira in Sas-4 RNAi NBs. Yellow arrows, cortex; Scale bar, 5 μm; n ≥ 29 NBs. (G,H) Localization of Mira in NBs expressing Sas-4 RNAi in combination with MiraWT, MiraS96D, and MiraS96A. Yellow arrows, cortex; white arrows, mitotic spindle; Scale bar, 5 μm; n ≥ 25 NBs. (I) Verification of specificity of antibody to recognize phosphorylated S96 of Mira. (J,K) Levels of phosphorylated S96 in ctrl and Sas-4 RNAi brains. n = 4 biological replicates. Data are presented as the mean ± 1 SD. n.s., not significant; *, p<0.05, paired student’s t-test for (B, K) and unpaired student’s t-test for (D).
Figure 6.
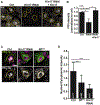
Figure 6.. Kin17 regulates Flfl levels and functions upstream of Flfl.
(A,B) Relative Flfl levels in ctrl, Kin17 RNAi, and Kin17 rescue NBs. Dotted lines, NBs [identified by size and CD8-GFP expression (not shown)]; Scale bar, 5 μm; n = 3 biological replicates. (C,D) PP4-19c localization in Kin17 RNAi and flfln42 NBs. Dashed circles, NBs. Ase staining indicates nucleus. Scale bar, 5 μm; n ≥ 51 NBs. Data are presented as the mean ± 1 SD. *, p<0.05; ***, p<0.001, paired student’s t-test with the Bonferroni correction for (B) and unpaired student’s t-test with the Bonferroni correction for (D).
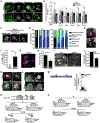
Figure 7.
Figure 7.. Kin17 regulates splicing of the flfl pre-mRNA.
(A,B) Localization of Mira throughout the cell cycle in u6atacK01105 (u6atac−/−) mutant and U2A RNAi NBs. Inset, Mira localization at apical (yellow boxes) and basal (grey boxes) centrosomes; Scale bar, 5 μm; n ≥ 19 NBs. (C,D) Cortical localization of Mira in metaphase u6atac−/− NBs. Arrows, basal cortex. Scale bar, 5 μm; n ≥ 19 NBs. (E,F) Pros nuclear localization in u6atac−/−mutant NBs. Dashed circles outline NBs. Scale bar, 5 μm; n ≥ 6 brains. (G,H) Mitotic Index in u6atac−/− mutant brains. Yellow circles, mitotic NBs; Grey circles, non-mitotic NBs; Scale bar, 20 μm; n ≥ 7 brains. (I,J) Flfl staining in u6atac−/− mutant NBs. Dashed circles, NBs; Scale bar, 10 μm; n = 3 biological replicates. (K) PP4-19c staining in u6atac−/− mutant NBs. Dashed circles, NBs; Scale bar. (L) Localization of Kin17-HA in NBs during interphase and mitosis. Scale bar, 5 μm. (M) Quantitative RT-PCR results for Flfl transcript. Left panel, position of primers. n = 8 biological replicates (N) RNA immunoprecipitation of flfl mRNA by Kin17-HA in Drosophila embryos. Top panel, IP of Kin17-HA proteins; Bottom panels, flfl RT-PCR products obtained from cDNA libraries generated from RIP immunoprecipitates. Lysate and IP samples were run on the same blot but images were taken from different exposures. (O) aPKC and Pros RT-PCR results obtained from cDNA libraries generated from RIP immunoprecipitates. Data are presented as the mean ± 1 SD. n.s., not significant; *, p<0.05; **, p<0.01; ***, p<0.001, unpaired student’s t-test with Bonferroni correction (B). unpaired Student’s t-test for (F, H), and paired Student’s t-test for (J).

Similar articles

Cited by

References

    1. Gómez-López S, Lerner RG, and Petritsch C (2014). Asymmetric cell division of stem and progenitor cells during homeostasis and cancer. Cellular and Molecular Life Sciences 71, 575–597. 10.1007/s00018-013-1386-1. - DOI - PMC - PubMed
    1. Homem CCF, and Knoblich JA (2012). Drosophila neuroblasts: a model for stem cell biology. Development 139, 4297–4310. 10.1242/dev.080515. - DOI - PubMed
    1. Hirata J, Nakagoshi H, Nabeshima YI, and Matsuzaki F (1995). Asymmetric segregation of the homeodomain protein Prospero during Drosophila development. Nature 377, 627–630. 10.1038/377627a0. - DOI - PubMed
    1. Knoblich JA, Jan LY, and Jan YN (1995). Asymmetric segregation of Numb and Prospero during cell division. Nature 377, 624–627. 10.1038/377624a0. - DOI - PubMed
    1. Bello B, Reichert H, and Hirth F (2006). The brain tumor gene negatively regulates neural progenitor cell proliferation in the larval central brain of Drosophila. Development 133, 2639–2648. 10.1242/dev.02429. - DOI - PubMed

Publication types

MeSH terms

LinkOut - more resources