Cross-tissue comparison of telomere length and quality metrics of DNA among individuals aged 8 to 70 years
- PMID: 38386656
- PMCID: PMC10883573
- DOI: 10.1371/journal.pone.0290918
Cross-tissue comparison of telomere length and quality metrics of DNA among individuals aged 8 to 70 years
Abstract
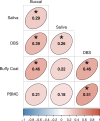
Telomere length (TL) is an important biomarker of cellular aging, yet its links with health outcomes may be complicated by use of different tissues. We evaluated within- and between-individual variability in TL and quality metrics of DNA across five tissues using a cross-sectional dataset ranging from 8 to 70 years (N = 197). DNA was extracted from all tissue cells using the Gentra Puregene DNA Extraction Kit. Absolute TL (aTL) in kilobase pairs was measured in buccal epithelial cells, saliva, dried blood spots (DBS), buffy coat, and peripheral blood mononuclear cells (PBMCs) using qPCR. aTL significantly shortened with age for all tissues except saliva and buffy coat, although buffy coat was available for a restricted age range (8 to 15 years). aTL did not significantly differ across blood-based tissues (DBS, buffy coat, PBMC), which had significantly longer aTL than buccal cells and saliva. Additionally, aTL was significantly correlated for the majority of tissue pairs, with partial Spearman's correlations controlling for age and sex ranging from ⍴ = 0.18 to 0.51. We also measured quality metrics of DNA including integrity, purity, and quantity of extracted DNA from all tissues and explored whether controlling for DNA metrics improved predictions of aTL. We found significant tissue variation: DNA from blood-based tissues had high DNA integrity, more acceptable A260/280 and A260/230 values, and greater extracted DNA concentrations compared to buccal cells and saliva. Longer aTL was associated with lower DNA integrity, higher extracted DNA concentrations, and higher A260/230, particularly for saliva. Model comparisons suggested that incorporation of quality DNA metrics improves models of TL, although relevant metrics vary by tissue. These findings highlight the merits of using blood-based tissues and suggest that incorporation of quality DNA metrics as control variables in population-based studies can improve TL predictions, especially for more variable tissues like buccal and saliva.
Copyright: © 2024 Wolf et al. This is an open access article distributed under the terms of the Creative Commons Attribution License, which permits unrestricted use, distribution, and reproduction in any medium, provided the original author and source are credited.
Conflict of interest statement
The authors have declared that no competing interests exist.
Figures


Similar articles
-
Evaluating minimally invasive sample collection methods for telomere length measurement.Am J Hum Biol. 2018 Jan;30(1):10.1002/ajhb.23062. doi: 10.1002/ajhb.23062. Epub 2017 Sep 26. Am J Hum Biol. 2018. PMID: 28949426 Free PMC article.
-
Coming up short: Comparing venous blood, dried blood spots & saliva samples for measuring telomere length in health equity research.PLoS One. 2021 Aug 18;16(8):e0255237. doi: 10.1371/journal.pone.0255237. eCollection 2021. PLoS One. 2021. PMID: 34407110 Free PMC article.
-
Comparison of Telomere Length between Buccal Cells and Blood Cells.Bull Exp Biol Med. 2022 Sep;173(5):677-679. doi: 10.1007/s10517-022-05612-1. Epub 2022 Oct 10. Bull Exp Biol Med. 2022. PMID: 36210421
-
Physical Activity on Telomere Length as a Biomarker for Aging: A Systematic Review.Sports Med Open. 2022 Sep 4;8(1):111. doi: 10.1186/s40798-022-00503-1. Sports Med Open. 2022. PMID: 36057868 Free PMC article.
-
Telomere length measurement by qPCR - Summary of critical factors and recommendations for assay design.Psychoneuroendocrinology. 2019 Jan;99:271-278. doi: 10.1016/j.psyneuen.2018.10.005. Epub 2018 Oct 10. Psychoneuroendocrinology. 2019. PMID: 30343983 Free PMC article. Review.
Cited by
-
How sample handling distorts telomere studies.Sci Rep. 2025 Jul 1;15(1):20427. doi: 10.1038/s41598-025-08303-9. Sci Rep. 2025. PMID: 40593162 Free PMC article.
-
Cross-tissue comparison of epigenetic aging clocks in humans.Aging Cell. 2025 Apr;24(4):e14451. doi: 10.1111/acel.14451. Epub 2025 Jan 9. Aging Cell. 2025. PMID: 39780748 Free PMC article.
-
DNAm age differences between infinium methylationEPICv1 vs EPICv2 in buffy coat, PBMC, and saliva samples.Commun Biol. 2025 Apr 23;8(1):654. doi: 10.1038/s42003-025-08021-y. Commun Biol. 2025. PMID: 40269264 Free PMC article.
-
Early origins of health and disease risk: The case for investigating adverse exposures and biological aging in utero, across childhood, and into adolescence.Child Dev Perspect. 2023 Dec;17(3-4):149-156. doi: 10.1111/cdep.12488. Epub 2023 Oct 16. Child Dev Perspect. 2023. PMID: 38706692 Free PMC article.
-
Telomere Dynamics in Post-Traumatic Stress Disorder: A Critical Synthesis.Biomedicines. 2025 Feb 18;13(2):507. doi: 10.3390/biomedicines13020507. Biomedicines. 2025. PMID: 40002919 Free PMC article. Review.
References
-
- Lapham K, Kvale MN, Lin J, Connell S, Croen LA, Dispensa BP, et al.. Automated Assay of Telomere Length Measurement and Informatics for 100,000 Subjects in the Genetic Epidemiology Research on Adult Health and Aging (Gera) Cohort. Genetics. 2015;200(4):1061–72. doi: 10.1534/genetics.115.178624 - DOI - PMC - PubMed
-
- Ye Q, Apsley AT, Etzel L, Hastings WJ, Kozlosky JT, Walker C, et al.. Telomere Length and Chronological Age across the Human Lifespan: A Systematic Review and Meta-Analysis of 414 Study Samples Including 743,019 Individuals. Ageing Research Reviews. 2023:102031. doi: 10.1016/j.arr.2023.102031 - DOI - PMC - PubMed
MeSH terms
Substances
Grants and funding
LinkOut - more resources
Full Text Sources

