. 2024 Feb 27;121(9):e2309153121.
doi: 10.1073/pnas.2309153121. Epub 2024 Feb 22.

OCA-B/Pou2af1 is sufficient to promote CD4+ T cell memory and prospectively identifies memory precursors

Affiliations

OCA-B/Pou2af1 is sufficient to promote CD4+ T cell memory and prospectively identifies memory precursors

Wenxiang Sun et al. Proc Natl Acad Sci U S A. .

Erratum in

Abstract

The molecular mechanisms leading to the establishment of immunological memory are inadequately understood, limiting the development of effective vaccines and durable antitumor immune therapies. Here, we show that ectopic OCA-B expression is sufficient to improve antiviral memory recall responses, while having minimal effects on primary effector responses. At peak viral response, short-lived effector T cell populations are expanded but show increased Gadd45b and Socs2 expression, while memory precursor effector cells show increased expression of Bcl2, Il7r, and Tcf7 on a per-cell basis. Using an OCA-B mCherry reporter mouse line, we observe high OCA-B expression in CD4+ central memory T cells. We show that early in viral infection, endogenously elevated OCA-B expression prospectively identifies memory precursor cells with increased survival capability and memory recall potential. Cumulatively, the results demonstrate that OCA-B is both necessary and sufficient to promote CD4 T cell memory in vivo and can be used to prospectively identify memory precursor cells.

Keywords: CD4 T cells; Pou2af1/OCA-B; immunological memory.


Conflict of interest statement

Competing interests statement:The authors declare no competing interest.

Figures
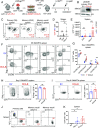
Fig. 1.
Fig. 1.
Ectopic OCA-B expression enhances CD4+ T cell memory recall responses in vivo. (A) Experimental schematic for OCA-B transduction and T cell mixed adoptive transfer. Ly5.1+ SMARTA cells were transduced with pMSCV-IRES-GFP (pMIGR1, EV), and Ly5.1+/5.2+ SMARTA cells were transduced with pMIGR1 expressing mouse OCA-B (pMIGR1-OCA-B). The donors were age- and sex-matched littermates. Two days following transduction, GFP+Ly5.1+ SMARTA cells (EV) and GFP+Ly5.1+/5.2+ SMARTA cells (OCA-B) were sorted, combined 1:1, cotransferred into Ly5.2+/5.2+ C57BL6/J recipient mice, and infected with LCMV. Recipients were tested for static memory on day 40 postinfection and also rechallenged with Lm-gp61 on day 40 analyzed after 7 d. (B) Lysates from primary CD4+ T cells transduced with either empty pMIGR1 (EV) or pMIGR1-OCA-B were immunoblotted using antibodies against OCA-B. Histone H3 is shown as an internal loading standard. (C) Flow cytometric analysis of Ly5.1+ pMIGR1 EV-transduced and Ly5.1+/5.2+ pMIGR1-OCA-B-transduced (OCA-B) SMARTA cells in the spleen and blood of a representative recipient mouse at peak effector response (D8), resting memory (D40) and memory recall (D40+7). Live cells were gated based on CD4 and GFP positivity. (D) Ratio of OCA-B/EV transduced cells at D8, D40, and D40+7. (E) GFP+ cell counts per spleen for EV and OCAB transduced cells D40 and D40+7 after LCMV infection. (F) D8 response representative flow cytometry plots showing Tbet, Gzmb, Bcl6, Tcf1, and CXCR5 expression in splenic GFP+ CD4+ T cells by EV or OCA-B transduction condition. (G) Percentages of CXCR5Tbet+, CXCR5Gzmb+, CXCR5+Bcl6+, and CXCR5+Tcf1+ cells comparing EV vs. OCA-B transduction condition at peak response. Individual mice are connected by lines. (H) Representative flow plots and frequency quantification of IFNγ producing GFP+ EV or OCA-B transduced cells. (I) Representative flow plots and frequency quantification of Ki67 producing GFP+ EV or OCA-B transduced cells. (J) Representative plots showing relative percentages of splenic EV- or pMIGR1-OCA-B-transduced (GFP+) SMARTA cells were plotted at D8, D52+7, and 110+7. Each data point represents an individual mouse harboring both EV- and pMIGR1-OCA-B-transduced cells. To obtain measurements from the spleen, 5, 7, and 10 mice were euthanized according to the approved procedure by the University of Utah Institutional Animal Care and Use Committee (IACUC) at each time point. (K) Mean ratios of pMIGR1-OCA-B-transduced relative to EV-transduced SMARTA cells (OCA-B/EV) are plotted. Splenic SMARTA T cells are shown at day 8 postinfection or 7 d post-rechallenge with Lm-gp61 (52+7 or 110+7).
Fig. 2.
Fig. 2.
Gene expression changes associated with ectopic OCA-B expression in SMARTA transgenic primary effector T cells. (A) Heatmap showing top up- and down-regulated genes. Genes with log2 fold-change >0.5 or <−1.0, and padj ≤ 0.05 are shown. Example genes are shown at Right. Control and OCA-B-transduced cells were purified from the same mice using magnetic isolation and FACS. (B) Example genome tracks showing two up-regulated genes, Socs2 and Gadd45b. Pou2af1(Ocab) is shown as a positive control. (C) Top Epigenomic roadmap and Molecular function GO terms for the set of OCA-B up- and down-regulated genes. (D) Top ChIP-X Enrichment Analysis (ChEA 2016) factors potentially regulating the same set of genes up- and down-regulated by OCA-B ectopic expression.
Fig. 3.
Fig. 3.
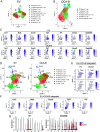
Single-cell RNA-seq analysis of OCA-B-transduced vs. control SMARTA cells at 8 d post-LCMV infection. (A) UMAP projections of independently clustered EV-transduced (GFP+) SMARTA cells purified similar to Figs. 2 and 3 and subjected to scRNA-seq. Cluster identities were annotated using a combination of gene expression enrichment (Dataset S3), cluster identity predictor ImmGen identity scores (Dataset S4), and PanglaoDB annotation terms. Clusters 1 and 4 were associated with memory formation. Top PanglaoDB annotation terms for cluster 4 are shown below. (B) Similar UMAP projection using OCA-B-transduced cells purified from the same mice as in (A). Cluster identities were annotated similarly to (A). Cluster 3 in OCA-B-transduced cells was most strongly associated with memory formation. Top PanglaoDB annotation terms for cluster 3 are shown below. (C) Feature plots highlighting expression of representative genes for the two UMAP projections in (A and B). (D) UMAP projections of the EV- and OCA-B-transduced single-cell RNA-seq datasets clustered together. For each projection, the percentage of each cluster relative to the total number of cells is shown. Cluster identities were annotated using a combination of gene expression enrichment (Dataset S3), cluster identity predictor ImmGen identity scores (Dataset S5) and PanglaoDB annotation terms. (E) Feature plots highlighting expression of two representative genes (Tbx21 and Bcl6) associated with specific clusters. (F) Additional combined feature plots supporting the association of cluster 3 with memory progenitors. (G) Violin plots depicting expression of six genes (Il7r, Zeb2, Gadd45b, Foxo1, Tcf7, and Tox) across each of the 10 clusters in EV-transduced cells (blue, Left) and OCA-B-transduced cells (red, Right).
Fig. 4.
Fig. 4.
mCherry expression in splenic T cell populations in specific pathogen-free homozygous OCA-B-3×mCherry mice. (A) Mouse Pou2af1 locus, targeting vector, and the targeted Pou2af1 locus. (B) CD4 and CD8 expression are shown for an allelic series of example wild-type (+/+) and homozygous (KI/KI) OCA-B knock-in reporter mice. (C) OCA-B homozygous reporter expression in splenic CD4+ T cell populations. (D) The same CD4+ cells as in C were further stratified by CD62L and CD44 into naive, early activated, activated, and TCM populations. CD62LloCD44lo cells are likely recently activated cells that have down-regulated CD62L but not yet up-regulated CD44. (E) Similar analysis as in D except for CD8+ cells.
Fig. 5.
Fig. 5.
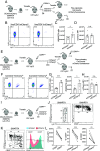
CD4+ T cells expressing high levels of OCA-B reporter activity preferentially form central memory cells. (A) Schematic for assessing contraction of mCherryhi vs. mCherrylo SMARTA T cells following LCMV infection. Congenically marked SMARTA T cells were isolated from donor mice, transferred into naive secondary recipients, and infected with LCMV. At 8 dpi, mCherryhi and mCherrylo populations were isolated by FACS. A total of 8 × 10⁵ SMARTA cells were transferred into naive recipients. After 8 d, splenic CD4+Ly5.1+5.2+ SMARTA cells were evaluated by flow cytometry. (B) Flow cytometric analysis of SMARTA donor T cells engrafted into naive mice to monitor rates of decline. Representative mice engrafted with mCherrylo (Left) or mCherryhi (Right) cells are shown. (C) Quantification of averaged donor T cell numbers from mice engrafted with mCherrylo or mCherryhi cells. N = 7 for the mCherrylo group and N = 5 for the mCherryhi group. (D) Similar analysis to C except quantifying mean mCherry fluorescence intensity. (E) Schematic for assessing recall responses of mCherryhi vs. mCherrylo SMARTA T cells following LCMV infection. Congenically marked SMARTA T cells were isolated from donor mice, transferred into naive secondary recipients, and infected with LCMV. However, mice were allowed to clear LCMV and form memory. After 43 d, mCherryhi and mCherrylo memory T cell populations were isolated by FACS. A total of 1.3 × 10⁴ SMARTA cells were transferred into naive recipients, which were infected with LCMV 1 d later. Seven dpi, splenic CD4+Ly5.1+5.2+ SMARTA cells were evaluated by flow cytometry. (F) Flow cytometric analysis of SMARTA donor T cells 7 d post-rechallenge to monitor recall responses. Representative mice engrafted with mCherrylo (Left) or mCherryhi (Right) cells are shown. (G) Quantification of averaged donor T cell percentages and numbers from mice engrafted with mCherrylo or mCherryhi cells. N = 7 for the mCherrylo group and N = 5 for the mCherryhi group. (H) Similar analysis to G except quantifying mean mCherry fluorescence intensity. (I) Schematic for assessing mCherry levels in SMARTA T at early time points following LCMV infection. A total of 2 × 10⁵ congenically marked (CD45.1+) SMARTA T cells were isolated from donor mice and transferred into naive secondary recipients. One day later, mice were intraperitoneally infected with 2 × 10⁵ PFU LCMV. Splenic T cells were collected at 3 dpi. (J) Gated unfixed splenic CD4+ T cells were assessed for the SMARTA congenic marker Ly5.1 and mCherry (Left), while fixed Ly5.1+ (SMARTA) cells from the same mice were used to assess CD25 and TCF1 (Right). (K) CD25 and mCherry expression were assessed from a representative animal. (Left) distribution of SMARTA cell CD25 and mCherry expression in SMARTA mice. (Right) CD25 levels of gated mCherryhi and mCherrylo SMARTA cells displayed as a concatenated histogram. (L) Quantification of averaged mCherry MFI in CD25hi and CD25lo cells (Left) and frequencies (Center) and numbers (Right) of CD25lo cells in mCherrylo or mCherryhi cells SMARTA T cells. N = 6 independent recipient mice.

References

    1. Sallusto F., Lanzavecchia A., Araki K., Ahmed R., From vaccines to memory and back. Immunity 33, 451–463 (2010). - PMC - PubMed
    1. Gearty S. V., et al. , An autoimmune stem-like CD8 T cell population drives type 1 diabetes. Nature 602, 156–161 (2022). - PMC - PubMed
    1. Schnell A., et al. , Stem-like intestinal Th17 cells give rise to pathogenic effector T cells during autoimmunity. Cell 184, 6281–6298.e23 (2021). - PMC - PubMed
    1. Rosato P. C., et al. , Virus-specific memory T cells populate tumors and can be repurposed for tumor immunotherapy. Nat. Commun. 10, 567 (2019). - PMC - PubMed
    1. Cafri G., et al. , Memory T cells targeting oncogenic mutations detected in peripheral blood of epithelial cancer patients. Nat. Commun. 10, 449 (2019). - PMC - PubMed