. 2024 Apr 23;216(2):132-145.
doi: 10.1093/cei/uxae016.

Altered CD226/TIGIT expressions were associated with NK phenotypes in primary antiphospholipid syndrome and affected by IL-4/JAK pathway

Affiliations

Altered CD226/TIGIT expressions were associated with NK phenotypes in primary antiphospholipid syndrome and affected by IL-4/JAK pathway

Yan Long et al. Clin Exp Immunol. .

Abstract

Natural killer (NK) cells were reported to be involved in the pathogenesis of primary antiphospholipid syndrome (pAPS). Immunosuppressive receptor T-cell immunoreceptor with Ig and ITIM domains (TIGIT) and activating receptor cluster of differentiation 226 (CD226) are specifically expressed on NK cells with competitive functions. This study aims to investigate the expression diversities of CD226/TIGIT on NK subsets and their associations with NK subsets activation phenotypes and potential clinical significance, furthermore, to explore potential cause for CD226/TIGIT expression diversities in pAPS. We comparatively assessed the changes of CD56brightNK, CD56dimNK, and NK-like cells in 70 pAPS patients compared with control groups, including systemic lupus erythematosus, asymptomatic antiphospholipid antibodies carriers (asymp-aPLs carriers), and healthy controls and their expression diversities of CD226/TIGIT by flow cytometry. CD25, CD69, CD107α expression, and interferon gamma (IFN-γ) secretion levels of NK subsets were detected to determine the potential association of CD226/TIGIT expression with NK subsets phenotypes. CD226/TIGIT expression levels were compared among different subgroups divided by aPLs status. Moreover, in vitro cultures were conducted to explore the potential mechanisms of CD226/TIGIT expression imbalance. CD56brightNK and CD3+CD56+NK-like cells were significantly increased while CD56dimNK cells were obviously decreased in pAPS, and CD56brightNK and NK-like cells exhibited significantly higher CD226 but lower TIGIT expressions. CD226+CD56brightNK and TIGIT-CD56brightNK cells show higher CD69 expression and IFN-γ secretion capacity, and CD226+NK-like and TIGIT-NK-like cells showed higher expressions of CD25 and CD69 but lower apoptosis rate than CD226- and TIGIT+CD56brightNK/NK-like cells, respectively. The imbalanced CD226/TIGIT expressions were most significant in aPLs triple-positive group. Imbalanced expressions of CD226/TIGIT on CD56brightNK and NK-like cells were aggravated after interleukin-4 (IL-4) stimulation and recovered after tofacitinib blocking. Our data revealed significant imbalanced CD226/TIGIT expressions on NK subsets in pAPS, which closely associated with NK subsets phenotypes and more complicated autoantibody status. CD226/TIGIT imbalanced may be affected by IL-4/Janus Kinase (JAK) pathway activation.

Keywords: CD226; IL-4; JAK; T-cell immunoreceptor with Ig and ITIM domains; natural killer cell; natural killer-like cell; primary antiphospholipid syndrome.


Conflict of interest statement

None declared.

Figures

Graphical Abstract
Graphical Abstract
Figure 1.
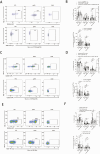
Figure 1.
Peripheral CD56brightNK cells and NK-like cells were significantly increased while CD56dimNK cells were obviously decreased in pAPS patients. Freshly isolated peripheral blood samples of pAPS patients, SLE patients, asymp-aPLs-positive patients (asymptomatic aPLs(+)), and HCs were analyzed by cytometry. CD3− lymphocytes with higher CD56 expression were defined as CD56brightNK cells while CD3− lymphocytes with lower CD56 expression were defined as CD56dimNK cells. NK-like cells were defined as CD3−CD56+ cells. (A) Representative flow cytometry plots showing gating strategies of CD56brightNK cells, CD56dimNK cells, and NK-like cells compared among pAPS patient group (n = 70) and healthy control (n = 25). (B, C) Comparisons of CD56brightNK cells, CD56dimNK cells, and NK-like cells levels among different groups. Data are shown as mean ± SD. All P-values were two-tailed and considered to be significant when less than 0.05. *P < 0.05, **P < 0.01, ***P < 0.001.
Figure 2.
Figure 2.
Elevated CD226 expressions but lower TIGIT expressions were found in CD56brightNK cells and NK-like cells in pAPS patients. CD56brightNK cells, CD56dimNK cells, and NK-like cells were further stained with CD226 and TIGIT to investigate their CD226 and TIGIT expression diversities in pAPS patients (n = 70), SLE patients (n = 20), asymptomatic aPLs(+) (n = 13), and HCs (n = 25). According to CD226 or TIGIT expression, we divided CD56brightNK cells into CD226+/CD226−CD56brightNK cells, TIGIT+/−CD56brightNK cells. (A) Representative flow plots showed the proportion of CD226-positive or (and) TIGIT-positive CD56brightNK in pAPS patient group and HCs. (B) Comparisons of different CD56brightNK subsets classified CD226 or TIGIT expressions as well as CD226/TIGIT expression ratios among pAPS patients (n = 70), SLE patients (n = 20), asymptomatic aPLs(+) (n = 13), and HCs (n = 25). (C) Representative flow plots showed the proportion of CD226-positive or TIGIT-positive CD56dimNK in pAPS patient group and HCs. (D) Comparisons of different CD56dimNK subsets classified CD226 or TIGIT expressions, CD226/TIGIT expression ratios among pAPS patient (n = 70), SLE patients (n = 20), asymptomatic aPLs(+) (n = 13), and HCs (n = 25). (E) Representative flow plots showed the proportion of CD226-positive or TIGIT-positive NK-like cells in pAPS patient group and HCs. (F) Bar charts shown comparisons of CD226+NK-like, TIGIT+NK-like cells, CD226/TIGIT expression ratios among pAPS patients (n = 70), SLE patients (n = 20), asymptomatic aPLs(+) (n = 13), and HCs (n = 25). Data are shown as mean ± SD. All P-values were two-tailed and considered to be significant when less than 0.05. *P < 0.05, **P < 0.01, ***P < 0.001.
Figure 3.
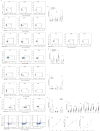
Figure 3.
NK subsets showed activated phenotypes in pAPS patients compared with healthy subjects. PBMCs isolated from pAPS patients (n = 41) and HCs (n = 25) were analyzed by flow cytometry without stimulation. Representative flow plots showing the expression of CD69 (A) and CD25 (C) in pAPS patient group and HCs on peripheral blood NK subsets. (B, D) Bar charts show comparisons of CD69 and CD25 expressions between pAPS patients and HCs. (E) Representative FACS plots showing the production of IFN-γ in peripheral blood NK subsets after stimulation in pAPS (n = 11) patients and HCs (n = 11). (F) The percentages of IFN-γ were shown as mean ± SD and compared between pAPS patients and HCs. (G) The PBMCs isolated from pAPS patients and HCs were stimulated with LPS for 24 hours, and representative FACS plots showing the expression of CD107α on peripheral NK subsets, and comparisons were made between pAPS patients and HCs (H). (I) PBMCs isolated from pAPS patients and HCs were stimulated with LPS, and the percentages of CD69 or CD25 expressions before and after stimulation with LPS in pAPS patients and HCs were evaluated by flow cytometry and compared between pAPS patients and HCs. (J, K) PBMCs isolated from pAPS patients and HCs were stimulated with LPS for 24h 48, and 72 hours, FACS plots showing the apoptosis of NK subsets from a pAPS patients and a healthy subject. The apoptosis of (Annexin v+PI-) NK cells in pAPS patients and HCs were analyzed at different time points. Data are shown as mean ± SD. All P-values were two-tailed and considered to be significant when less than 0.05. *P < 0.05, **P < 0.01.
Figure 4.
Figure 4.
Comparisons of CD226 or TIGIT expression with the function of NK subsets in pAPS patients. PBMCs isolated from pAPS patients were stimulated with LPS for 24 hours. The percentages of LPS-stimulated CD25 or CD69 expressed on CD226− or CD226+, TIGIT− or TIGIT+ NK subsets were measured by flow cytometry, and further compared between different groups. The percentages of LPS-stimulated CD25 (A) or CD69 (B) on CD56brightNK, CD56dimNK, and NK-like cells were compared between pAPS patients and HCs. In addition, the percentages of IFN-γ in NK subsets after stimulation in pAPS patients were compared between CD226− and CD226+, TIGIT− and TIGIT+ NK subsets (C). (D) The percentages of CD107α+NK subsets were evaluated by flow cytometry and compared between different groups classified by CD226 or TIGIT expressions. (E) PBMCs isolated from pAPS patients were stimulated with LPS for 24, 48, and 72 hours, and the apoptosis (Annexin V+PI−) NK subsets were analyzed at different time points and the percentage of Annexin V+PI− CD226+/CD226− and TIGIT+/TIGIT− NK subsets were compared. Data are shown as mean ± SD. All P-values were two-tailed and considered to be significant when less than 0.05. *P < 0.05, **P < 0.01.
Figure 5.
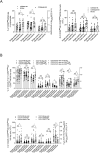
Figure 5.
CD56brightNK cells and NK-like cells with higher CD226 expression were significantly elevated in aPL triple-positive pAPS patients. According to the status of aPL, our study divided pAPS patients into three subgroups, including single-positive group (one of aPL is positive, n = 20), double-positive group (two of aPL are positive, n = 36), and triple-positive group (all of aPL are positive, n = 14), and compared the changes of NK subsets among different groups. (A) We found the proportions of NK-like cells, CD56dimNK cells, and CD56brightNK cells were significantly increased in triple-positive pAPS patients than double-positive and single-positive pAPS patient groups, and the numbers of CD56brightNK cells and NK-like cells were also obviously increased. (B) CD226 expression was significantly increased while TIGIT expression was obviously decreased in CD56brightNK cells of triple-positive pAPS patients. The expression of CD226 was also significantly increased in NK-like cells of triple-positive pAPS patients. Data are shown as mean ± SD. All P-values were two-tailed and considered to be significant when less than 0.05. *P < 0.05, **P < 0.01.
Figure 6.
Figure 6.
CD226 expression was upregulated while TIGIT expression was downregulated by the addition of IL-4 and recovered upon the addition of JAK inhibitor tofacitinib. IL-4 induced higher levels of CD226 expression while lower levels of TIGIT expression, and both recovered by JAK inhibitor in pAPS patients. PBMCs from pAPS patients (n = 15) were cultured with IL-4 in the presence or absence of tofacitinib for 72 hours. (A, C) CD226 expression on CD56brightNK cells and NK-like cells were significantly increased while TIGIT expression was obviously decreased in IL-4-treated patients, and recovered in tofacitinib-treated samples. (B, D) The expression of CD226 and TIGIT, as well we CD226/TIGIT expression ratios, on CD56brightNK cells and NK-like cells was compared between IL-4-treated and untreated group, and between IL-4-treated and tofacitinib-treated group. Data are shown as mean ± SD. All P-values were two-tailed and considered to be significant when less than 0.05. *P < 0.05, **P < 0.01.
Figure 7.
Figure 7.
Hypothetical schematic of this study. Under pathological conditions, the levels of NK subsets increased and accompanied by higher levels of CD226 expression but lower TIGIT expression, manifesting as the imbalanced expression of CD226/TIGIT on NK subsets. On the one hand, this imbalance of CD226/TIGIT enhanced the immune activity of NK subsets, including the upregulated expression of CD25, CD69, and CD107α. On the other hand, the imbalance may be a potential cause for the elevation of CD56brightNK and NK-like cells by reducing their apoptosis rate in pAPS, which forms a positive cycle and further increases the level of functional NK cell subsets. From the above two aspects, elevated NK subsets with enhanced immune activity may play potential roles in the pathogenesis of pAPS. In addition, the activation of IL-4/JAK pathway may be a underlying cause for the imbalance of CD226/TIGIT expression on NK subsets.

Similar articles

Cited by

References

    1. Oliveira DC, Correia A, Oliveira C.. The issue of the antiphospholipid antibody syndrome. J Clin Med Res 2020, 12, 286–92. doi:10.14740/jocmr4154 - DOI - PMC - PubMed
    1. Kuwana M. Autoreactive CD4(+) T cells to beta(2)-glycoprotein I in patients with antiphospholipid syndrome. Autoimmun Rev 2003, 2, 192–8. doi:10.1016/s1568-9972(03)00007-7 - DOI - PubMed
    1. Karakantza M, Theodorou GL, Meimaris N, Mouzaki A, John E, Andonopoulos AP, et al.Type 1 and type 2 cytokine-producing CD4+ and CD8+ T cells in primary antiphospholipid syndrome. Ann Hematol 2004, 83, 704–11. doi:10.1007/s00277-004-0910-7 - DOI - PubMed
    1. Noureldine MHA, Nour-Eldine W, Khamashta MA, Uthman I.. Insights into the diagnosis and pathogenesis of the antiphospholipid syndrome. Semin Arthritis Rheum 2019, 48, 860–6. doi:10.1016/j.semarthrit.2018.08.004 - DOI - PubMed
    1. Chalan P, Bijzet J, Kroesen BJ, Boots AM, Brouwer E.. Altered natural killer cell subsets in seropositive arthralgia and early rheumatoid arthritis are associated with autoantibody status. J Rheumatol 2016, 43, 1008–16. doi:10.3899/jrheum.150644 - DOI - PubMed