. 2024 May 1;14(5):804-827.
doi: 10.1158/2159-8290.CD-23-0656.

Acquired Cross-Resistance in Small Cell Lung Cancer due to Extrachromosomal DNA Amplification of MYC Paralogs

Affiliations

Acquired Cross-Resistance in Small Cell Lung Cancer due to Extrachromosomal DNA Amplification of MYC Paralogs

Shreoshi Pal Choudhuri et al. Cancer Discov. .

Abstract

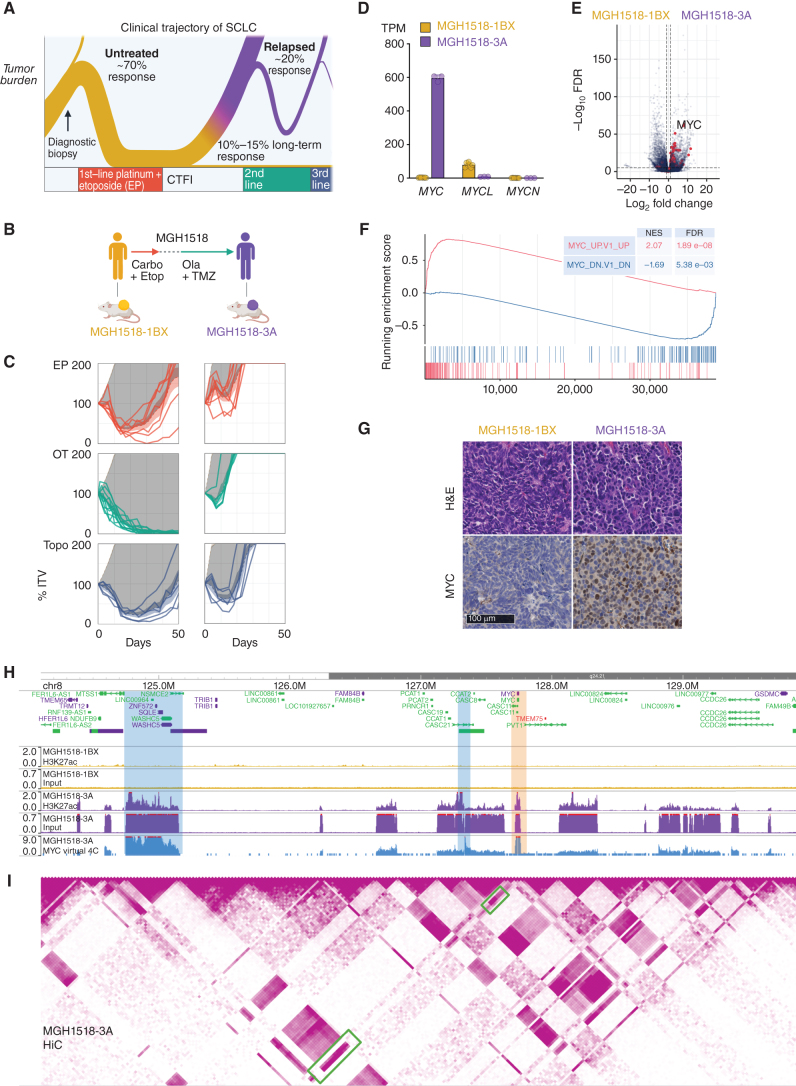
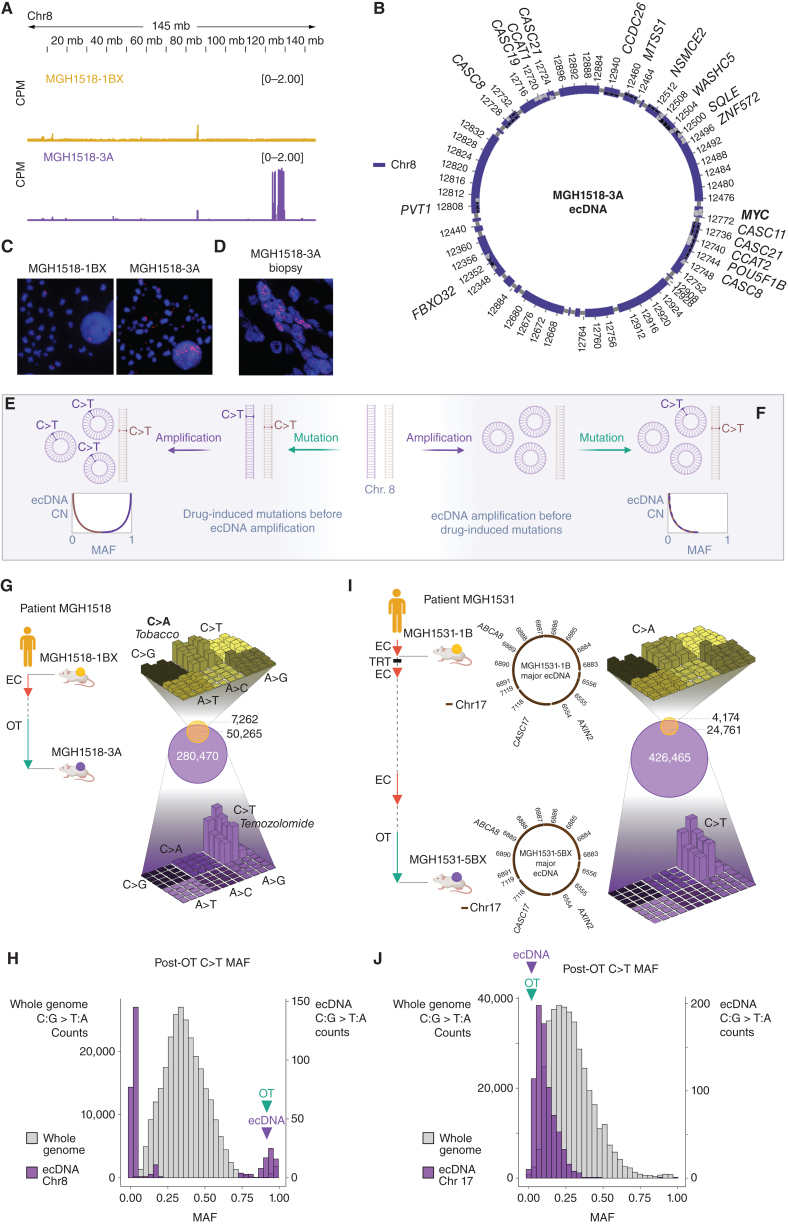
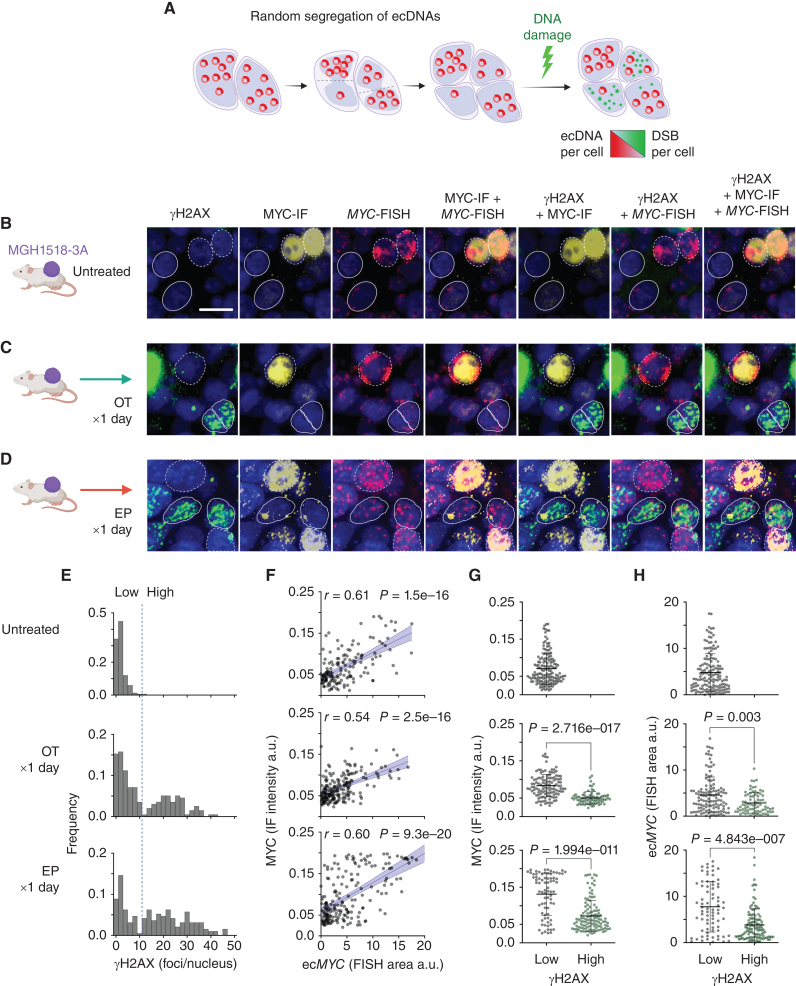
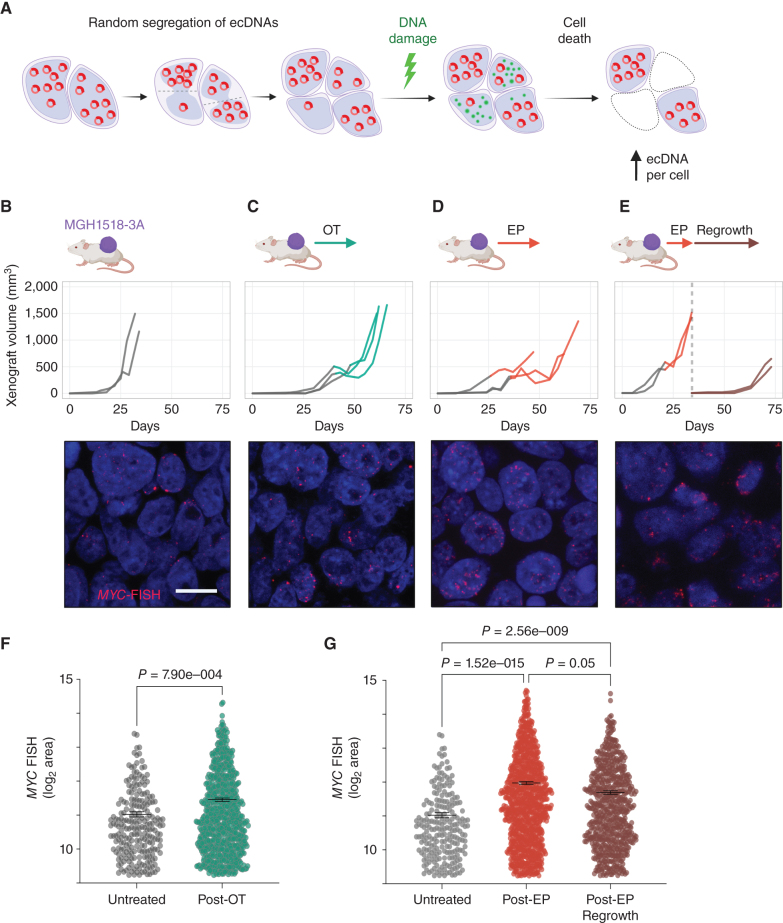
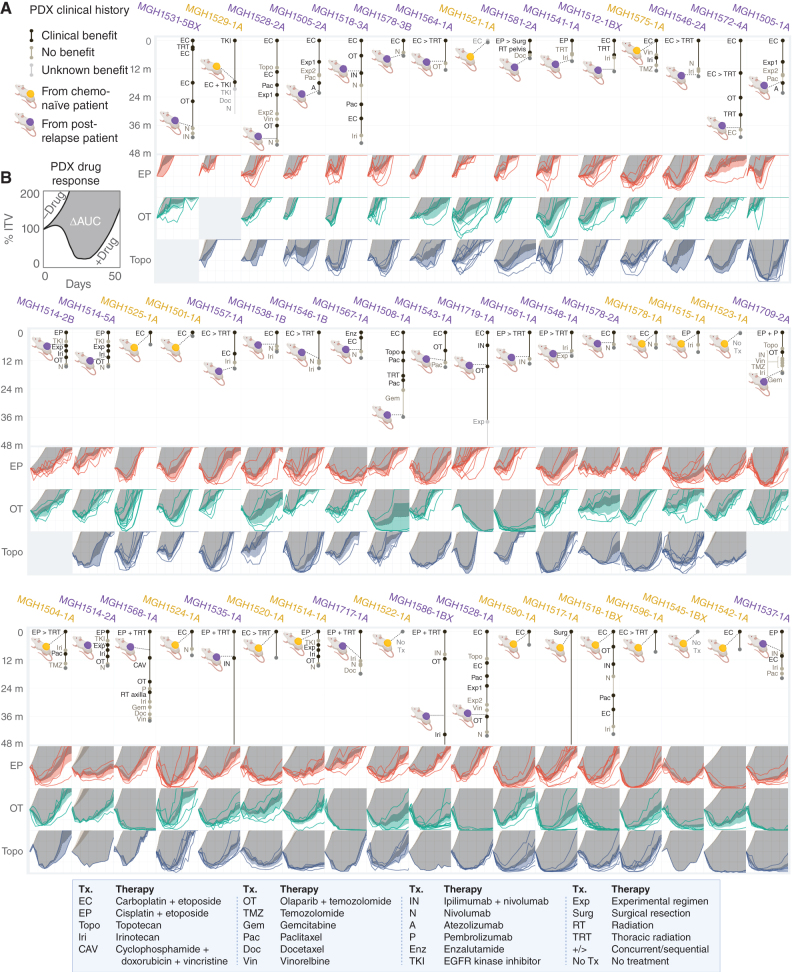
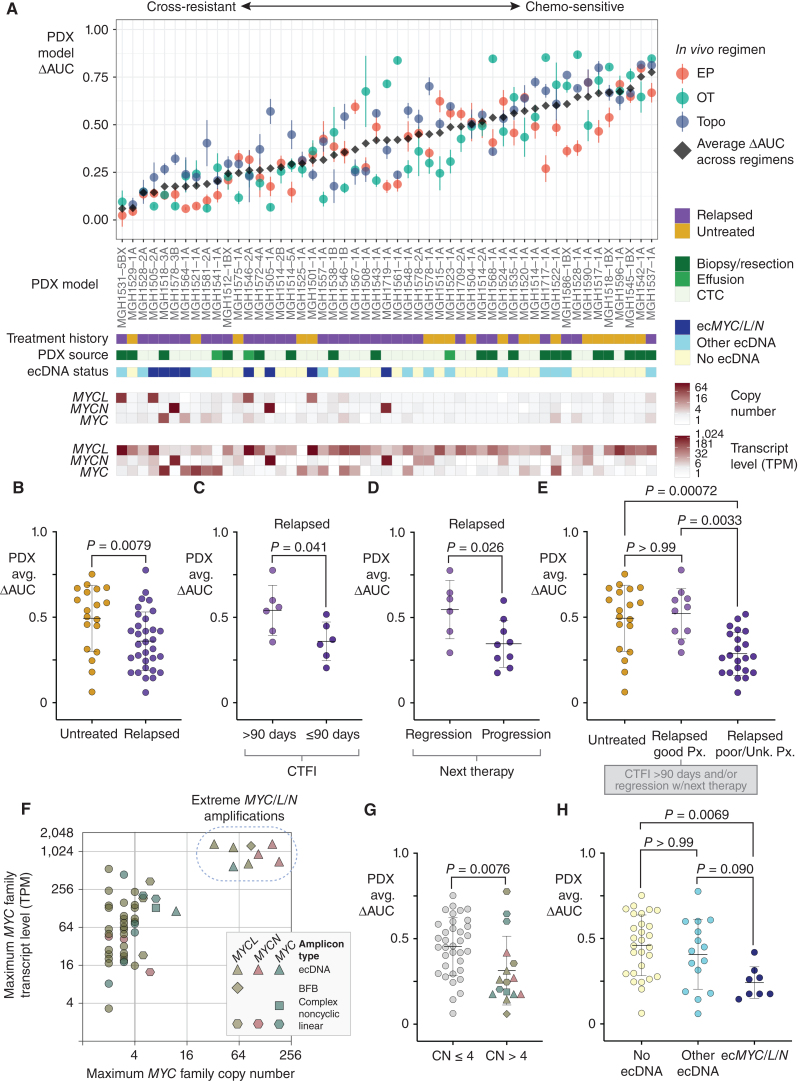
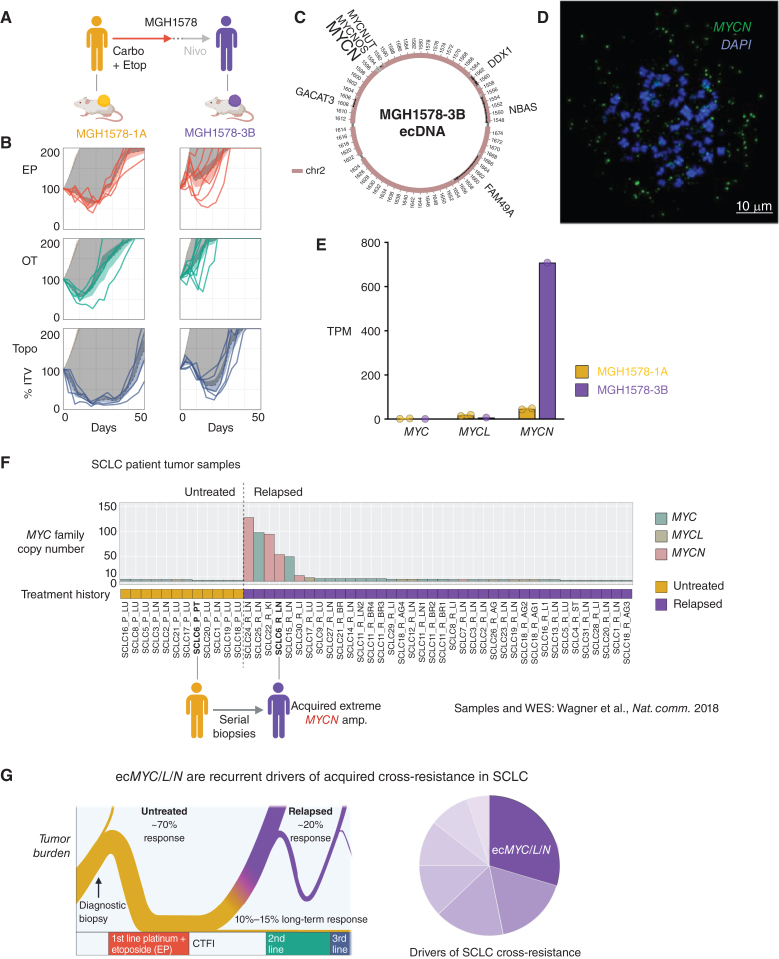
Small cell lung cancer (SCLC) presents as a highly chemosensitive malignancy but acquires cross-resistance after relapse. This transformation is nearly inevitable in patients but has been difficult to capture in laboratory models. Here, we present a preclinical system that recapitulates acquired cross-resistance, developed from 51 patient-derived xenograft (PDX) models. Each model was tested in vivo against three clinical regimens: cisplatin plus etoposide, olaparib plus temozolomide, and topotecan. These drug-response profiles captured hallmark clinical features of SCLC, such as the emergence of treatment-refractory disease after early relapse. For one patient, serial PDX models revealed that cross-resistance was acquired through MYC amplification on extrachromosomal DNA (ecDNA). Genomic and transcriptional profiles of the full PDX panel revealed that MYC paralog amplifications on ecDNAs were recurrent in relapsed cross-resistant SCLC, and this was corroborated in tumor biopsies from relapsed patients. We conclude that ecDNAs with MYC paralogs are recurrent drivers of cross-resistance in SCLC.

Significance: SCLC is initially chemosensitive, but acquired cross-resistance renders this disease refractory to further treatment and ultimately fatal. The genomic drivers of this transformation are unknown. We use a population of PDX models to discover that amplifications of MYC paralogs on ecDNA are recurrent drivers of acquired cross-resistance in SCLC. This article is featured in Selected Articles from This Issue, p. 695.


Figures

Figure 1. Serial PDX models of SCLC demonstrate cross-resistance and high-level MYC expression acquired after two lines of therapy. A, The biphasic clinical trajectory of SCLC, from broad chemosensitivity to acquired cross-resistance. Ribbon thickness depicts the proportion of patients. Purple = relapse. CTFI = chemotherapy-free interval. B, Clinical treatment history of patient MGH1518. Prior to therapy, PDX model MGH1518-1BX was derived from core biopsy. Patient then received 5 cycles of EC, followed by 65 days off therapy and progression at first restaging. Second-line OT resulted in a durable partial response of 6.8 months. PDX model MGH1518-3A was derived after progression on OT. C, PDX responses to EP, OT, and topotecan (Topo), as described in detail in Supplementary Fig. S1A–S1C for MGH1518-1BX treated with EP (top left). Solid color lines = tumor-volume (TV) curves for treated xenografts starting from initial tumor volume (ITV) of 300–600 mm3. Dashed color lines + color shading = average TV curves ± 95% confidence interval (CI). Tan dashed lines + shading = untreated TV curves ± 95% CI from model growth coefficients calculated from 94 MGH1518-1BX xenografts and 60 MGH1518-3A xenografts. Dark gray shading = difference in the area under treated and untreated average TV curves (ΔAUC). D, PDX MYC paralog transcripts per million (TPM). Circles = replicate xenografts. Error bars = mean and SEM. E, PDX differential gene expression. Red = genes upregulated upon overexpression of MYC per the MSigDB gene set “MYC_UP.V1_UP,” which is derived from ectopic MYC expression in primary breast epithelial cells (36). F, Gene set enrichment plot in MGH1518-3A vs. MGH1518-1BX for genes upregulated and downregulated with MYC overexpression. G, PDX morphology by hematoxylin and eosin stain, and MYC expression by IHC. H–I, PDX Histone H3K27ac ChIP-seq, Hi-C, and virtual 4C viewed in a 6 MB region on chromosome 8q24 containing the MYC locus. H, Normalized input and H3K27ac signals between models. Peak heights = counts per million mapped reads (CPM). Orange shaded region = MYC locus. I, MGH1518-3A Hi-C contact map and degree of interaction with the MYC locus by virtual 4C. Hi-C map color intensity = frequency of interaction between 2 loci. Virtual 4C peak height = relative interaction frequency with the MYC locus. Green boxes and blue-shaded regions = loci with strong interactions with the MYC locus, high H3K27ac peak, and chromatin input indicative of focal amplification. Created with BioRender.com.
Figure 1.
Serial PDX models of SCLC demonstrate cross-resistance and high-level MYC expression acquired after two lines of therapy. A, The biphasic clinical trajectory of SCLC, from broad chemosensitivity to acquired cross-resistance. Ribbon thickness depicts the proportion of patients. Purple = relapse. CTFI = chemotherapy-free interval. B, Clinical treatment history of patient MGH1518. Prior to therapy, PDX model MGH1518-1BX was derived from core biopsy. Patient then received 5 cycles of EC, followed by 65 days off therapy and progression at first restaging. Second-line OT resulted in a durable partial response of 6.8 months. PDX model MGH1518-3A was derived after progression on OT. C, PDX responses to EP, OT, and topotecan (Topo), as described in detail in Supplementary Fig. S1A–S1C for MGH1518-1BX treated with EP (top left). Solid color lines = tumor-volume (TV) curves for treated xenografts starting from initial tumor volume (ITV) of 300–600 mm3. Dashed color lines + color shading = average TV curves ± 95% confidence interval (CI). Tan dashed lines + shading = untreated TV curves ± 95% CI from model growth coefficients calculated from 94 MGH1518-1BX xenografts and 60 MGH1518-3A xenografts. Dark gray shading = difference in the area under treated and untreated average TV curves (ΔAUC). D, PDX MYC paralog transcripts per million (TPM). Circles = replicate xenografts. Error bars = mean and SEM. E, PDX differential gene expression. Red = genes upregulated upon overexpression of MYC per the MSigDB gene set “MYC_UP.V1_UP,” which is derived from ectopic MYC expression in primary breast epithelial cells (36). F, Gene set enrichment plot in MGH1518-3A vs. MGH1518-1BX for genes upregulated and downregulated with MYC overexpression. G, PDX morphology by hematoxylin and eosin stain, and MYC expression by IHC. H and I, PDX Histone H3K27ac ChIP-seq, Hi-C, and virtual 4C viewed in a 6 MB region on chromosome 8q24 containing the MYC locus. H, Normalized input and H3K27ac signals between models. Peak heights = counts per million mapped reads (CPM). Orange shaded region = MYC locus. I, MGH1518-3A Hi-C contact map and degree of interaction with the MYC locus by virtual 4C. Hi-C map color intensity = frequency of interaction between 2 loci. Virtual 4C peak height = relative interaction frequency with the MYC locus. Green boxes and blue-shaded regions = loci with strong interactions with the MYC locus, high H3K27ac peak, and chromatin input indicative of focal amplification. Created with BioRender.com.
Figure 2. Serial PDX models demonstrate MYC amplification on ecDNA acquired after the start of second-line therapy. A, Copy-number variation on chromosome 8 demonstrated focal amplification of discontinuous segments including MYC in MGH1518-3A but not MGH1518-1BX. Peak heights = counts per million mapped reads (CPM). B, AmpliconArchitect (AA) reconstruction of circular ecDNA containing MYC. C, FISH using probes for MYC in metaphase cells from MGH1518-1BX (left) and MGH1518-3A (right) xenografts following dissociation. MYC foci apart from DAPI-stained chromosomes confirm the presence of ecDNAs in MGH1518-3A but not MGH1518-1BX. D, FISH of probes for MYC in the patient tumor biopsy sample that gave rise to MGH1518-3A. E–F, Model depicting ecDNA amplification either before or after TMZ-induced C>T mutations. E, If TMZ causes a C>T mutation that is amplified on an ecDNA, then the mutant allele fraction (MAF) will increase with ecDNA copy number (CN). Conversely, if TMZ causes a C>T mutation on the unamplified allele, then its MAF will decrease after amplification. F, If ecDNA amplification precedes TMZ, then the C>T MAFs will be inversely proportional to ecDNA CN, regardless of location. G–H, MGH1518 serial model mutation analysis. G, Left: Clinical history of MGH1518 serial models as in Fig. 1B. Right center: Venn diagram compares the shared and unique mutations in serial models to reveal >280,000 new mutations in MGH1518-3A. Right top and bottom: three-dimensional bar plots (also called “Lego plots”) representing mutational signatures in a three-base context for each model (three-base key in Supplementary Fig. S2C). Note that tobacco smoking-induced C>A transversions in MGH1518-1BX (top, yellow) have been overshadowed by TMZ-induced C>T transition mutations in MGH1518-3A (bottom, purple). H, Distribution of C>T MAFs across the whole MGH1518-3A genome (gray, left y-axis) and on ecMYC (purple, right y-axis), in 30 bins ranging from 0 to 1. Bimodal distribution is consistent with ecDNA amplification after the start of TMZ as depicted in E. I–J, MGH1531 serial model mutation analysis. I, Left: Patient MGH1531 received two cycles of EC at a reduced dose with disease stabilization, and PDX MGH1531-1B was derived from a pleural effusion specimen. Patient then responded well to thoracic radiation, further EC, rechallenge with EC, and then OT. After 7.2 months on OT, a brain metastasis was resected and gave rise to MGH1531-5BX. Right: mutation overlap and signatures as in G for MGH1518 models. Center: AA reconstruction of circular ecDNA as in B reveals the same ecDNA in both MGH1531-1B and MGH1531-5BX. I, Distribution of C>T MAFs in MGH1531-5BX, as in H for MGH1518-3A. Absence of a high-MAF peak is consistent with ecDNA amplification before the start of TMZ as depicted in F. Created with BioRender.com.
Figure 2.
Serial PDX models demonstrate MYC amplification on ecDNA acquired after the start of second-line therapy. A, Copy-number variation on chromosome 8 demonstrated focal amplification of discontinuous segments including MYC in MGH1518-3A but not MGH1518-1BX. Peak heights = counts per million mapped reads (CPM). B, AmpliconArchitect (AA) reconstruction of circular ecDNA containing MYC. C, FISH using probes for MYC in metaphase cells from MGH1518-1BX (left) and MGH1518-3A (right) xenografts following dissociation. MYC foci apart from DAPI-stained chromosomes confirm the presence of ecDNAs in MGH1518-3A but not MGH1518-1BX. D, FISH of probes for MYC in the patient tumor biopsy sample that gave rise to MGH1518-3A. E and F, Model depicting ecDNA amplification either before or after TMZ-induced C>T mutations. E, If TMZ causes a C>T mutation that is amplified on an ecDNA, then the mutant allele fraction (MAF) will increase with ecDNA copy number (CN). Conversely, if TMZ causes a C>T mutation on the unamplified allele, then its MAF will decrease after amplification. F, If ecDNA amplification precedes TMZ, then the C>T MAFs will be inversely proportional to ecDNA CN, regardless of location. G and H, MGH1518 serial model mutation analysis. G, Left: Clinical history of MGH1518 serial models as in Fig. 1B. Right center: Venn diagram compares the shared and unique mutations in serial models to reveal >280,000 new mutations in MGH1518-3A. Right top and bottom: three-dimensional bar plots (also called “Lego plots”) representing mutational signatures in a three-base context for each model (three-base key in Supplementary Fig. S4A). Note that tobacco smoking-induced C>A transversions in MGH1518-1BX (top, yellow) have been overshadowed by TMZ-induced C>T transition mutations in MGH1518-3A (bottom, purple). H, Distribution of C>T MAFs across the whole MGH1518-3A genome (gray, left y-axis) and on ecMYC (purple, right y-axis), in 30 bins ranging from 0 to 1. Bimodal distribution is consistent with ecDNA amplification after the start of TMZ as depicted in E. I and J, MGH1531 serial model mutation analysis. I, Left: Patient MGH1531 received two cycles of EC at a reduced dose with disease stabilization, and PDX MGH1531-1B was derived from a pleural effusion specimen. Patient then responded well to thoracic radiation, further EC, rechallenge with EC, and then OT. After 7.2 months on OT, a brain metastasis was resected and gave rise to MGH1531-5BX. Right: mutation overlap and signatures as in G for MGH1518 models. Center: AA reconstruction of circular ecDNA as in B reveals the same ecDNA in both MGH1531-1B and MGH1531-5BX. J, Distribution of C>T MAFs in MGH1531-5BX, as in H for MGH1518-3A. Absence of a high-MAF peak is consistent with ecDNA amplification before the start of TMZ as depicted in F. Created with BioRender.com.
Figure 3. ecMYC protects cells from DNA damage induced by chemotherapy. A, Schema to determine whether ecMYC protects cancer cells from DNA damage. Daughter cells inherit variable numbers of ecDNAs due to random segregation during mitosis. This generates natural copy-number heterogeneity that can be exploited experimentally to measure the effects of ecDNA dosage on therapy-induced DNA damage in individual tumor cells. B–D, MGH1518-3A xenografts (mean 58 copies ecMYC per cell) received either no treatment, a single day of OT, or a single day of EP and then were resected and fixed in formalin. Each xenograft tissue section was imaged by immunofluorescence for MYC protein and γH2AX, and by MYC-FISH for ecMYC content, with DAPI nuclear stain. γH2AX foci denote sites of DNA damage signaling, whereas homogenous γH2AX nuclear signals denote apoptotic nuclei. Dashed borders mark ecMYC high cells, and solid borders mark ecMYC low cells. Scale bar = 10 μm. E, Distributions of γH2AX foci/nucleus. Treatment resulted in bimodal distributions with a clear threshold between damaged and undamaged cells (dashed line). F, Normalized MYC immunofluorescence vs. MYC-FISH area per nucleus. r = Pearson correlation coefficient, p = significance of correlation. G–H, MYC immunofluorescence (G) or MYC-FISH area (H) in nuclei with high or low γH2AX foci (with or without DNA damage), as measured by γH2AX foci/nucleus threshold in E. Created with BioRender.com.
Figure 3.
ecMYC protects cells from DNA damage induced by chemotherapy. A, Schema to determine whether ecMYC protects cancer cells from DNA damage. Daughter cells inherit variable numbers of ecDNAs due to random segregation during mitosis. This generates natural copy-number heterogeneity that can be exploited experimentally to measure the effects of ecDNA dosage on therapy-induced DNA damage in individual tumor cells. B–D, MGH1518-3A xenografts (mean 58 copies ecMYC per cell) received either no treatment, a single day of OT, or a single day of EP and then were resected and fixed in formalin. Each xenograft tissue section was imaged by immunofluorescence for MYC protein and γH2AX, and by MYC-FISH for ecMYC content, with DAPI nuclear stain. γH2AX foci denote sites of DNA damage signaling, whereas homogenous γH2AX nuclear signals denote apoptotic nuclei. Dashed borders mark ecMYChigh cells, and solid borders mark ecMYClow cells. Scale bar = 10 μm. E, Distributions of γH2AX foci/nucleus. Treatment resulted in bimodal distributions with a clear threshold between damaged and undamaged cells (dashed line). F, Normalized MYC immunofluorescence vs. MYC-FISH area per nucleus. r = Pearson correlation coefficient, p = significance of correlation. G and H, MYC immunofluorescence (G) or MYC-FISH area (H) in nuclei with high or low γH2AX foci (with or without DNA damage), as measured by γH2AX foci/nucleus threshold in E. Created with BioRender.com.
Figure 4. Selection of tumor cells with the highest ecMYC after chemotherapy. A, Following xenograft progression on chemotherapy, the distributions of ecMYC copy numbers in treated tumors are compared with untreated tumors to determine whether ecMYC promotes DNA damage survival. B–E, MGH1518-3A xenografts tumor volume curves from implantation to resection (top) and representative MYC-FISH images (bottom). For growth curves, the transition from gray to color at the start of therapy. Xenografts were either untreated (B) or treated with full regimens of OT (C) or EP (D). E, Xenografts were treated with slightly reduced doses of EP from the standard regimen (5 mpk cisplatin day 1 + 8 mpk etoposide days 1–3 of 7 days × 2 cycles), then allowed to grow to 1,200–1,600 mm3, resected and cryopreserved. Posttreatment samples were then implanted and grown off therapy to at least 500 mm3. F–G, Measurement of MYC-FISH area per cell in untreated and treated xenografts. Comparison of distributions, and nonparametric test P values. Created with BioRender.com.
Figure 4.
Selection of tumor cells with the highest ecMYC after chemotherapy. A, Following xenograft progression on chemotherapy, the distributions of ecMYC copy numbers in treated tumors are compared with untreated tumors to determine whether ecMYC promotes DNA damage survival. B–E, MGH1518-3A xenografts tumor volume curves from implantation to resection (top) and representative MYC-FISH images (bottom). For growth curves, the transition from gray to color at the start of therapy. Xenografts were either untreated (B) or treated with full regimens of OT (C) or EP (D). E, Xenografts were treated with slightly reduced doses of EP from the standard regimen (5 mg/kg cisplatin day 1 + 8 mg/kg etoposide days 1–3 of 7 days × 2 cycles), then allowed to grow to 1,200–1,600 mm3, resected and cryopreserved. Posttreatment samples were then implanted and grown off therapy to at least 500 mm3. F and G, Measurement of MYC-FISH area per cell in untreated and treated xenografts. Comparison of distributions, and nonparametric test P values. Created with BioRender.com.
Figure 5. Clinical and functional annotation of PDX panel to measure acquired cross-resistance in SCLC. A, Patient treatment histories before and after model derivation, for 48 months following the start of first-line therapy. Xenograft color denotes models derived before (yellow) or after (purple) first-line chemotherapy. Segment length = therapy duration. Segment shade = early progression (tan) vs. disease stabilization or regression (black) vs. unknown benefit (gray). Therapy abbreviation key below. B, PDX responses in vivo to EP, OT, and topotecan. TV curves for individual treated xenografts, average TV curves for models with or without treatment ± 95% CI, and ΔAUC as depicted for MGH1518 models in Fig. 1C; Supplementary Fig. S1A–S1C. PDX models are arranged by increasing chemosensitivity (ΔAUCavg, Fig. 6A) from top left to bottom right. Created with BioRender.com.
Figure 5.
Clinical and functional annotation of PDX panel to measure acquired cross-resistance in SCLC. A, Patient treatment histories before and after model derivation, for 48 months following the start of first-line therapy. Xenograft color denotes models derived before (yellow) or after (purple) first-line chemotherapy. Segment length = therapy duration. Segment shade = early progression (tan) vs. disease stabilization or regression (black) vs. unknown benefit (gray). Therapy abbreviation key below. B, PDX responses in vivo to EP, OT, and topotecan. TV curves for individual treated xenografts, average TV curves for models with or without treatment ± 95% CI, and ΔAUC as depicted for MGH1518 models in Fig. 1C; Supplementary Fig. S1A–S1C. PDX models are arranged by increasing chemosensitivity (ΔAUCavg, Fig. 6A) from top left to bottom right. Created with BioRender.com.
Figure 6. ecDNA amplifications of MYC paralogs are recurrent in cross-resistant PDX models derived from patients with relapsed SCLC. A, Integrated clinical–functional–molecular landscape of MYC paralogs across the SCLC PDX panel. Top scatter plot: In vivo cross-resistance metrics. Models are arranged left-to-right by increasing the average of ΔAUC for EP, OT, and topotecan (ΔAUCavg). Error bars = SEM of ΔAUC for each regimen. Bars below (9 total): (1) Annotated clinical treatment history (chemo-naïve vs. post-relapse), (2) PDX source (CTC vs. biopsy vs. effusion), (3) ecDNA status (ecMYC/L/N vs. other ecDNA vs. no ecDNA), (4–6) MYC paralog copy numbers, and (7–9) MYC paralog transcript levels. B–E, Performance of PDX ΔAUCavg as a metric of clinical cross-resistance by comparison with patient clinical histories. B, Comparison of ΔAUCavg of PDX models derived from patients with untreated vs. relapsed SCLC. C, Comparison of ΔAUCavg of PDX models derived from patients after first-line therapy with CTFI > 90 days (platinum-sensitive) vs. ≤ 90 days (platinum-resistant). D, Comparison of ΔAUCavg of PDX models derived from patients with relapsed SCLC who responded to the next line of chemotherapy after model derivation vs. those who received chemotherapy but did not have significant tumor regression. E, Refinement of Fig. 6B to compare PDX ΔAUCavg between models derived from untreated patients, relapsed patients with positive prognostic features described in C and D (platinum sensitivity and response to next therapy), or relapsed patients with unknown or negative prognostic features. F, Comparison of transcript level vs. copy number for the MYC paralog with the highest expression level in each model. Amplicon type is annotated. Solid vertical line at CN = 4, beyond which we classify MYC paralogs as amplified. Models with > 30-copy amplifications form a clear separate cluster (“extreme amplifications,” dashed circle). G, Comparison of ΔAUCavg between models with or without MYC paralog amplifications (CN > 4), with annotation of gene and amplification structure. H, Comparison of ΔAUCavg between models without ecDNAs and models with ecDNAs with or without MYC paralogs. Statistical tests: Mann–Whitney test P values for B–D and G, and Kruskal–Wallis test P values for E and H. Created with BioRender.com.
Figure 6.
ecDNA amplifications of MYC paralogs are recurrent in cross-resistant PDX models derived from patients with relapsed SCLC. A, Integrated clinical–functional–molecular landscape of MYC paralogs across the SCLC PDX panel. Top scatter plot: In vivo cross-resistance metrics. Models are arranged left-to-right by increasing the average of ΔAUC for EP, OT, and topotecan (ΔAUCavg). Error bars = SEM of ΔAUC for each regimen. Bars below (9 total): (1) Annotated clinical treatment history (chemo-naïve vs. post-relapse), (2) PDX source (CTC vs. biopsy vs. effusion), (3) ecDNA status (ecMYC/L/N vs. other ecDNA vs. no ecDNA), (4–6) MYC paralog copy numbers, and (7–9) MYC paralog transcript levels. B–E, Performance of PDX ΔAUCavg as a metric of clinical cross-resistance by comparison with patient clinical histories. B, Comparison of ΔAUCavg of PDX models derived from patients with untreated vs. relapsed SCLC. C, Comparison of ΔAUCavg of PDX models derived from patients after first-line therapy with CTFI > 90 days (platinum-sensitive) vs. ≤ 90 days (platinum-resistant). D, Comparison of ΔAUCavg of PDX models derived from patients with relapsed SCLC who responded to the next line of chemotherapy after model derivation vs. those who received chemotherapy but did not have significant tumor regression. E, Refinement of Fig. 6B to compare PDX ΔAUCavg between models derived from untreated patients, relapsed patients with positive prognostic features described in C and D (platinum sensitivity and response to next therapy), or relapsed patients with unknown or negative prognostic features. F, Comparison of transcript level vs. copy number for the MYC paralog with the highest expression level in each model. Amplicon type is annotated. Solid vertical line at CN = 4, beyond which we classify MYC paralogs as amplified. Models with > 30-copy amplifications form a clear separate cluster (“extreme amplifications,” dashed circle). G, Comparison of ΔAUCavg between models with or without MYC paralog amplifications (CN > 4), with annotation of gene and amplification structure. H, Comparison of ΔAUCavg between models without ecDNAs and models with ecDNAs with or without MYC paralogs. Statistical tests: Mann–Whitney test P values for BD and G, and Kruskal–Wallis test P values for E and H. Created with BioRender.com.
Figure 7. ecDNA amplifications of MYC paralogs are recurrent in tumor samples from patients with relapsed SCLC. A–E, Serial PDX models derived from the second patient, MGH1578, in which ecDNA amplification of an MYC paralog was detected only following relapse and acquired cross-resistance. A, Clinical treatment history of patient MGH1578. Prior to therapy, PDX model MGH1578-1A was derived from CTCs. The patient then received five cycles of EC reduced for cytopenias, followed by 14 days off therapy before progression. Second-line nivolumab was ineffective, and then MGH1578-3B was derived from CTCs. B, MGH1578 serial PDX responses to EP, OT, and Topo as in Fig. 1C, demonstrating acquired cross-resistance. C, AA reconstruction of ecMYCN detected in MGH1578-3B but not MGH1578-1A. D, Confirmation of ecMYCN in MGH1578-3B with MYCN-FISH in metaphase cells, as in Fig. 2B and C for ecMYC, and Supplementary Fig. S9E for ecMYCL. E, MGH1578 PDX MYC paralog transcripts per million (TPM). Circles = replicate xenografts. Error bars = mean and SEM, as in Fig. 1D. F, Maximum copy number of MYC, MYCL, or MYCN in SCLC patient tumor samples, with whole-exome sequencing and annotated treatment histories (untreated vs. relapsed) as reported in Wagner et al. (62). Post-relapse samples were reported for 30 patients, with multiple relapsed biopsies from 2 patients (SCLC11 and SCLC18). For 12 of 30 patients, paired pretreatment biopsies were also reported. Reanalysis of MYC paralog copy number by unsegmented exon counts as described in text and Methods. G, The biphasic clinical trajectory of SCLC, progressing from broad chemosensitivity to acquired cross-resistance, as presented in Fig. 1A, with our proposal that ecMYC/N/L amplifications are recurrent drivers of cross-resistance after relapse. Created with BioRender.com.
Figure 7.
ecDNA amplifications of MYC paralogs are recurrent in tumor samples from patients with relapsed SCLC. A–E, Serial PDX models derived from the second patient, MGH1578, in which ecDNA amplification of an MYC paralog was detected only following relapse and acquired cross-resistance. A, Clinical treatment history of patient MGH1578. Prior to therapy, PDX model MGH1578-1A was derived from CTCs. The patient then received five cycles of EC reduced for cytopenias, followed by 14 days off therapy before progression. Second-line nivolumab was ineffective, and then MGH1578-3B was derived from CTCs. B, MGH1578 serial PDX responses to EP, OT, and Topo as in Fig. 1C, demonstrating acquired cross-resistance. C, AA reconstruction of ecMYCN detected in MGH1578-3B but not MGH1578-1A. D, Confirmation of ecMYCN in MGH1578-3B with MYCN-FISH in metaphase cells, as in Fig. 2C for ecMYC, and Supplementary Fig. S9E for ecMYCL. E, MGH1578 PDX MYC paralog transcripts per million (TPM). Circles = replicate xenografts. Error bars = mean and SEM, as in Fig. 1D. F, Maximum copy number of MYC, MYCL, or MYCN in SCLC patient tumor samples, with whole-exome sequencing and annotated treatment histories (untreated vs. relapsed) as reported in Wagner et al. (62). Post-relapse samples were reported for 30 patients, with multiple relapsed biopsies from 2 patients (SCLC11 and SCLC18). For 12 of 30 patients, paired pretreatment biopsies were also reported. Reanalysis of MYC paralog copy number by unsegmented exon counts as described in text and Methods. G, The biphasic clinical trajectory of SCLC, progressing from broad chemosensitivity to acquired cross-resistance, as presented in Fig. 1A, with our proposal that ecMYC/N/L amplifications are recurrent drivers of cross-resistance after relapse. Created with BioRender.com.

Update of

References

    1. Siegel RL, Miller KD, Wagle NS, Jemal A. Cancer statistics, 2023. CA Cancer J Clin 2023;73:17–48. - PubMed
    1. Bray F, Colombet M, Mery L, Piñeros M, Znaor A, Zanetti R. Cancer incidence in five continents. Volume XI. IARC Scientific Publication No. 166; 2021.
    1. Sung H, Ferlay J, Siegel RL, Laversanne M, Soerjomataram I, Jemal A, et al. . Global cancer statistics 2020: GLOBOCAN estimates of incidence and mortality worldwide for 36 cancers in 185 countries. CA Cancer J Clin 2021;71:209–49. - PubMed
    1. Wang S, Tang J, Sun T, Zheng X, Li J, Sun H, et al. . Survival changes in patients with small cell lung cancer and disparities between different sexes, socioeconomic statuses and ages. Sci Rep 2017;7:1339. - PMC - PubMed
    1. Howlader N, Forjaz G, Mooradian MJ, Meza R, Kong CY, Cronin KA, et al. . The effect of advances in lung-cancer treatment on population mortality. N Engl J Med 2020;383:640–9. - PMC - PubMed

Publication types

MeSH terms

Substances