. 2024 May 1;73(5):806-818.
doi: 10.2337/db23-0568.

Cell-Surface ZnT8 Antibody Prevents and Reverses Autoimmune Diabetes in Mice

Affiliations

Cell-Surface ZnT8 Antibody Prevents and Reverses Autoimmune Diabetes in Mice

Devi Kasinathan et al. Diabetes. .

Abstract

Type 1 diabetes (T1D) is an autoimmune disease in which pathogenic lymphocytes target autoantigens expressed in pancreatic islets, leading to the destruction of insulin-producing β-cells. Zinc transporter 8 (ZnT8) is a major autoantigen abundantly present on the β-cell surface. This unique molecular target offers the potential to shield β-cells against autoimmune attacks in T1D. Our previous work showed that a monoclonal antibody (mAb43) against cell-surface ZnT8 could home in on pancreatic islets and prevent autoantibodies from recognizing β-cells. This study demonstrates that mAb43 binds to exocytotic sites on the β-cell surface, masking the antigenic exposure of ZnT8 and insulin after glucose-stimulated insulin secretion. In vivo administration of mAb43 to NOD mice selectively increased the proportion of regulatory T cells in the islet, resulting in complete and sustained protection against T1D onset as well as reversal of new-onset diabetes. The mAb43-induced self-tolerance was reversible after treatment cessation, and no adverse effects were exhibited during long-term monitoring. Our findings suggest that mAb43 masking of the antigenic exposure of β-cells suppresses the immunological cascade from B-cell antigen presentation to T cell-mediated β-cell destruction, providing a novel islet-targeted and antigen-specific immunotherapy to prevent and reverse clinical T1D.


Conflict of interest statement

Duality of Interest. No potential conflicts of interest relevant to this article were reported.

Figures

Figure 1
Figure 1
Cell-surface mAb43 binding reduces antigenic exposure of membrane-bound insulin. A: Immunolabeling of ZnT8 on live human islet cells with mAb43 (yellow). B: Coimmunolabeling of insulin (green) on the cell surface of live EndoC-β1H cells with mAb43 (red), anti-CD71 (red), or mAb20 (red) as indicated. Z-stack images spanning a 3.5-μm slab at 0.5-μm intervals are shown as maximum-intensity projection, with matched fluorescence intensities between the green and red channels. Manders’ colocalization coefficients (M1 and M2) quantify the overlap between green/red and red/green signals, respectively. C: EndoC-β1H cells stimulated with glucose in the presence of mAb43 or mAb20 as indicated and then coimmunolabeled on ice for insulin (green) and CD71 (yellow). Z-stack images are displayed without intensity matching to reveal the actual insulin fluorescence intensity compared with that of CD71. D: Normalized cell-surface insulin fluorescence intensities in individual EndoC-β1H cells, with error bars representing SE. E: mScarlet (a red fluorescent protein) uptake in live human islets exposed to mScarlet-mAb43 or mScarlet-mAb20 as indicated. Maximum-intensity projections of Z-stack images of islets are shown. F: mScarlet-mAb43 uptake in individual islet cells coimmunolabeled for mAb43 (red), insulin (green), and glucagon (yellow) as indicated. Arrowheads and arrows indicate α- and β-cells, respectively. ***P < 0.01 by two-tailed Welch t test for two independent means.
Figure 2
Figure 2
mAb43 prevents diabetes onset. A: FBG levels over time from individual mice treated with mAb43 from 10 to 35 weeks. Numbers of mice after removal for terminal analyses are indicated at different time points. Dashed gray line represents the 250-mg/dL FBG threshold for diagnosis of diabetes. B: FBG levels in the control group receiving weekly isotype (red) or PBS (magenta) injections as indicated, within the same treatment window as in A. Number of mice remaining at each time point is shown. C: Percentages of nondiabetic mice in the treatment (blue) or combined control (red) group from 10 to 35 weeks of age as indicated. D: FBG levels over time during the mAb43 treatment window from 14 to 40 weeks. Number of mice is indicated. E: FBG levels in the control group receiving weekly isotype (red) or PBS (magenta) injections as indicated within the same time window as in D. F: Percentages of nondiabetic mice in the treatment (blue) or combined control (red) group from 14 to 40 weeks of age as indicated. ***P < 0.01 by Kaplan-Meier survival analysis with log-rank test.
Figure 3
Figure 3
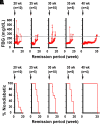
Loss of protection after treatment cessation. A: FBG levels over time in mAb43-treated mice after discontinuing weekly mAb43 injections at 20, 25, 30, 35, or 40 weeks of age as indicated by arrows. Glucose monitoring was continued until the onset of diabetes. Number of mice in each group is shown. B: Percentages of nondiabetic mice over time after discontinuing weekly mAb43 injections as described in A.
Figure 4
Figure 4
Continuous mAb43 dosing preserves β-cell mass and reduces insulitis. A: Representative images of pancreatic islets revealed by anti-insulin immunohistochemistry. Shown are 20-week-old diabetic (D) or nondiabetic (ND) mice from the control group or ND mice from the mAb43 treatment group. The right panel displays changes in islet mass for mice in different treatment groups, ages, and D statuses as indicated. Boxes represent the statistically central range of data from the boundaries of upper 25% to lower 25% quartiles. Red and black lines indicate the median and average values of the data, respectively. Number of mice in each group and their significance levels compared with 20-week-old D mice in the control group are indicated. B: Representative hematoxylin-eosin–stained pancreatic sections obtained from 20-week-old ND NOD mice in the control group and their associated insulitis grading as indicated. Changes in percentages of four insulitis categories are summarized in stacked histograms (right) for mice in different treatment groups, ages, and D statuses as indicated. Data are from 157 to 618 islets in 3–10 mice as shown in A. C: Schematic of radioimmunoassay for measuring the serum IAA level and the associated results (right panel) obtained from 3–10 mice in different treatment groups, ages, and D statuses as indicated. Dashed gray line indicates the IAA positivity threshold, and the percentages of IAA+ or IAA mice are shown in red or blue, respectively. *P < 0.05, ***P < 0.01 by Kruskal-Wallis analysis with post hoc Mann-Whitney U test for pairwise comparison of the medians (A) or by χ2 analysis with post hoc multiple comparisons with the D control at 20 weeks of age (B).
Figure 5
Figure 5
Diabetes reversal induced by mAb43 therapy. A: Changes in FBG levels over time in NOD mice with delayed diabetes onset induced by mAb43 pretreatment. mAb43 therapy commenced within 48 h of diabetes onset and continued until death or terminal analysis at 12 weeks postonset. Inset shows steady-state FBG levels for individual mice. B: Changes in FBG levels over time for littermate diabetic NOD mice receiving isotype control injections until death. Ages at diabetes onset in the mAb43 treatment and control groups were 40.7 ± 1.5 and 33.1 ± 3.0 weeks, respectively. C: Survival percentages over time for diabetic mice described in A and B in the mAb43 treatment group (blue) and control group (red). D: Changes in FBG levels over time for mAb43-treated mice that had developed spontaneous diabetes without mAb43 pretreatment. E: Changes in FBG levels over time for isotype-treated littermate diabetic NOD mice. F: Survival percentages over time for mAb43- or isotype-treated mice described in D and E. Average ages at diabetes onset in the mAb43 treatment (blue) and control (red) groups were 22.9 ± 0.8 and 21.2 ± 1.0 weeks, respectively. G: Insulin immunohistochemistry (IHC) or hematoxylin-eosin (H&E) staining of pancreas sections from diabetic NOD mice with isotype treatment at 3 weeks postonset (upper) or with mAb43 treatment at 12 weeks postonset (lower). Arrows indicate residual islets with or without insulin staining. H: Detection of proliferating β-cells in remitted NOD mice at 12 weeks postonset by immunofluorescence costaining of pancreatic sections for insulin, Ki67, and DAPI. Arrows indicate Ki67-positive β-cells in the islets. I: Residual islet mass in diabetic NOD mice at 3 weeks postonset with isotype treatment or 12 weeks postonset with mAb43 treatment as indicated. J: Percentages of islets in four insulitis categories for diabetic NOD mice at 3 weeks postonset with isotype treatment or 12 weeks postonset with mAb43 treatment. K: Glucose tolerance tests (GTTs) in mAb43-treated NOD mice at 12 weeks postonset (blue) compared with those in new-onset NOD mice with isotype treatment (red). Note that GTTs were performed in the same mAb43-treated mice used for survival and terminal analyses in A and GJ. ***P < 0.01 by Kaplan-Meier analysis with log-rank test (C), by Kruskal-Wallis analysis with post hoc Mann-Whitney U test for pairwise comparison of the medians (I), or by χ2 analysis with post hoc multiple comparisons (J).
Figure 6
Figure 6
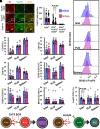
Selective enhancement of tolerogenic phenotypes of islet infiltrates by mAb43 treatment. A: Immunofluorescence colabeling of representative pancreatic sections from 20-week-old nondiabetic NOD mice for CD4 (red), Foxp3 (green), and CD25 (yellow). Islet boundary is outlined by a dashed circle, and islet-resident CD4+ T cells are either FoxP3CD25 (upper) or FoxP3+CD25+ (middle) with single-cell resolution as indicated by arrows in the lower panel. B: Quantification of islet-resident CD4+ T cells, CD4+FoxP3+CD25+ Tregs, and CD4+FoxP3+CD25 non-Tregs by enumerating individual islet-resident CD4+ T cells positively or negatively immunolabeled for FoxP3 and CD25 in pancreatic sections from 20-week-old nondiabetic NOD mice with mAb43 treatment (blue; n = 10 mice) and age-matched nondiabetic NOD mice with isotype treatment (red; n = 10 mice). A total of 120 islets from each treatment group were examined. CH: Immunophenotyping of tissue-resident lymphocytes isolated from the pancreatic islets, PLNs, and spleen of 20-week-old nondiabetic NOD mice in the mAb43 (blue) or isotype (red) treatment groups. A total of seven mice in each group were examined. Cell populations expressing individual markers were calculated as percentages per total lymphocyte or CD19+ or CD4+ population as indicated. Shown are overall percentages of CD19+ B cells, CD4+ and CD8+ T cells, and CD19+ B cells expressing CD40, CD80, and MHC class II. I: Representative histograms showing the distribution of FoxP3 expressing cells in CD4+ populations from the islets, PLNs, and spleens of a pair of mice with mAb43 (blue) or isotype (red) treatment as indicated. The vertical dashed line marks the gates for CD4+FoxP3+ populations. J: Overall percentages of CD4+ T cells expressing FoxP3 in the islets, PLNs, and spleens as indicated. K: Schematic model for the mechanism of action. ZnT8 binds to BCR to activate the B cell, leading to cytotoxic effector T-cell activation. L: mAb43 masks the β-cell from BCR recognition, leading to an increase in the Treg cell proportion in the islet. ***P < 0.01 by two-tailed t test for two independent means (B or J).
Figure 7
Figure 7
Direct impact of mAb43 on insulin secretion and biosynthesis. A: Basal ex vivo insulin secretion from isolated mouse islets in Krebs buffer with 2 mmol/L glucose in the presence or absence of a proinflammatory cytokine cocktail. mAb43, mAb20, or mouse IgG isotype control was added to the culture overnight as indicated. Error bars indicate SE. B: GSIS from isolated mouse islets in Krebs buffer with 20 mmol/L glucose and 50 μmol/L IBMX in the presence or absence of cytokine as indicated. C: Total islet insulin content from isolated mouse islets. D: Serum insulin levels over time in 6-week-old NOD mice in response to a glucose injection. These mice received weekly injections of mAb43 (blue) or isotype (red) starting from 3 weeks of age. E: Serum insulin levels over time in response to a glucose injection to diabetic NOD mice in remission after mAb43 treatment at 12 weeks postonset (blue) or a glucose injection to diabetic NOD mice with isotype treatment at 3 weeks postonset (red). The same remitted mice were used in diabetes reversal experiments as described in Fig. 5A. F: Absence of insulitis in 17-week-old hyperglycemic male B6 db mice administered weekly mAb43 or isotype control injections from 6 to 17 weeks of age as indicated. G: FBG levels over time in male B6 db mice administered weekly mAb43 (blue) or isotype control (red) injections from 6 to 17 weeks of age (n = 2 × 5). H: Glucose tolerance tests (GTTs) in male B6 db mice at 10 weeks of age. Same mice were used in G. I: GTTs in male B6 db mice at 15 weeks of age. No statistically significant differences between treatment groups as determined by two-way ANOVA with repeated measures. ***P < 0.01 by two-tailed t test for two independent means.

References

    1. Ziegler AG, Rewers M, Simell O, et al. . Seroconversion to multiple islet autoantibodies and risk of progression to diabetes in children. JAMA 2013;309:2473–2479 - PMC - PubMed
    1. Vives M, Somoza N, Soldevila G, et al. . Reevaluation of autoantibodies to islet cell membrane in IDDM. Failure to detect islet cell surface antibodies using human islet cells as substrate. Diabetes 1992;41:1624–1631 - PubMed
    1. Huang Q, Merriman C, Zhang H, Fu D.. Coupling of insulin secretion and display of a granule-resident zinc transporter ZnT8 on the surface of pancreatic beta cells. J Biol Chem 2017;292:4034–4043 - PMC - PubMed
    1. Guo Z, Kasinathan D, Merriman C, et al. . Cell-surface autoantibody targets zinc transporter-8 (ZnT8) for in vivo β-cell imaging and islet-specific therapies. Diabetes 2023;72:184–195 - PMC - PubMed
    1. Gu Y, Merriman C, Guo Z, et al. . Novel autoantibodies to the β-cell surface epitopes of ZnT8 in patients progressing to type-1 diabetes. J Autoimmun 2021;122:102677. - PMC - PubMed