. 2024 Apr 4;84(7):1271-1289.e12.
doi: 10.1016/j.molcel.2024.01.026. Epub 2024 Feb 21.

Denaturing purifications demonstrate that PRC2 and other widely reported chromatin proteins do not appear to bind directly to RNA in vivo

Affiliations

Denaturing purifications demonstrate that PRC2 and other widely reported chromatin proteins do not appear to bind directly to RNA in vivo

Jimmy K Guo et al. Mol Cell. .

Abstract

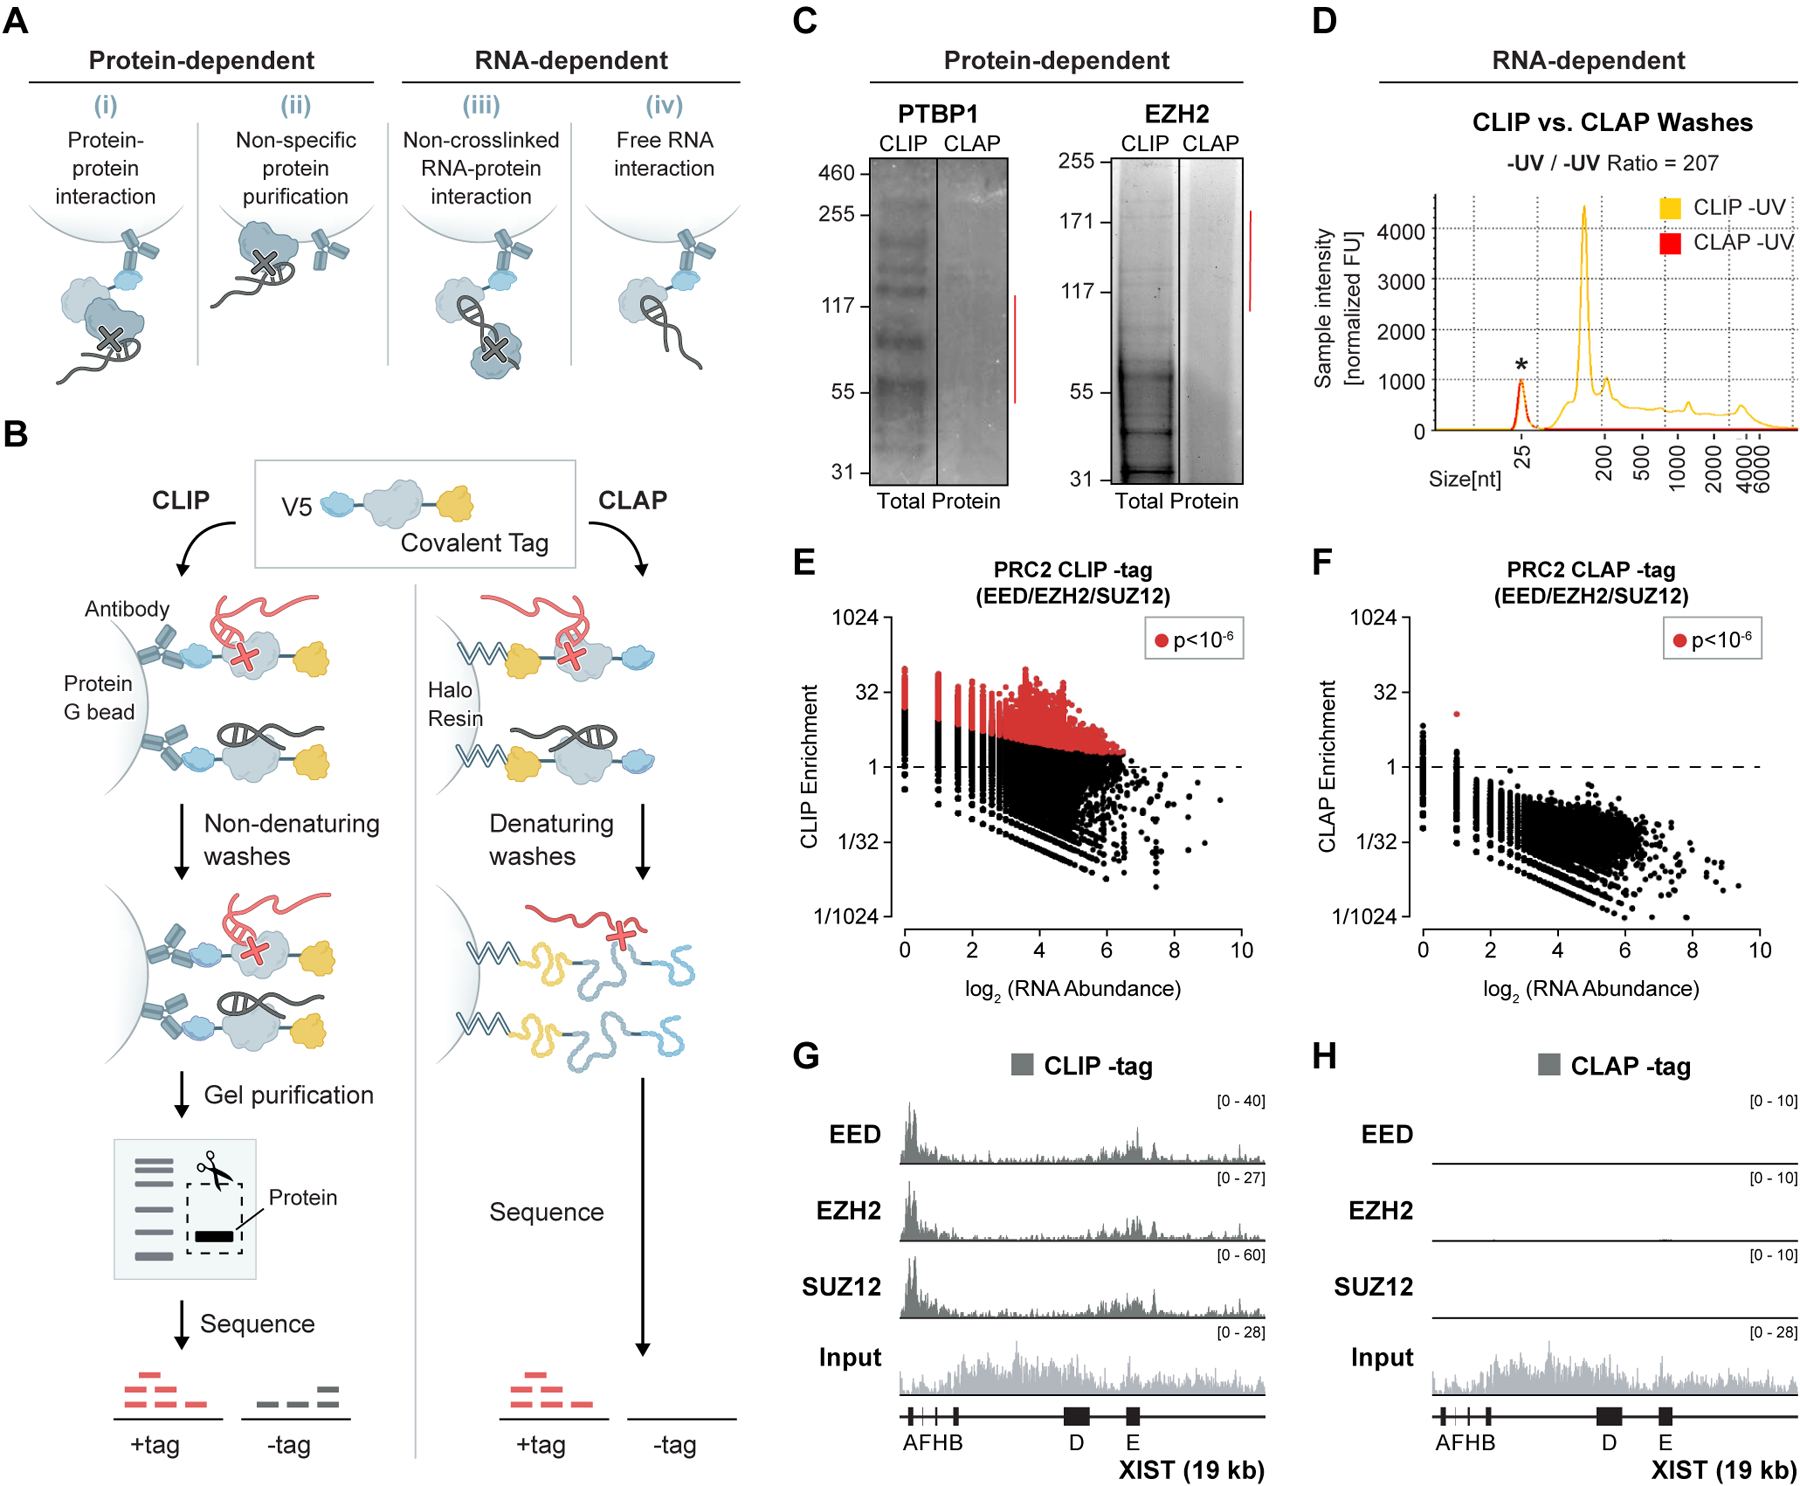
Polycomb repressive complex 2 (PRC2) is reported to bind to many RNAs and has become a central player in reports of how long non-coding RNAs (lncRNAs) regulate gene expression. Yet, there is a growing discrepancy between the biochemical evidence supporting specific lncRNA-PRC2 interactions and functional evidence demonstrating that PRC2 is often dispensable for lncRNA function. Here, we revisit the evidence supporting RNA binding by PRC2 and show that many reported interactions may not occur in vivo. Using denaturing purification of in vivo crosslinked RNA-protein complexes in human and mouse cell lines, we observe a loss of detectable RNA binding to PRC2 and chromatin-associated proteins previously reported to bind RNA (CTCF, YY1, and others), despite accurately mapping bona fide RNA-binding sites across others (SPEN, TET2, and others). Taken together, these results argue for a critical re-evaluation of the broad role of RNA binding to orchestrate various chromatin regulatory mechanisms.

Keywords: CLIP; PRC2; RNA; RNA-binding proteins; chromatin.


Conflict of interest statement

Declaration of interests M.R.B., W.G.W., and M.G. are inventors on a patent covering the CLAP method.

Figures

Figure 1.
Figure 1.. A method to identify RNA-protein associations that could not have formed in vivo.
(a) Schematic of mixing experiment. An epitope-tagged protein is expressed in cells (+tag, red), UV-crosslinked, lysed, and mixed with UV-crosslinked cell lysate from cells of a different species not expressing the tagged protein (−tag, grey). The tagged protein is purified using an antibody against the epitope tag, and purified RNAs are sequenced and aligned to quantify the amount of RNA associated with +tag and −tag RNAs, respectively. (b, c) CLIP enrichment profiles for each PRC2 protein (EED, EZH2, SUZ12) are plotted across XIST in the +tag (red) samples (b) and in the −tag (grey) samples (c). Input reads for the EZH2 samples are plotted in light grey. (d, e) Scatter plots of input RNA abundance (log scale, x-axis) compared to CLIP enrichment (log scale, y-axis) across 100-nucleotide windows of all annotated human RNAs in +tag (left) and −tag (right). Windows with significant enrichment (binomial p<10−6) are shown in red. Plots include all 3 PRC2 components; individual components are plotted in Figure S4A and S4B. (f) Density scatter plot comparing the levels of significant (p<10−6) +tag CLIP enrichments (x-axis) to significant −tag CLIP enrichments (y-axis) for all 3 PRC2 components across all human RNAs.
Figure 2.
Figure 2.. CLAP removes non-specific RNA-protein associations.
(a) Protein-dependent background (left) and RNA-dependent background (right) that could lead to detection of RNA not crosslinked to the purified protein (grey RNAs) by CLIP. (b) Comparison of CLIP (left) and CLAP (right). A protein tagged with both a covalent tag (HaloTag or SpyTag) and V5 epitope tag is expressed. The sample is split, and CLIP and CLAP are performed separately. CLIP is performed with an anti-V5 antibody followed by standard CLIP washes, gel electrophoresis, transfer to a nitrocellulose membrane, and size selection prior to RNA sequencing. CLAP is performed by covalently binding the protein to resin followed by washes in fully denaturing conditions prior to RNA sequencing. (c) Halo-PTBP1-V5 (left) and Halo-EZH2-V5 (right) protein were captured on HaloLink resin, washed with either CLIP or CLAP wash buffers, and remaining associated proteins were eluted (via heat), separated by SDS-PAGE, and detected using SyproRuby total protein stain. Red lines indicate regions usually cut for CLIP (~70 kDa above protein molecular weight). (d) Equivalent amounts of non-crosslinked HEK293T (-UV) whole cell lysate were coupled to amine-reactive beads and washed with either CLIP or CLAP wash buffers. The remaining bound RNA-protein complexes was eluted using proteinase K and associated RNAs measured. (*) denotes the lower marker used for sizing. (e, f) Scatter plots (left, CLIP; right, CLAP) of input RNA abundance compared to enrichment across 100-nucleotide windows of all human RNAs in the −tag experiments. Plots include all 3 PRC2 components; individual components are plotted in Figure S4B and S5C. (g, h) Enrichment profiles for each PRC2 protein (EED, EZH2, SUZ12) in the −tag samples are plotted across the human XIST lncRNA for CLIP (left, same as Figure 1C) and CLAP (right). Input reads from EZH2 samples are plotted in light grey (CLIP and CLAP input are identical because they come from the same lysate).
Figure 3.
Figure 3.. CLAP accurately maps in vivo crosslinked RNA-protein interactions.
(a) Visualization of radiolabeled RNA (32P) co-purified with Halo-PTBP1-V5 by either CLIP (left) or CLAP (right). Protein capture was verified by western blot (below). Lower molecular weight in CLAP due to TEV cleavage required to release from resin. Expected molecular weights are indicated. (b) Examples of CLIP and CLAP enrichments for PTBP1 over PLD3 pre-mRNA (top, intronic region spanning 0–3,000nt) and CFL1 mRNA (bottom). Location of PTBP1 motif is shown (red line). (c) Examples of CLIP and CLAP enrichments for SAF-A over YTHDF2 mRNA and BTG2 mRNA. Exons are denoted by boxes and introns by connecting lines. (d, e) Scatter plots of input RNA abundance compared to enrichment across 100-nucleotide windows of all human RNAs identified for PTBP1 by CLIP (left) or CLAP (right). (f) Density scatter plot comparing the levels of significant PTBP1 enrichment (p<10−6) between CLIP (x-axis) and CLAP (y-axis) across all human RNAs. (g, h) Scatter plots of input RNA abundance compared to enrichment across 100-nucleotide windows of all human RNAs identified for SAF-A by CLIP (left) or CLAP (right). Windows with significant enrichment (binomial p<10−6) are shown in red. (i) Density scatter plot comparing the levels of significant SAF-A enrichment (p<10−6) between CLIP (x-axis) and CLAP (y-axis) across all human RNAs.
Figure 4.
Figure 4.. PRC2 components purified using denaturing conditions do not appear to bind RNA.
(a) Visualization of radiolabeled RNA (32P) purified by CLAP from Halo-V5-tagged versions of PTBP1 and EZH2 across independent biological replicates. Protein capture was verified by western blot (below). (b, c) Enrichments for PTBP1, SAF-A, EED, EZH2, SUZ12, and GFP plotted across XIST in the +tag experiments for CLIP (left; EED, EZH2, and SUZ12 same as Figure 1B) or CLAP (right). (d, e) Scatter plots of input RNA abundance compared to PRC2 enrichment across 100-nucleotide windows of all human RNAs in the +tag experiments for CLIP (left; same as Figure 1D) or CLAP (right). The plot includes all 3 PRC2 components; individual components are plotted in Figure S8A. (f) Density scatter plot comparing the levels of +tag CLIP enrichments (x-axis) to +tag CLAP enrichments (y-axis) for all 3 PRC2 components across 100-nucleotide windows of all human RNAs. (g) Integration strategy at endogenous locus for generating V5-Spy-tagged proteins (top). Scatter plot of input RNA abundance compared to CLAP enrichment for all endogenous Spy-tagged PRC2 proteins across 100-nucleotide windows of all mouse RNAs. (h) ChIP-seq against each V5-Spy-tagged PRC2 component (top, purple). ChIP-seq on H3K27me3 from each tagged (middle, orange) and untagged cell line (bottom, yellow). Read coverage is plotted across the HOXD cluster along with input (light grey).
Figure 5.
Figure 5.. Several chromatin regulators reported to bind RNA do not appear to bind in vivo.
(a) Scatter plot of input RNA abundance compared to CLAP enrichment across 100-nucleotide windows of all human RNAs for Halo-CTCF-V5. (b) ChIP-seq of endogenous CTCF versus Halo-V5-tagged CTCF. (c) Scatter plot of input RNA abundance compared to CLAP enrichment across 100-nucleotide windows of all mouse RNAs for V5-Spy-YY1. (d) ChIP-seq of endogenous YY1 versus V5-Spy-tagged YY1. (e) Scatter plot of input RNA abundance compared to CLAP enrichment across 100-nucleotide windows of all human RNAs for Halo-WDR5-V5. (f) ChIP-seq of endogenous WDR5 versus Halo-V5-tagged WDR5.
Figure 6.
Figure 6.. Denaturing purification identifies specific chromatin proteins that bind to RNA in vivo.
(a) Functional categories of chromatin proteins tested by CLAP (see STAR Methods). Proteins identified as RNA-binding proteins by CLAP are bolded. (b) Cumulative distribution plot for the top 10,000 enriched 100-nucleotide windows across all RNAs for chromatin proteins measured by CLAP. (c, e, g) Scatter plots of input RNA abundance compared to CLAP enrichment across 100-nucleotide windows of all RNAs for a set of Halo-V5-tagged chromatin proteins (SPEN, CHTOP, TET2). (d) Examples of CLAP enrichment profiles for SPEN across Xist (top), Kcnq1ot1 (middle, 0–10 kb), and Spen pre-mRNA (bottom, intron 2, ~4.7 kb). (f) Examples of CLAP enrichment profiles for CHTOP over the ANAPC7 pre-mRNA (top), KLC1 pre-mRNA (middle, first intron, 0–5 kb), and ALYREF pre-mRNA. (h) Examples of CLAP enrichment profiles for TET2 over the DUS3L pre-mRNA (top), CTBP1 pre-mRNA (middle), and an antisense RNA transcribed from the TET2 promoter (bottom, region spanning 10 kb). Blue box indicates a CpG island, arrows indicate direction of transcription (black, sense; red, antisense).

Similar articles

Cited by

References

    1. Kwon SC, Yi H, Eichelbaum K, Fohr S, Fischer B, You KT, Castello A, Krijgsveld J, Hentze MW, and Kim VN (2013). The RNA-binding protein repertoire of embryonic stem cells. Nat Struct Mol Biol 20, 1122–1130. 10.1038/nsmb.2638. - DOI - PubMed
    1. Castello A, Fischer B, Eichelbaum K, Horos R, Beckmann BM, Strein C, Davey NE, Humphreys DT, Preiss T, Steinmetz LM, et al. (2012). Insights into RNA Biology from an Atlas of Mammalian mRNA-Binding Proteins. Cell 149, 1393–1406. 10.1016/j.cell.2012.04.031. - DOI - PubMed
    1. Castello A, Hentze MW, and Preiss T (2015). Metabolic Enzymes Enjoying New Partnerships as RNA-Binding Proteins. Trends in Endocrinology & Metabolism 26, 746–757. 10.1016/j.tem.2015.09.012. - DOI - PMC - PubMed
    1. He C, Sidoli S, Warneford-Thomson R, Tatomer DC, Wilusz JE, Garcia BA, and Bonasio R (2016). High-Resolution Mapping of RNA-Binding Regions in the Nuclear Proteome of Embryonic Stem Cells. Mol Cell 64, 416–430. 10.1016/j.molcel.2016.09.034. - DOI - PMC - PubMed
    1. Davidovich C, Zheng L, Goodrich KJ, and Cech TR (2013). Promiscuous RNA binding by Polycomb repressive complex 2. Nat Struct Mol Biol 20, 1250–1257. 10.1038/nsmb.2679. - DOI - PMC - PubMed