

Fetal face shape analysis from prenatal 3D ultrasound images
- PMID: 38388522
- PMCID: PMC10884000
- DOI: 10.1038/s41598-023-50386-9
Fetal face shape analysis from prenatal 3D ultrasound images
Abstract
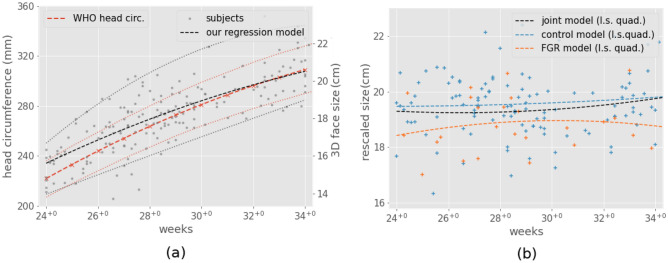
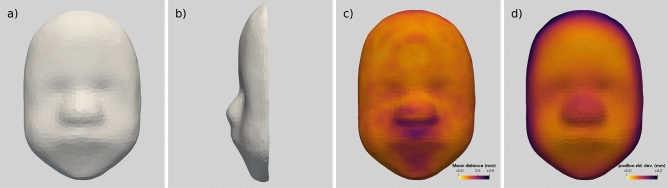
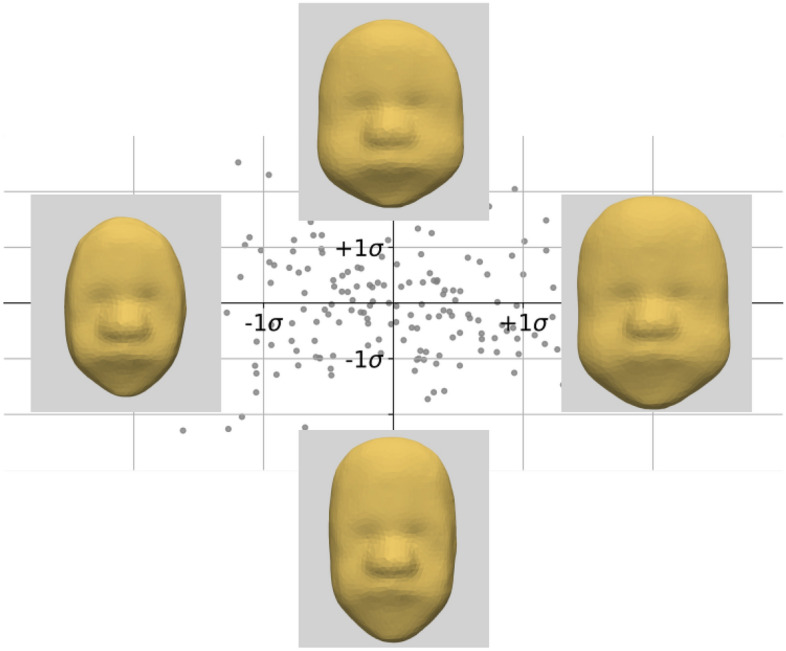
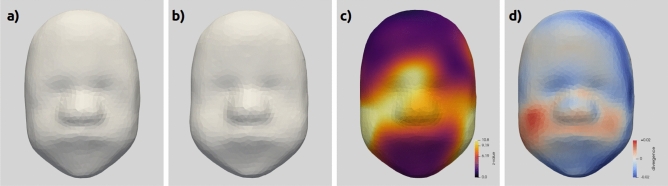
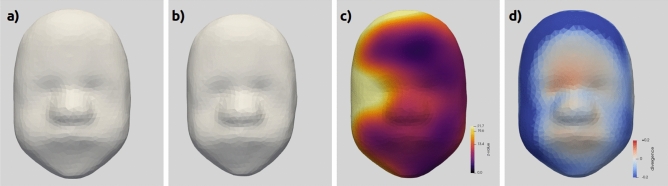
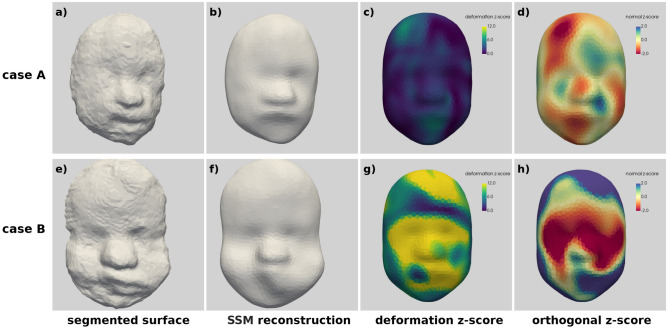
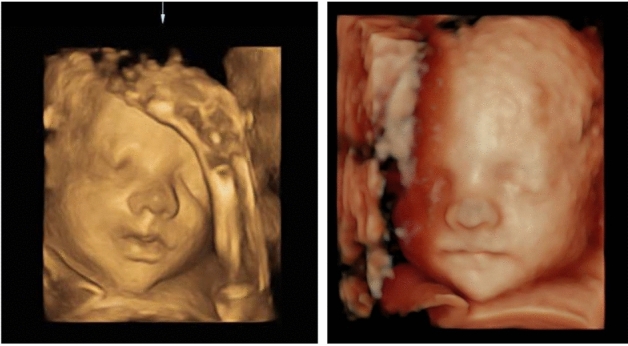
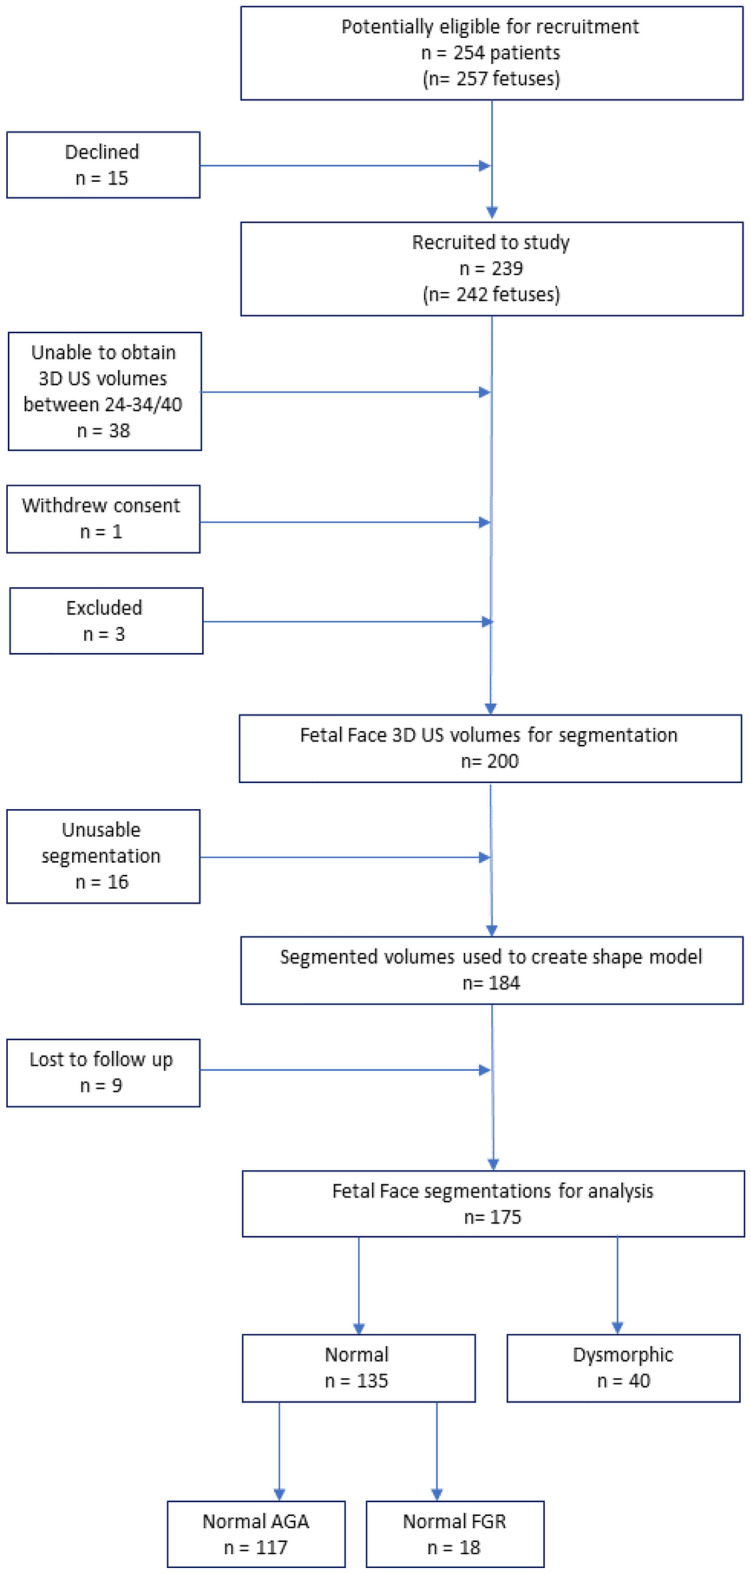
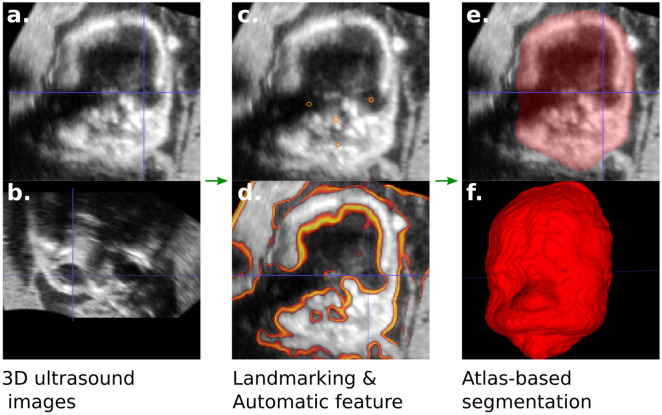
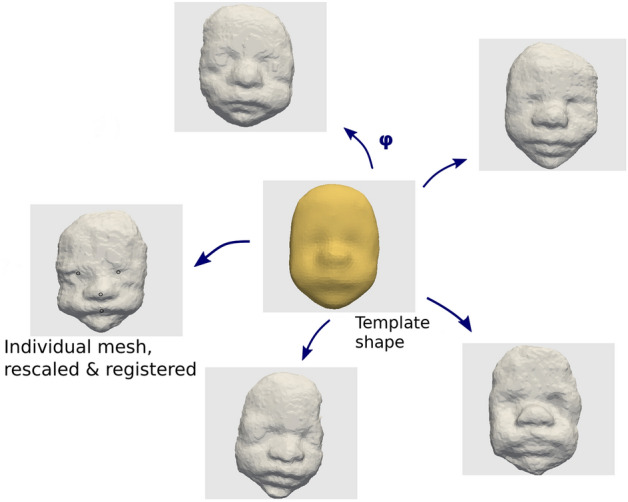
3D ultrasound imaging of fetal faces has been predominantly confined to qualitative assessment. Many genetic conditions evade diagnosis and identification could assist with parental counselling, pregnancy management and neonatal care planning. We describe a methodology to build a shape model of the third trimester fetal face from 3D ultrasound and show how it can objectively describe morphological features and gestational-age related changes of normal fetal faces. 135 fetal face 3D ultrasound volumes (117 appropriately grown, 18 growth-restricted) of 24-34 weeks gestation were included. A 3D surface model of each face was obtained using a semi-automatic segmentation workflow. Size normalisation and rescaling was performed using a growth model giving the average size at every gestation. The model demonstrated a similar growth rate to standard head circumference reference charts. A landmark-free morphometry model was estimated to characterize shape differences using non-linear deformations of an idealized template face. Advancing gestation is associated with widening/fullness of the cheeks, contraction of the chin and deepening of the eyes. Fetal growth restriction is associated with a smaller average facial size but no morphological differences. This model may eventually be used as a reference to assist in the prenatal diagnosis of congenital anomalies with characteristic facial dysmorphisms.
© 2024. The Author(s).
Conflict of interest statement
The authors declare no competing interests.
Figures
Similar articles
-
Quantitative analysis of fetal facial morphology using 3D ultrasound and statistical shape modeling: a feasibility study.Am J Obstet Gynecol. 2017 Jul;217(1):76.e1-76.e8. doi: 10.1016/j.ajog.2017.02.007. Epub 2017 Feb 14. Am J Obstet Gynecol. 2017. PMID: 28209493
-
Reference standards for facial measurements in early third trimester South African fetuses, and the effect of maternal and fetal characteristics.J Matern Fetal Neonatal Med. 2022 Dec;35(25):8434-8442. doi: 10.1080/14767058.2021.1977794. Epub 2022 Jan 19. J Matern Fetal Neonatal Med. 2022. PMID: 35042446
-
[Craniofacial malformations in prenatal ultrasound evaluation. Literature review].Ginekol Pol. 2013 Sep;84(9):801-6. doi: 10.17772/gp/1643. Ginekol Pol. 2013. PMID: 24191520 Review. Polish.
-
Transvaginal three-dimensional ultrasound assessment of Sylvian fissures at 18-30 weeks' gestation.Ultrasound Obstet Gynecol. 2019 Aug;54(2):190-198. doi: 10.1002/uog.20172. Epub 2019 Jul 8. Ultrasound Obstet Gynecol. 2019. PMID: 30381851
-
Diagnostic performance of third-trimester ultrasound for the prediction of late-onset fetal growth restriction: a systematic review and meta-analysis.Am J Obstet Gynecol. 2019 May;220(5):449-459.e19. doi: 10.1016/j.ajog.2018.09.043. Epub 2019 Jan 8. Am J Obstet Gynecol. 2019. PMID: 30633918
References
MeSH terms
Grants and funding
LinkOut - more resources
Full Text Sources
Medical
