. 2024 Feb 22;15(1):1628.
doi: 10.1038/s41467-024-46018-z.

Euglena's atypical respiratory chain adapts to the discoidal cristae and flexible metabolism

Affiliations

Euglena's atypical respiratory chain adapts to the discoidal cristae and flexible metabolism

Zhaoxiang He et al. Nat Commun. .

Abstract

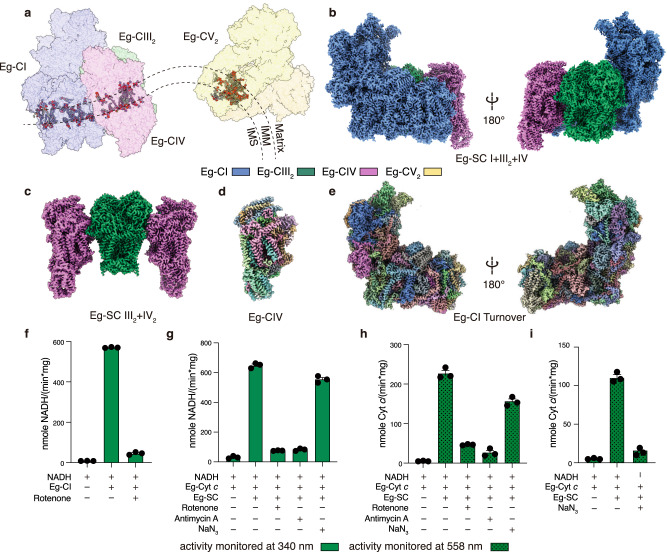
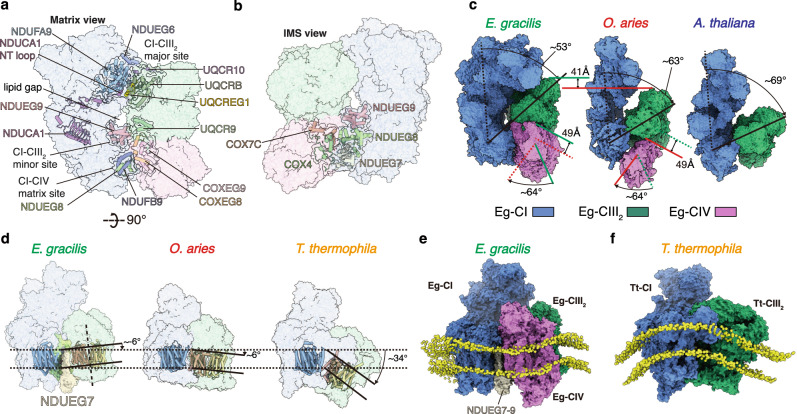
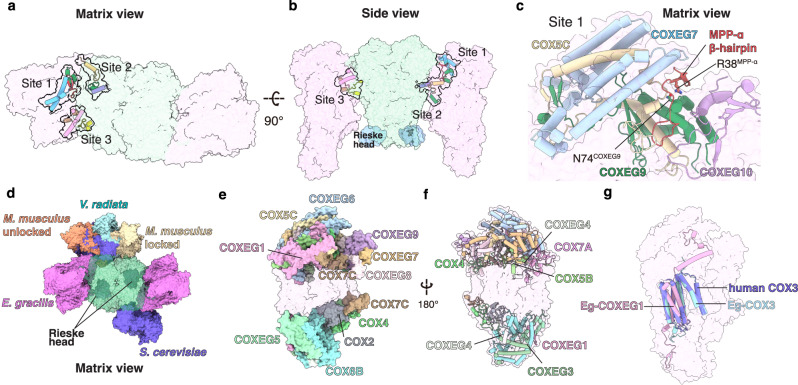
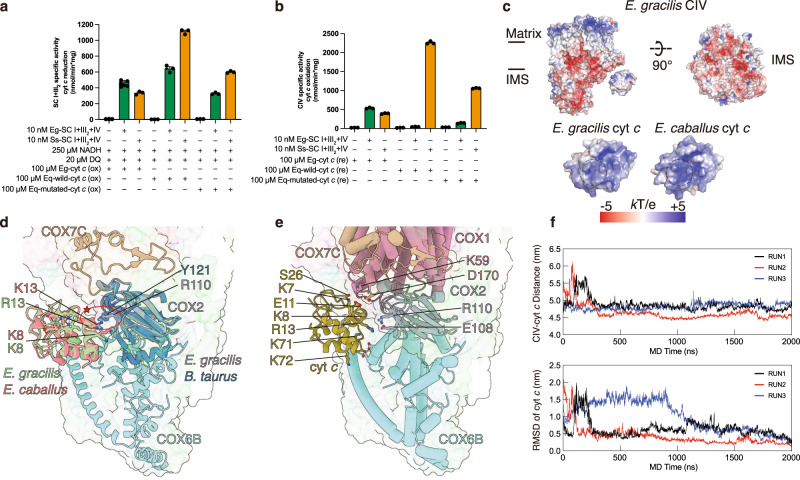
Euglena gracilis, a model organism of the eukaryotic supergroup Discoba harbouring also clinically important parasitic species, possesses diverse metabolic strategies and an atypical electron transport chain. While structures of the electron transport chain complexes and supercomplexes of most other eukaryotic clades have been reported, no similar structure is currently available for Discoba, limiting the understandings of its core metabolism and leaving a gap in the evolutionary tree of eukaryotic bioenergetics. Here, we report high-resolution cryo-EM structures of Euglena's respirasome I + III2 + IV and supercomplex III2 + IV2. A previously unreported fatty acid synthesis domain locates on the tip of complex I's peripheral arm, providing a clear picture of its atypical subunit composition identified previously. Individual complexes are re-arranged in the respirasome to adapt to the non-uniform membrane curvature of the discoidal cristae. Furthermore, Euglena's conformationally rigid complex I is deactivated by restricting ubiquinone's access to its substrate tunnel. Our findings provide structural insights for therapeutic developments against euglenozoan parasite infections.


Conflict of interest statement

The authors declare no competing interests.

Figures

Fig. 1
Fig. 1. Overall structures and functions of E. gracilis’s ETC.
a Representation of E. gracilis’s mitochondrial ETC on a discoid crista. Supercomplexes are shown in transparent surfaces colored by individual complexes (Eg-CV2, PDB 6TDU); phospholipids are shown as spheres colored by elements. Eg-SC I + III2 + IV (b) and Eg-SC III2 + IV2 (c) cryo-EM maps are colored by individual complexes as labeled. Eg-CIV (d) and Eg-CI (e) cryo-EM maps, which contain most of the E. gracilis specific subunits, are also colored by individual subunits. f NADH-DQ oxidoreductase activity of isolated Eg-CI in the absence or presence of 500 μM rotenone. NADH:O2 oxidoreductase activities of Eg-SC I + III2 + IV monitored by NADH oxidation at 340 nm (g), cyt c reduction at 558 nm (h) and cyt c oxidation also at 558 nm (i), in the absence or presence of 500 μM rotenone, 1 mM antimycin A or 100 mM NaN3. Data are presented as mean values ± standard error of mean (SEM), n = 3 biologically independent activity experiments. Source data are provided as a Source Data file.
Fig. 2
Fig. 2. The FAS domain and the split core subunits.
Overall structure (a) and zoom-ins (b) of the FAS domain within Eg-SC I + III2 + IV. c Structural alignments of ND2 subunits between E. gracilis (this study, ND2A dark green, ND2B light green) and T. thermophila (PDB 7TGH, ND2A dark blue, ND2B light blue) are shown as super-imposed cartoons. d Structural alignments of ND2 subunits between Y. lipolytica (PDB 6RFR, light yellow) and O. aries (PDB 6ZKD, dark yellow) are also shown as a reference to (c). Structural comparison of T. thermophilus Nqo3 subunit (PDB 2FUG) (e) and E. gracilis NDUFS1 subunit (this study) (f). The NT and CT domains of T. thermophilus Nqo3 are colored by blue and different shades of green marking the four subdomains. E. gracilis NDUFS1A and NDUFS1B are colored in light blue and yellow respectively. gi Association of the FAS domain onto Eg-CI PA. The NDUFS1A and NDUFS1B are shown in surfaces and other subunits are shown in cartoons. Relative rotations of the point of view between individual panels are labeled by their directions and degrees.
Fig. 3
Fig. 3. Interaction sites within Eg-SC I + III2 + IV.
Individual complexes are colored as labeled throughout this figure (CI: blue; CIII2: green; CIV: magenta). Matrix (a) and IMS (b) view of interaction sites within Eg-SC I + III2 + IV. Individual complexes are shown as colored transparent surfaces. Key subunits are shown as cartoons. c Comparisons of the SC I + III2 + IV or SC I + III2 from E. gracilis, O. aries (PDB 5J4Z) and A. thaliana (PDB 8BPX). Note that since Eg- and ovine respirasomes are shown side by side, positional comparisons of their CIII2 and CIV are visualized by color-coded lines (green: Eg-; red: ovine) marking translational and rotational positions of respective complexes. Translational distances and rotational angles are labeled. d Comparison of CI-CIII2 angle in E. gracilis, O. aries and T. thermophila (PDB 7TGH), viewed from alongside the membrane plane. TMHs of ND5 and COB are shown in colored cartoons indicating the membrane curvatures, NDUEG7 is shown in solid surface. CG MD simulations of Eg-SC I + III2 + IV (e) and Tt-SC I + III2 (f) in lipid bilayers demonstrate that they induce negative and positive membrane curvatures respectively. Individual complexes are colored as in Figs. 1, 2. The CG lipid phosphate head groups are shown as yellow spheres.
Fig. 4
Fig. 4. Eg-CI’s A/D transition.
Thermal deactivation assays of S. scrofa CI (a), S. scrofa SC I + III2 + IV (b), E. gracilis CI (c) and E. gracilis SC I + III2 + IV (d), measured by NADH oxidation at 340 nm. The assays are performed in the presence of the indicated concentrations of NEM, with or without 10 μM NADH re-activation. Data are presented as mean values ± standard error of mean (SEM), n = 3 biologically independent activity experiments. Statistical analysis is performed with one-way ANOVA with Tukey’s multiple comparisons test. **, p < 0.01; ***, p < 0.001; ****, p < 0.0001. ns, not statistically significant (P > 0.05). Please note that the exact p value is not provided by Prism when <0.0001 (****). For (c), the three comparison tests giving ‘ns’, from left to right, have p values of 0.5471, 0.9996 and 0.9602, respectively. For (d), the comparison tests giving ‘***’, ‘**’ and ‘ns’, from left to right, have p values of 0.0002, 0.0017, 0.3271, 0.9472 and 0.1270, respectively. e Structural alignment of class 1 (purple) and class 2 (salmon) Eg-SC I + III2 + IV, shown as flat surfaces. Note that the two classes do not exhibit major global conformational difference. f, g Local conformations of Q tunnel loops in the Eg-CI turnover structures. The Q tunnel is shown as light blue surfaces. Slight rotation exists between the two panels to better illustrate Q tunnel shaping capability of NDUFS7 β strands. Densities for TMHNDUEG6, amphipathic helices of NDUFS7, NDUFA7 and NDUFA12, as well as key cardiolipins, are shown as transparent surfaces for Eg-CI turnover (h), NADH-reduced (i) and deactivated (j) states. Source data are provided as a Source Data file.
Fig. 5
Fig. 5. Interaction sites within Eg-SC III2 + IV2.
Matrix (a) and side (b) views of Eg-SC III2 + IV2 interaction sites 1–3 with individual complexes shown as colored transparent surfaces. Rieske heads are shown as light blue solid surfaces. c Zoom-ins of Eg-CIII2 + CIV2 interaction site 1. Key residues forming polar contacts are shown as sticks and colored by elements. In site 1 MPP-α’ β hairpin (red) wedges into a cleft on CIV surface. d Alignment of SC III2 + IV1/2 from different species by the COB dimer viewed from the matrix side, including, M. musculus unlocked (PDB 7O3C), M. musculus locked (PDB 7O37), V. radiata (PDB 7JRP), S. cerevisiae (PDB 6T0B) and E. gracilis (this study). The matrix domain and the IMS helmet-like domain of Eg-CIV are shown as colored solid surfaces (e) and cartoons (f) in the context of the Eg-CIV. g Structural alignment of Eg-COX3 and Eg-COXEG1 to human COX3 (slate, PDB 5Z62) demonstrating that TMHs from the two Eg subunits together constitute a canonical seven-TMH COX3 subunit found in mammals.
Fig. 6
Fig. 6. Functional and structural divergence of Eg-CIV and cyt c.
Spectroscopic assays of cyt c reduction activities (a) and cyt c oxidation activities (b) of E. gracilis (green) and S. scrofa (orange) SC I + III2 + IV, monitored at 558 or 550 nm for Eg- or equine cyt c respectively as indicated. Data are presented as mean values ± standard error of mean (SEM), n = 3 biologically independent activity experiments. c Surface electrostatic potentials of Eg-CIV, equine cyt c (PDB 1HRC) and Eg-cyt c (UniProt: P00076, AlphaFold predicted structure). Electrostatic potentials are calculated using the APBS plugin of PyMOL colored by a symmetric color ramp from −5 kT/e (red) to +5 kT/e (blue). d Eg-CIV and Eg-cyt c aligned to the mammalian CIV-cyt c complex structure (PDB 5IY5). The star indicates electrostatic repulsion between Eg-CIV and Eg-cyt c if adopting the same association orientation as mammalian CIV-cyt c. Key residues are shown as sticks and colored by elements. e MD simulation (Run 1) of Eg-CIV+Eg-cyt c with potential key interacting residues shown as sticks and colored by elements. f MD trajectories (Run 1–3) of the center-of-mass distance between CIV and cyt c (upper panel) and the root-mean-square deviation (RMSD) of cyt c relative to the last frame of the simulation (lower panel) after aligning the entire CIV-cyt c complex with CIV during the 2000 ns MD simulation run. Source data are provided as a Source Data file.

Similar articles

Cited by

References

    1. Mitchell P. Chemiosmotic coupling in energy transduction: A logical development of biochemical knowledge. J. Bioenerg. 1972;3:5–24. doi: 10.1007/BF01515993. - DOI - PubMed
    1. Vercellino I, Sazanov LA. The assembly, regulation and function of the mitochondrial respiratory chain. Nat. Rev. Mol. cell Biol. 2022;23:141–161. doi: 10.1038/s41580-021-00415-0. - DOI - PubMed
    1. Davies KM, Blum TB, Kühlbrandt W. Conserved in situ arrangement of complex I and III2 in mitochondrial respiratory chain supercomplexes of mammals, yeast, and plants. Proc. Natl. Acad. Sci. USA. 2018;115:3024–3029. doi: 10.1073/pnas.1720702115. - DOI - PMC - PubMed
    1. Letts JA, Fiedorczuk K, Degliesposti G, Skehel M, Sazanov LA. Structures of respiratory supercomplex I+III2 reveal functional and conformational crosstalk. Mol. Cell. 2019;75:1131–1146.e6. doi: 10.1016/j.molcel.2019.07.022. - DOI - PMC - PubMed
    1. Klusch N. Cryo-EM structure of the respiratory I + III2 supercomplex from Arabidopsis thaliana at 2 Å resolution. Nat. plants. 2023;9:142–156. doi: 10.1038/s41477-022-01308-6. - DOI - PMC - PubMed

MeSH terms

Substances