. 2024 Feb 22;15(1):1640.
doi: 10.1038/s41467-024-45948-y.

TREX tetramer disruption alters RNA processing necessary for corticogenesis in THOC6 Intellectual Disability Syndrome

Affiliations

TREX tetramer disruption alters RNA processing necessary for corticogenesis in THOC6 Intellectual Disability Syndrome

Elizabeth A Werren et al. Nat Commun. .

Abstract

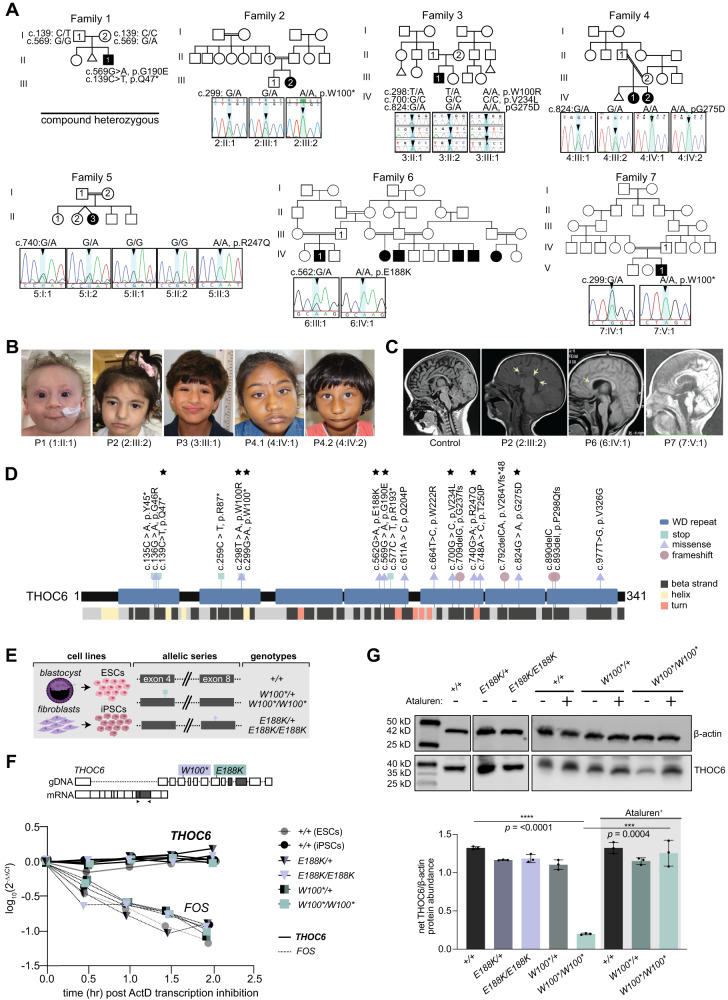
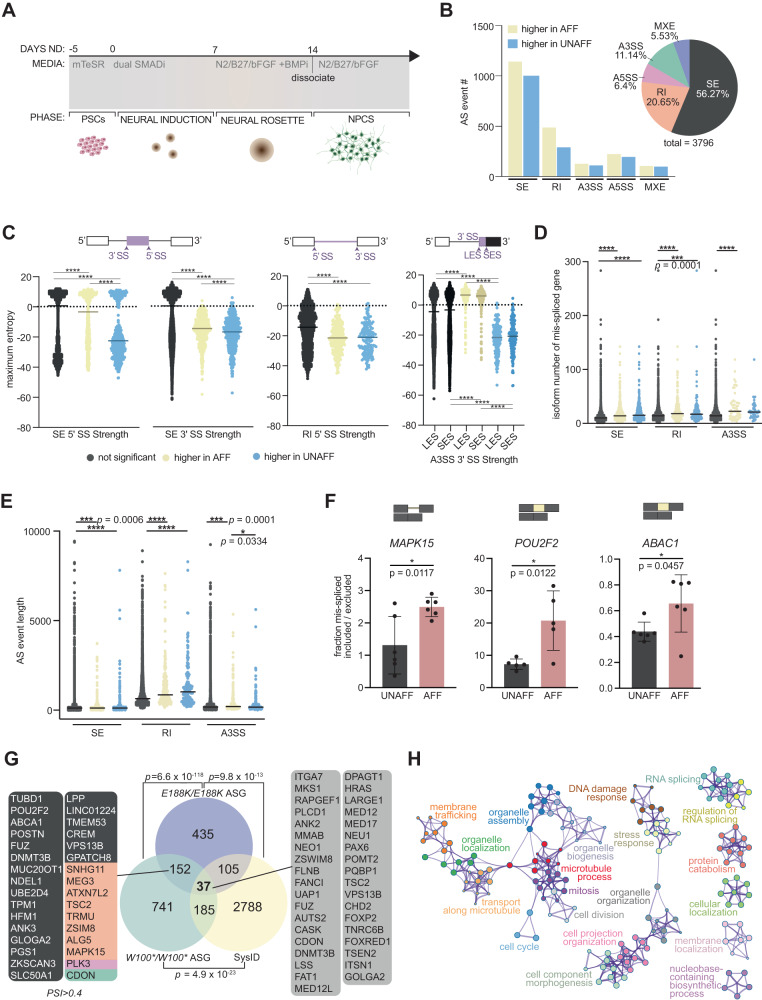
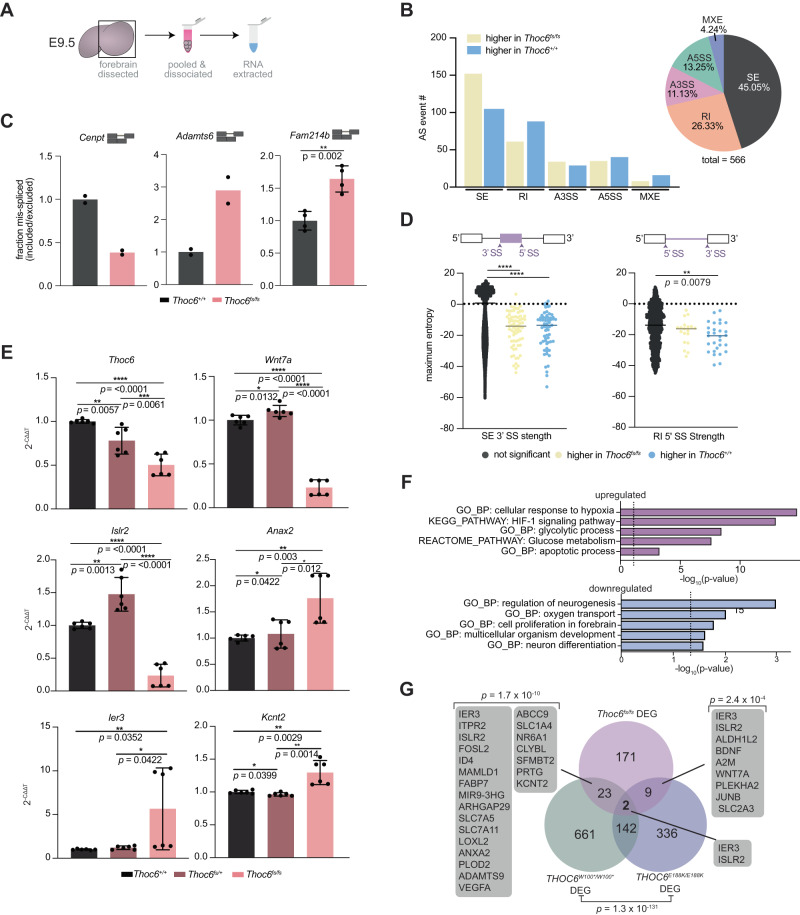
THOC6 variants are the genetic basis of autosomal recessive THOC6 Intellectual Disability Syndrome (TIDS). THOC6 is critical for mammalian Transcription Export complex (TREX) tetramer formation, which is composed of four six-subunit THO monomers. The TREX tetramer facilitates mammalian RNA processing, in addition to the nuclear mRNA export functions of the TREX dimer conserved through yeast. Human and mouse TIDS model systems revealed novel THOC6-dependent, species-specific TREX tetramer functions. Germline biallelic Thoc6 loss-of-function (LOF) variants result in mouse embryonic lethality. Biallelic THOC6 LOF variants reduce the binding affinity of ALYREF to THOC5 without affecting the protein expression of TREX members, implicating impaired TREX tetramer formation. Defects in RNA nuclear export functions were not detected in biallelic THOC6 LOF human neural cells. Instead, mis-splicing was detected in human and mouse neural tissue, revealing novel THOC6-mediated TREX coordination of mRNA processing. We demonstrate that THOC6 is required for key signaling pathways known to regulate the transition from proliferative to neurogenic divisions during human corticogenesis. Together, these findings implicate altered RNA processing in the developmental biology of TIDS neuropathology.


Conflict of interest statement

The authors declare no competing interests.

Figures

Fig. 1
Fig. 1. Biallelic pathogenic variants in THOC6 cause syndromic intellectual disability.
A Pedigree drawings of segregating TIDS phenotypes in families 1–7, with generations listed on the left-hand side. Females are represented as circles and males are denoted by squares. Miscarriages are denoted by small triangles. Affected family members are indicated by solid black coloring while unaffected are unfilled. Consanguineous partnerships are represented by double lines. Chromatograms from Sanger sequencing confirmation of THOC6 (NM_024339.5) genotypes are provided for each tested family member in families 1–7. B Facial photographs of P1-P4. C Sagittal brain MRI showing corpus callosum dysgenesis (P2, P6, & P7) and cortical and cerebellar atrophy (P6) compared to control (left). D Canonical THOC6 protein map consisting of 341 amino acids. WD40 repeat domains 1–7 are denoted by purple rectangles. The location of known pathogenic variants is annotated relative to the linear protein map (top) and secondary structure (below). Variants reported in the present study are distinguished by a black star. Missense (blue triangle), nonsense (red square), and frameshift (green circle). E Schematic of patient and control-derived human cell types and respective genotypes. F Levels of THOC6 mRNA (solid line) following ActD transcriptional inhibition compared to FOS mRNA (dotted line) in human ESC/iPSCs across genotypes: THOC6+/+ ESCs (grey solid circle), THOC6+/+ iPSCs (black solid circle), THOC6E188K/+ (purple-black triangle), THOC6E188K/E188K (solid light purple triangle), THOC6W100*/+ (green-black square), and THOC6W100/W100* (light green square). Values calculated relative to GAPDH reference mRNA. This experiment was repeated three independent times with similar results. G Western blot of human ESC/iPSCs indicating reduced THOC6 protein expression in THOC6W100*/W100* iPSCs compared to unaffected controls. Enhanced expression of THOC6W100* by Ataluren treatment (30 μM). Abundance quantifications relative to β-actin control (right). N = 3 independent abundance measurements per genotype. Genotypes: THOC6+/+ iPSCs (black), THOC6E188K/+ (dark purple), THOC6E188K/E188K (light purple), THOC6W100*/+ (dark green), and THOC6W100/W100* (light green). Data are represented as mean ± SEM. Significance measured by two-tailed, unpaired t test. **** indicates p-value = <0.0001. (For anti-THOC6 antibody validation, see Fig. S2A). This experiment was repeated two independent times with similar results. Source data are provided as a Source Data file.
Fig. 2
Fig. 2. Genetic mechanism of biallelic pathogenic THOC6 variants.
A Schematic of TREX core tetrameric assembly mediated by THOC6 with functional implications for mRNA processing and export based on the published crystal TREX structure. B Amino acid alignment showing conservation of affected residues (blue font) for pathogenic variants in present clinical study. Variants mapped to C THOC6 folded β-propeller structure and D THO/TREX complex. Missense variant residues are represented with purple cartoon spheres; nonsense variant residues are represented with green cartoon spheres. E Steady-state protein abundance for THO/TREX complex members. This experiment was independently repeated four times with similar results. F THOC6 and ALYREF abundance following co-immunoprecipitation with THOC5 for unaffected control, unaffected missense heterozygous, and affected missense homozygous iPSCs. This experiment was independently repeated three times with similar results. Source data are provided as a Source Data file.
Fig. 3
Fig. 3. Characterization of alternative splicing events in THOC6 affected hNPCs.
A Differentiation protocol to derive human neural progenitor cells from affected and unaffected ESC/iPSCs. B Combined rMATS summary results of statistically significant AS events in THOC6W100*/W100* and THOC6E188K/E188K hNPCs relative to THOC6W100*/+ control hNPCs. Event type (pie chart) and inclusion status (bar chart). Yellow, higher inclusion in affected condition. Blue, higher inclusion in unaffected conditions. C Significant splice site strength score differences at mis-spliced events in affected hNPCs based on the maximum entropy model. Black, non-significant events. Yellow, higher inclusion in affected condition. Blue, higher inclusion in unaffected conditions. Significance obtained by two-tailed, unpaired t test. **** indicates p = <0.0001. Transcript number per AS gene D and AS event length E in THOC6W100*/W100 and THOC6E188K/E188K vs. THOC6W100*/+ NPCs. Black, non-significant events. Yellow, higher inclusion in affected condition. Blue, higher inclusion in unaffected conditions. Significance obtained by two-tailed, unpaired t test. **** indicates p = <0.0001. F RT-PCR AS validations of SE (ABAC1, POU2F2) and RI (MAPK15) events in n = 3 additional biological replicates of hNPCs per genotype (6 per condition) with quantified mis-spliced ratios. Significant outliers were identified for POU2F2 and were then excluded from analysis. Data shown as mean ± SEM. Significance obtained by two-tailed, unpaired t test. UNAFF, unaffected heterozygous control (black); AFF, homozygous affected (red). G Venn diagram of overlap of THOC6 W100*/W100* and THOC6E188K/E188K AS genes and all syndromic intellectual disability genes included in the SysID database. Overlap significance tested by one-sided Fisher’s exact test. ASG, alternatively spliced genes. H Metascape analysis on combined significant mis-spliced events (FDR < 0.05) in THOC6E188K/E188K and THOC6W100*/W100* NPCs.
Fig. 4
Fig. 4. Differential expression analysis in affected hNPCs.
A Venn diagram of gene overlap of THOC6 W100*/W100* and THOC6E188K/E188K affected genes and all syndromic intellectual disability genes included in the SysID database. Overlap significance tested by one-sided Fisher’s exact test. DEG, differentially expressed genes; ASG, alternatively spliced genes. B Violin plot of coding sequence (CDS) length of combined DEGs in affected cells compared to non-significant genes. NotSig, non-significant genes (dark grey); UP, upregulated (coral); DOWN, downregulated (dark blue). Significance, two-tailed unpaired t test, p = <0.0001 (****). C Violin plot of isoform number of combined DEGs in affected cells compared to non-significant genes. NotSig, non-significant genes (dark grey); UP, upregulated (coral); DOWN, downregulated (dark blue). Significance, two-tailed unpaired t test, p = 0.0373. D Percentage of gene type by condition for combined DEGs in affected hNPCs. NotSig, non-significant genes; UP, upregulated. DOWN, downregulated; lncRNA, long non-coding RNA (lavender); PP, processed pseudogene (turquoise); TUP, transcribed unprocessed pseudogene (grey); PCG, protein-coding gene (blue). E DAVID biological pathway enrichment analysis of combined upregulated genes (top, red) and downregulated genes (bottom, blue) in THOC6 affected hNPCs. F qPCR relative abundance quantifications (2-ΔΔCt) for MEG3, ESRG, MEG8, and NEAT1 in hNPCs. n = 3 experimental replicates of 3 biological replicates per genotype. Genotypes: THOC6+/+ (black), THOC6E188K/+ (dark purple), THOC6E188K/E188K (purple), THOC6W100*/+ (dark green), THOC6W100*/W100* (green). Data shown as mean ± SEM. Significance, two-tailed unpaired t test. This experiment was repeated twice independently and showed similar results. G RNA FISH probing for MEG3 and MALAT1 in affected and unaffected hNPCs. Cell inset showing MEG3 expression and localization differences with yellow arrows in merged image. Scale bar 50 μm. UNAFF, unaffected (THOC6W100*/+); AFF, affected (THOC6W100*/W100*) H Representative Western blot images (left) and protein abundance quantification (normalized to B-actin control) for validation of top downregulated (blue) and upregulated (coral) genes across genotypes. Triangles specify genotypes with E188K variant, and circles specify the W100* variant. N = 3 technical replicates per genotype (n = 6 total replicates per condition). This experiment was performed once. Source data are provided as a Source Data file.
Fig. 5
Fig. 5. Modeling of THOC6 variant pathogenesis in human cerebral organoids.
A Cerebral organoid differentiation protocol. ND, neural differentiation. B Immunostaining of PH3, N-Cadherin, apoptosis marker cleaved caspase−3 (C.CASP3), and Hoechst in day 28 human cerebral organoids differentiated from unaffected and affected iPSCs, highlighting differences in neural rosette (NR) morphology. X40 magnification; Scale bar: 50 μm. UNAFF, unaffected; AFF, affected. Representative images for UNAFF and AFF are THOC6E188K/+ and THOC6E188K/E188K, respectively. C Quantifications of NR thickness (left), NR area (middle), Hoechst+ cells per NR. UNAFF, unaffected (black; quantifications from THOC6E188K/E188K and THOC6W100*/W100*); AFF, affected (red; quantifications from THOC6E188K/+ and THOC6W100*/+). NR (organoid) biological replicates analyzed across three differentiation replicates per genotype: unaffected, n = 67 (15) biological replicates; affected, n = 34 (10) biological replicates. Data shown as mean ± SEM. Significance, two-tailed unpaired t test; p = <0.0001 (thickness), p = <0.0001 (area), p = <0.0001 (Hoescht + ). D Fraction of C.CASP3+ cells per NR for THOC6W100*/+ and THOC6E188K/+ controls and THOC6W100*/W100* and THOC6E188K/E188K affected organoids. UNAFF, unaffected (black; quantifications from THOC6E188K/E188K and THOC6W100*/W100*); AFF, affected (red; quantifications from THOC6E188K/+ and THOC6W100*/+). NR (organoid) biological replicates analyzed across three differentiation replicates per genotype: unaffected, n = 67 (15) biological replicates; affected, n = 34 (10) biological replicates. Data shown as mean ± SEM. Significance, two-tailed unpaired t test, p = <0.0001. E Immunostaining of EDU, KI67, DCX to assess timing of differentiation in day 28 organoids. Representative images for UNAFF and AFF are THOC6E188K/+ and THOC6E188K/E188K, respectively. F Quantifications for E; UNAFF, unaffected (black; quantifications from THOC6E188K/E188K and THOC6W100*/W100*); AFF, affected (red; quantifications from THOC6E188K/+ and THOC6W100*/+). NR (organoid) biological replicates analyzed across three differentiation replicates per genotype: unaffected, n = 187 (87) biological replicates; affected, n = 157 (67) biological replicates. Data shown as mean ± SEM. Significance, two-tailed unpaired t test; p = <0.0001 (KI67 + /Hoescht + ), p = 0.0121 (KI67+EdU + / EdU + ), p = 0.0008 (DCX+EdU + /EdU + ). G Growth rate of organoids across genotypes measured by cross section area (μm) from days 21-42. Genotypes: THOC6+/+ (black), THOC6E188K/+ (dark purple), THOC6E188K/E188K (purple), THOC6W100*/+ (dark green), THOC6W100*/W100* (green). H Schematic of proposed model of THOC6 pathogenesis, depicting disruption of RNA processing in human neural cells leading to impaired proliferation and differentiation timing during corticogenesis. Additionally, given ALYREF’s defined role in multimerizing several TREX complexes coating mRNPs, impaired recruitment of ALYREF to TREX complexes has implications for mRNP compaction in THOC6 LOF cells.
Fig. 6
Fig. 6. Generation of Thoc6fs/fs mouse model.
A CRISPR/Cas9 editing strategy to introduce frameshift variants in mouse Thoc6. sgRNA sequence highlighted in red text. B Representative images of isolated Thoc6+/+, Thoc6fs/+, and Thoc6fs/fs whole embryos at E9.5. Scale bar: 50 μm. C Western blot analysis with quantifications of THOC6 levels in E8.5 and E9.5 mouse embryos. β-actin, loading control. Genotypes: Thoc6+/+ (black), Thoc6fs/+ (dark red), Thoc6fs/fs (pink). Data shown as mean ± SEM. Significance, two-tailed t test, **** indicates p = <0.0001. This experiment was repeated three times independently and showed similar results. D Litter ratio analysis for E8.5–9.5 (left) and weaned (right) Thoc6fs/fs mice. Ratios are consistent with embryonic lethality of homozygous frameshift mice. Genotypes: Thoc6+/+ (black) Thoc6fs/+ (dark red), Thoc6fs/fs (pink). N = 164 mice (left); n = 27 mice (right). E Immunostaining of markers PH3 and C.CASP3 in E9.5 mouse forebrain. Illustration highlights sectioning and quantification approach. 60x magnification; Scale bar: 25 μm. F Quantifications of fractions of PAX6, PH3, and C.CASP3-expressing cells in E9.5 neuroepithelium. Measurements were combined from one rostral and one caudal section (from two lateral segments depicted by solid black boxes in E). N = 3 embryo replicates per genotype. Genotypes: Thoc6+/+ (black) and Thoc6fs/fs (pink). Data shown as mean ± SEM. Significance, two-tailed t test. Source data are provided as a Source Data file.
Fig. 7
Fig. 7. Characterization of mRNA processing defects in Thoc6fs/fs mouse E9.5 forebrain.
A Cartoon of E9.5 mouse forebrain total RNA sample preparation. B rMATS summary results of statistically significant AS events in Thoc6fs/fs E9.5 forebrain. Event type (pie chart) and inclusion status (bar chart). Yellow, higher inclusion in Thoc6fs/fs. Blue, higher inclusion in Thoc6+/+. C Quantifications from RT-PCR validating top AS events Cenpt and Admts6 (n = 2 biological replicates per genotype), and Fam214b (n = 4 biological replicates per genotype). Genotypes: Thoc6+/+ (black) and Thoc6fs/fs (pink). Data are mean ± SEM. Significance for Fam214b determined by two-tailed unpaired t test, p = 0.002. D Significant splice site strength score differences at mis-spliced events in Thoc6fs/fs samples based on maximum entropy model. Black, non-significant events. Yellow, higher inclusion in Thoc6fs/fs. Blue, higher inclusion in Thoc6+/+. Data are mean ± SEM. Significance, two-tailed unpaired t test. SE 3’ SS strength (**** indicates p = <0.0001). RI 5’ SS strength (p = 0.0079). E RT-qPCR validations of Thoc6, Wnt7a, Islr2, Ier3, Kcnt2, Anax2 mRNA abundance on two additional biological E9.5 forebrain replicates per genotype. Genotypes: Thoc6+/+ (black) and Thoc6fs/fs (pink). N = 3 experimental replicates per forebrain specimen (total of n = 6 per genotype). Data are mean ± SEM. Significance, two-tailed unpaired t test. P-values for in order of comparison (Thoc6+/+ vs. Thoc6fs/fs, Thoc6fs/+ vs. Thoc6fs/fs, Thoc6+/+ vs. Thoc6fs/+), per gene: Thoc6 (p = <0.001, 0.0061, 0.0057), Wnt7a (p = <0.001, <0.0001, 0.0132), Islr2 (p = <0.001, <0.0001, 0.0013), Anax2 (p = 0.003, 0.012, 0.0422), ler3 (p = 0.0352, p = 0.0422), Kcnt2 (p = <0.0029, 0.0014, 0.0399). This experiment was repeated twice independently and showed similar results. F DAVID analysis shows significantly enriched biological pathways among upregulated genes (top, magenta) and downregulated genes (bottom, blue) in Thoc6fs/fs E9.5 forebrain. Significance, one-sided Fisher’s Exact test. G Venn diagram of the overlap DEG in affected hNPCs and Thoc6fs/fs mouse E9.5 forebrain. Overlap significance tested by one-sided Fisher’s exact test.

Update of

Similar articles

Cited by

References

    1. Schalock RL, Luckasson R, Tassé MJ. An overview of intellectual disability: definition, diagnosis, classification, and systems of supports (12th ed.) Am. J. Intellect. Dev. Disabil. 2021;126:439–442. - PubMed
    1. Yang Y, et al. Molecular findings among patients referred for clinical whole-exome sequencing. JAMA. 2014;312:1870–1879. - PMC - PubMed
    1. Retterer K, et al. Clinical application of whole-exome sequencing across clinical indications. Genet. Med. 2016;18:696–704. - PubMed
    1. Vasudevan P, Suri M. A clinical approach to developmental delay and intellectual disability. Clin. Med. (Lond.) 2017;17:558–561. - PMC - PubMed
    1. Gieldon L, et al. Diagnostic value of partial exome sequencing in developmental disorders. PLoS One. 2018;13:e0201041. - PMC - PubMed