. 2024 Feb 22;15(1):1646.
doi: 10.1038/s41467-024-45899-4.

M2 macrophages independently promote beige adipogenesis via blocking adipocyte Ets1

Affiliations

M2 macrophages independently promote beige adipogenesis via blocking adipocyte Ets1

Suyang Wu et al. Nat Commun. .

Abstract

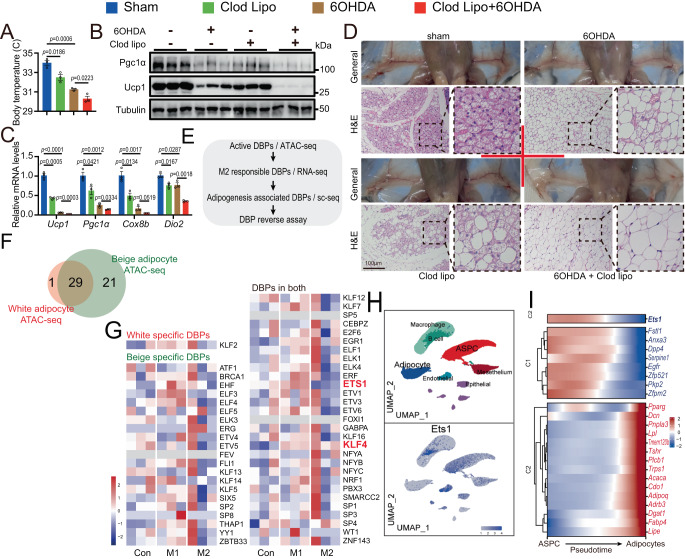
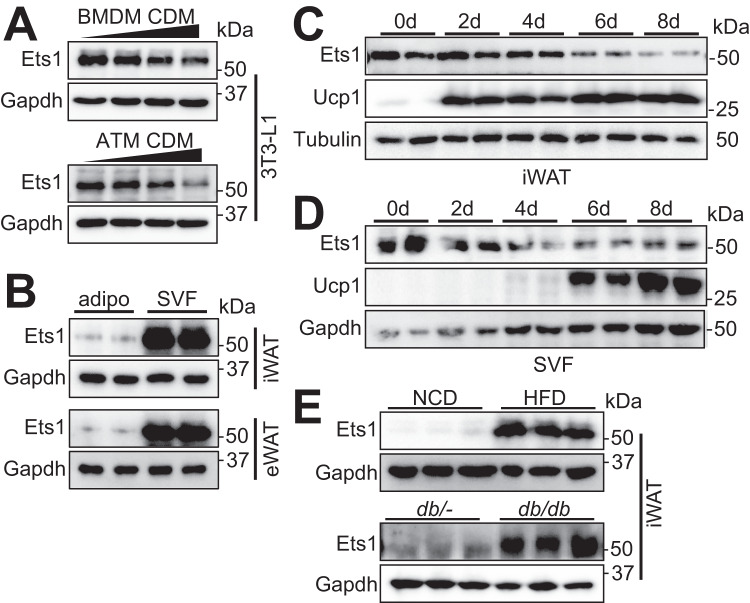
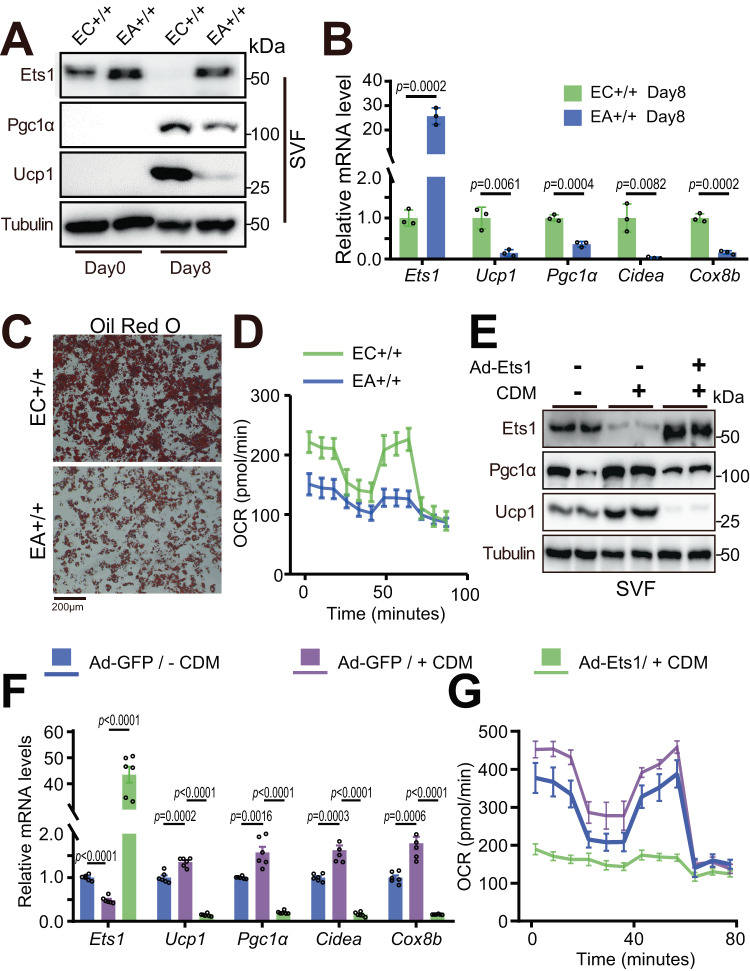
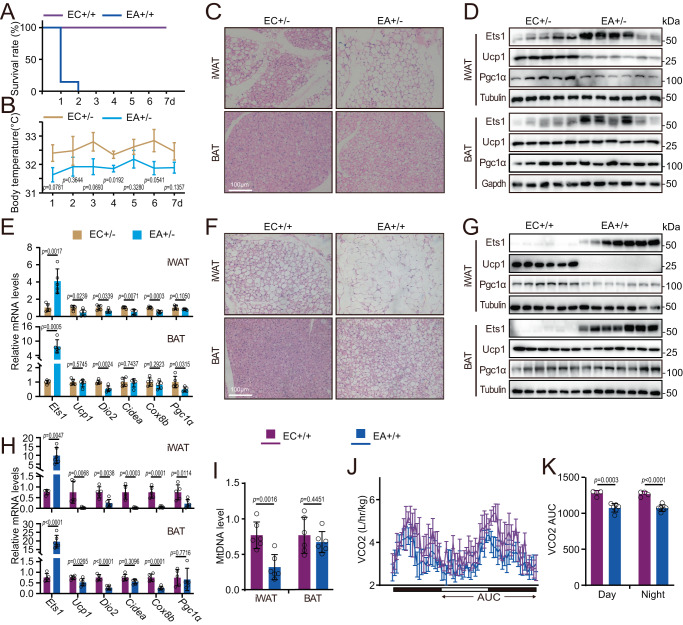
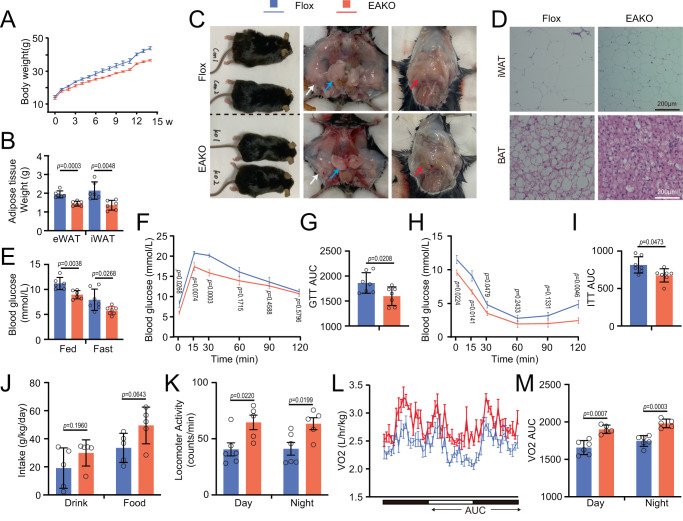
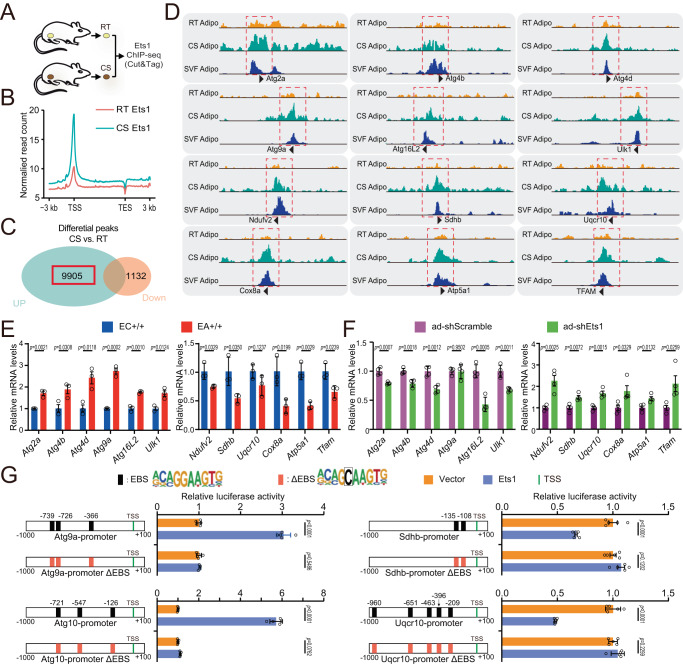
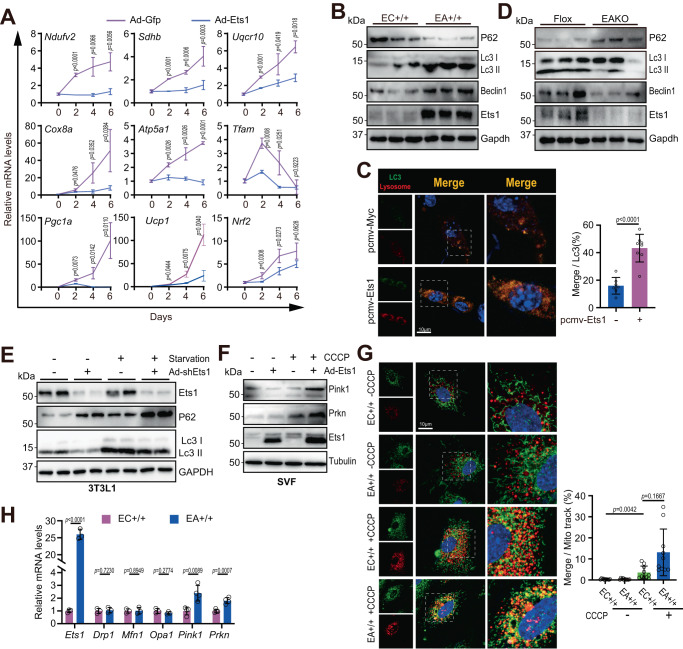
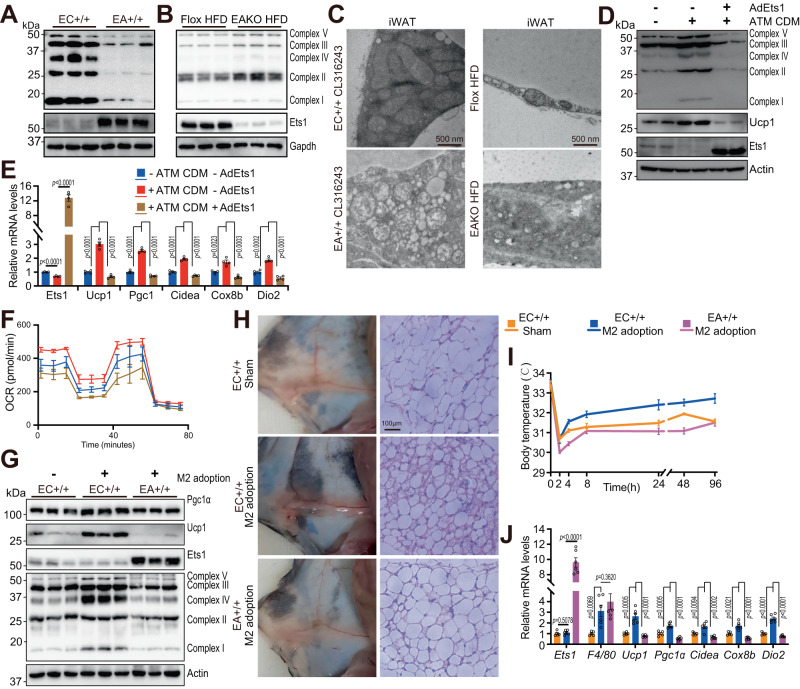
Adipose tissue macrophages can promote beige adipose thermogenesis by altering local sympathetic activity. Here, we perform sympathectomy in mice and further eradicate subcutaneous adipose macrophages and discover that these macrophages have a direct beige-promoting function that is independent of sympathetic system. We further identify adipocyte Ets1 as a vital mediator in this process. The anti-inflammatory M2 macrophages suppress Ets1 expression in adipocytes, transcriptionally activate mitochondrial biogenesis, as well as suppress mitochondrial clearance, thereby increasing the mitochondrial numbers and promoting the beiging process. Male adipocyte Ets1 knock-in mice are completely cold intolerant, whereas male mice lacking Ets1 in adipocytes show enhanced energy expenditure and are resistant to metabolic disorders caused by high-fat-diet. Our findings elucidate a direct communication between M2 macrophages and adipocytes, and uncover a function for Ets1 in responding to macrophages and negatively governing mitochondrial content and beige adipocyte formation.


Conflict of interest statement

The authors declare no competing interests.

Figures

Fig. 1
Fig. 1. Macrophages directly regulate the adipocyte beiging process independent of the sympathetic nervous system.
AD All the four group of sham (n = 3), 6-Hydroxydopamine (6OHDA) alone (n = 3), Clodronate Liposomes (Clod Lipo) alone (n = 3), and 6OHDA+Clod Lipo (n = 3) were cold stressed for 4 days, started from Day 0. A Rectal temperature measured after a 4-day cold stress. B Western blot analyzing the protein level of thermogenic marker Pgc1α and Ucp1. The experiment was repeated two times independently. C Quantitative PCR analyzing the mRNA level of beige adipose marker genes. D General morphology of inguinal white adipose tissue (iWAT) (up) and Hematoxylin and eosin (H&E) staining of iWAT (down). Scale bar: 100 μm. EI Multiple sequencing-based screening identifies Ets1 as a potential governor in M2 macrophage-adipocyte communication. E Analysis pipeline. F De novo motif analysis of the open peaks identified adipocyte-specific DNA binding proteins (DBPs). Stromal vascular fraction (SVF) separated from iWAT of wild type C57 mice was induced differentiation towards beige or white adipocyte for 7 days. The mature adipocytes were then analyzed by ATAC-seq. G The expression of the 51 uncovered DBPs were profiled, using a published RNA-seq dataset of M1 or M2 macrophage co-cultured adipocyte (GSE228094). H Analyzing the expression of Ets1 in adipose tissue, using a published single-cell transcription sequencing dataset (GSE176171). Uniform manifold approximation and projection (UMAP) and unsupervised clustering of chow diet fed mice adipose tissue were performed (up), the expression of Ets1 across these cells were profiled (down). I Pseudotime differential trajectory analysis of adipose stem and progenitor cells (ASPC) and mature adipocytes, inferred by the Slingshot method. Heatmap denoting genes that become differentially expressed during pseudotime ordering of ASPC-to- adipocyte transition. Ets1, as well as the known markers / enriched genes of mature adipocyte and ASPC were list. Data are means ± SEM. Two-sided Student’s t-test was used to evaluate statistical significance. Source data are provided as a Source Data file.
Fig. 2
Fig. 2. Adipocyte Ets1 is negatively associated with beige adipogenesis.
A 3T3-L1 cells were incubated with 0%/20%/30%/50% conditional medium (CDM) for 24 h, followed by testing the expression of Ets1 via western blot. Up: CDM of M2 bone marrow-derived macrophages (BMDM) were used; Down: CDM of adipose tissue macrophage (ATM) of mice pretreated with 48 h cold stress, were used (n = 2). B Western blot of Ets1 in mature adipocytes (adipo) and in the SVF of iWAT and epididymal white adipose tissue (eWAT) (n = 2). C Western blot showing the protein levels of Ets1 in iWAT at 0, 2, 4, 6, and 8 days after cold stress (n = 2). D SVF separated from wild type C57 was differentiated into beige adipocytes. At indicated time point after differentiation, protein level of Ets1 were analyzed by western blot (n = 2). E Western blot of Ets1 in mature adipocyte derived from iWAT. Up: High-fat diet (HFD) and normal chow diet (NCD) feedings were started at 4 weeks of age and continued for 16 weeks. Down: db/- and db/db mice were 8–10 weeks old. N = 3 for each group. All blot assay was repeated two times independently.
Fig. 3
Fig. 3. M2 macrophage directly activates adipocytes thermogenesis via blocking Ets1.
AD SVF cells separated from iWAT of either Ets1ki/ki mice (abbreviated as EC+/+) or adipoq-cre × Ets1 ki/ki mice (abbreviated as EA+/+) were cultured in vitro and induced to differentiate into beige adipocytes. A Western blot assay testing the protein levels of Ets1, Pgc1α, and Ucp1, before (Day 0) or after beige adipogenesis (Day 8) (n = 3). B qPCR analyzing the thermogenic marker genes of differentiated beige adipocyte (n = 3). C Oil red O staining of lipid droplets of differentiated beige adipocyte (n = 3). Scale bar: 200 μm. D Oxygen consumption rate (OCR) of differentiated beige adipocyte (n = 8). EG SVFs separated from iWAT of wild type C57 mice were cultured in vitro. The plate-fully-covered cells were infected with indicate adenovirus for 6 h, then induced differentiation towards beige adipocytes. 5 days later, the cells were treated with 50% M2 CDM for 24 h. E Western blot showing the protein levels of Ets1 and thermogenic markers (n = 2). F Quantitative PCR showing the mRNA levels of Ets1 and thermogenic markers (n = 3). G OCR measured at Day 6 (n = 16). All blot assay was repeated two times independently. Data are means ± SEM. Two-sided Student’s t-test was used to evaluate statistical significance. Source data are provided as a Source Data file.
Fig. 4
Fig. 4. Adipocyte-specific Ets1 knock-in mice are cold intolerance.
A Daily survival rate of EC+/+ (n = 6) and EA+/+ (n = 7) mice after a 4 °C cold stress. BE Heterozygous Ets1 adipocyte knock-in mice (EA+/-: adipoq-cre × Ets1ki/-) (n = 5) with their control littermates (EC+/-: Ets1ki/-) (n = 6) were treated with a 4 °C cold stress for 7 days. B Rectal temperature during cold stress assay. C H&E staining of iWAT and brown adipose tissue (BAT) sections. Scale bar: 100 μm. D Western blot assay analyzing Ets1, together with the thermogenic markers Ucp1 and Pgc1α. E qPCR testing Ets1, and thermogenic fat marker genes. FI Beige adipogenesis was induced in EC+/+ (n = 6) and EA+/+ (n = 7) mice by daily intraperitoneal injections of 1 mg/kg Cl316243 for 7 days. F H&E staining of iWAT and BAT sections. Scale bar: 100 μm. G Western blot assay analyzing Ets1, together with the thermogenic markers Ucp1 and Pgc1α. H qPCR testing Ets1, and thermogenic fat marker genes. I The mitochondrial DNA (mtDNA) levels of iWAT (left) and BAT (right) in EC+/+ and EA+/+ mice. J, K EC+/+ (n = 4) and EA+/+ (n = 6) were intraperitoneally treated with Cl316243 for 7 days. On day 5, the mice were transferred into the home-cage system, and metabolic parameters from day 7 to day 9 were analyzed. The black and white bars represent night and day, respectively, and the arrow areas were calculated. J Carbon dioxide generation. K Calculated area under the curve (AUC) of J. All blot assay was repeated two times independently. Data are means ± SEM. Two-sided Student’s t-test was used to evaluate statistical significance. Source data are provided as a Source Data file.
Fig. 5
Fig. 5. Adipocyte Ets1 knock-out mice are resistant to HFD-induced obesity.
Ets1 f/f (Flox) and adipocyte-specific knock-out (EAKO) mice at the age of 4-5 weeks were fed a high-fat diet (HFD) for 14 weeks. A Body weight curves during HFD feeding (n = 6 per group). B Adipose tissue weight (n = 6 per group). C General morphology of the mouse bodies and fat pads. Red arrow, BAT; white arrow, iWAT; blue arrow, eWAT. D H&E staining of iWAT and BAT sections. Scale bar: 200 μm. E The random and fasting (14 h) blood glucose levels (n = 6 for random, n = 7 for fasting). F Glucose tolerance test (GTT) assay (n = 7 per group). G Calculated AUC of F. H Insulin tolerance test (ITT) assay (n = 7 per group). I Calculated AUC of H. JM After 14 weeks of HFD feeding, the metabolic parameters of Flox and EAKO mice were analyzed using a home-cage system. The black and white bars represent night and day, respectively, and the arrow areas were calculated. J Daily food intake (n = 5 per group). K Daily locomotor activity (n = 6 for Flox, n = 5 for EAKO). L Oxygen consumption level (n = 6 for Flox, n = 5 for EAKO). M The calculated AUC of L. Data are means ± SEM. Two-sided Student’s t-test was used to evaluate statistical significance. Source data are provided as a Source Data file.
Fig. 6
Fig. 6. Ets1 transcriptionally suppresses mitochondrial coding genes and activates autophagy-related genes.
A Wild type 8- to 10-week-old C57/BL6j mice were kept either at room temperature (RT) or under cold stress (CS) for 7 days. Mature adipocytes separated from iWAT were used for ChIP-seq (Cut & Tag). B Normalized read count (average of reads signals across all genes) across gene body. C Venn diagram of peaks. D The IGV tool was used to visualize the binding peaks of Ets1 on the promoter region of autophagy-related and mitochondrial genes. Another Ets1 ChIP-seq that using SVF derived beige adipocyte were conducted and together analyzed (SVF adipo). E qPCR testing of the mRNA level of autophagy-related (left) and mitochondrial (right) genes, in the iWAT of 8- to 10-week-old EC+/+ or EA+/+ mice (n = 3 per group). F qPCR testing of the mRNA levels of autophagy-related (left) and mitochondrial (right) genes in 3T3L1 cells. Undifferentiated 3T3L1 cells were infected with either ad-Scramble or ad-shEts1 adenovirus; 48 h later, mRNA was collected and analyzed (n = 4 per group). G Promoter plasmid construction and the relative luciferase activity. Promoter regions of the mitochondrial clearance genes Atg9a and Atg10 and the biogenesis genes Sdhb and Uqcr10 were cloned, and the core sequence “GGA” in the predicted Ets1 binding sequence (EBS, black box) were point mutated to “GCA” (ΔEBS, red box). Promoter, Ets1 expression plasmid/vectors were co-transfected into 293 T cells, and luciferase activity was tested 24 h later (n = 5 per group). Data are means ± SEM. Two-sided Student’s t test was used to evaluate statistical significance. Source data are provided as a Source Data file.
Fig. 7
Fig. 7. Ets1 blocks mitochondria biogenesis and promotes its clearance.
A qPCR testing of the mRNA levels of Ets1-targeted genes, together with beige marker genes (n = 3 per group). SVFs derived from iWAT of C57 mice were infected with corresponding adenovirus. Beige adipogenesis was induced 24 h later (deemed day 0). B Western blot analysis of autophagy flux in mature adipocytes derived from iWAT of EA+/+ mice, in comparison with control littermates (n = 3 per group). C Representative immunofluorescence showing LC3 and lysosomes. 3T3L1 cells were transfected with pcmv-Vector (n = 7) or pcmv-Ets1 plasmid (n = 8), followed by eGFP-LC3-lysosome adenovirus infection. The ratio of Merge/Lc3 area were calculated (right). Scale bar: 10 μm. D Western blot analysis of autophagy flux in mature adipocytes derived from iWAT of EAKO mice, in comparison with control littermates (n = 3 per group). E Western blot analysis of autophagy in 3T3L1 cells (n = 2). Cells were infected with indicated adenovirus; 48 h later, the medium was changed to low fetal bovine serum (FBS) (0.5%, starvation) or fresh normal FBS (10%), and cultured for another 24 h. F Western blot testing the protein levels of Pink1, Prkn, and Ets1 (n = 3). SVFs were infected with or without ad-Ets1 adenovirus and analyzed 48 h later. Before sample collection, the cells were treated with 0 or 20 μM carbonyl cyanide 3-chlorophenylhydrazone (CCCP) for 3 h to activate mitophagy. G Representative images of Mito-track immunofluorescence and lysosomes in beige adipocytes. SVFs were separated from iWAT of indicated mice and differentiated into beige adipocytes for 48 h. Photographs were taken after CCCP stimulation for another 3 h. Nuclei were stained with Hoechst. The corresponding Merge/Mito-track rates are shown (right). Each group included three biological replicates, and a total of 10 photographs were taken for statistical analysis. Scale bar: 10 μm. H qPCR testing of the mRNA levels of mitochondrial dynamic genes in mature adipocytes derived from iWAT of EC+/+ and EA+/+ mice. N = 3 per group for Ets1, Drp1, Mfn1, Opa1, n = 4 per group for Pink1 and Prkn. All blot assay was repeated two times independently. Data are means ± SEM. Two-sided Student’s t-test was used to evaluate statistical significance. Source data are provided as a Source Data file.
Fig. 8
Fig. 8. M2 macrophage boosts adipocyte mitochondria content via blocking Ets1.
Western blot analysis of mitochondrial oxidative respiratory chain (OXPHOS) in mature adipocytes derived from in iWAT of Ets1 adipocyte knock-in (A) and knock-out mice (EAKO) (B), in comparison with corresponding control littermates (n = 3 per group). C Transmission electron microscopy showing the structure of mitochondria. Left, iWAT samples were separated from EC+/+ and EA+/+ mice, after 7 days of Cl316243 treatment; Right, iWAT samples separated from Flox and EAKO mice, after 14 weeks of HFD feeding. N = 3 per group. Scale bar: 500 nm. DSVFs separated from iWAT of wild type C57 mice were cultured in vitro. The plate-fully-covered cells were infected with indicate adenovirus for 6 h, then induced differentiation towards beige adipocytes. 5 days later, the cells were treated with 50% ATM CDM for 24 h. D Western blot analysis of the level of OXPHOS, Ets1, and Ucp1 (n = 2). E Quantitative PCR showing the mRNA levels of Ets1 and thermogenic markers (n = 4). F OCR measured at Day 6 (n = 6). GJ M2 BMDM were adopted in both side of iWAT, either in EC+/+ or EA+/+ mice. After 6OHDA induced SNS ablation, all mice were then treated with a 4-day cold stress. N = 5 for sham group, n = 6 for adoption group. G Western blot analysis of the level of OXPHOS, Ets1, and Ucp1. H General morphology of iWAT (left) and H&E staining of iWAT (right). Scale bar: 100 μm. I Rectal temperature measured during old stress. EC+/+ M2 adoption VS. EC+/+ Sham, p = 0.6554/0.9632/0.0138/0.0298/0.0159/0.0171/0.0030 for 0/2/4/8/24/48/96 h; EA+/+ M2 adoption VS. EC+/+ M2 adoption, p = 0.7173/0.0167/0.0001/0.0028/0.0133/0.0001/0.0023 for 0/2/4/8/24/48/96 h; J qPCR testing Ets1, macrophage marker F4/80, and thermogenic fat marker genes. All blot assay was repeated two times independently. Data are means ± SEM. Two-sided Student’s t-test was used to evaluate statistical significance. Source data are provided as a Source Data file.

Similar articles

Cited by

References

    1. Cypess AM, et al. Identification and importance of brown adipose tissue in adult humans. N. Engl. J. Med. 2009;360:1509–1517. doi: 10.1056/NEJMoa0810780. - DOI - PMC - PubMed
    1. van Marken Lichtenbelt WD, et al. Cold-activated brown adipose tissue in healthy men. N. Engl. J. Med. 2009;360:1500–1508. doi: 10.1056/NEJMoa0808718. - DOI - PubMed
    1. Virtanen KA, et al. Functional brown adipose tissue in healthy adults. N. Engl. J. Med. 2009;360:1518–1525. doi: 10.1056/NEJMoa0808949. - DOI - PubMed
    1. Wu J, Cohen P, Spiegelman BM. Adaptive thermogenesis in adipocytes: is beige the new brown? Genes Dev. 2013;27:234–250. doi: 10.1101/gad.211649.112. - DOI - PMC - PubMed
    1. Ye L, et al. Fat cells directly sense temperature to activate thermogenesis. Proc. Natl Acad. Sci. USA. 2013;110:12480–12485. doi: 10.1073/pnas.1310261110. - DOI - PMC - PubMed

Substances