. 2024 Feb 23;14(1):4422.
doi: 10.1038/s41598-024-53515-0.

A novel ferroptosis-related gene signature for overall survival prediction in patients with gastric cancer

Affiliations

A novel ferroptosis-related gene signature for overall survival prediction in patients with gastric cancer

Fang Wen et al. Sci Rep. .

Abstract

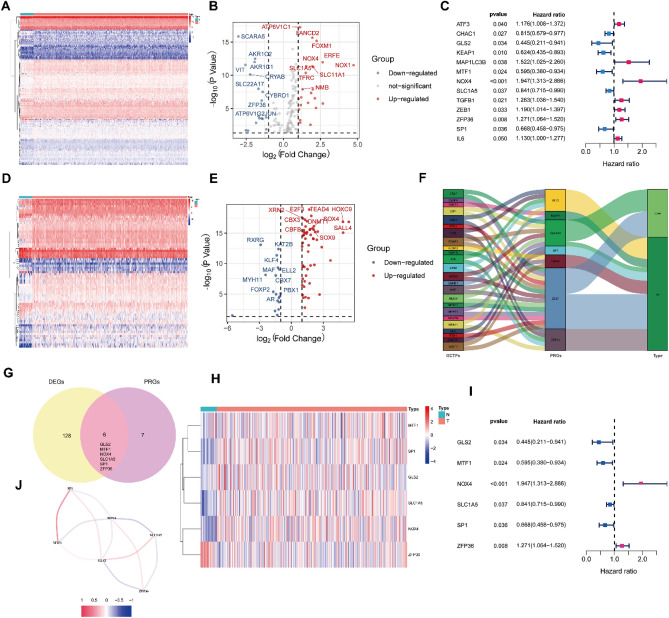
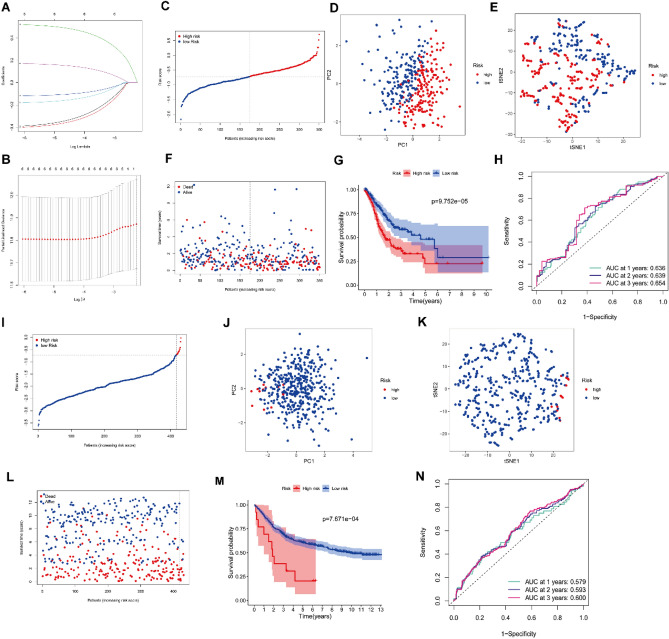
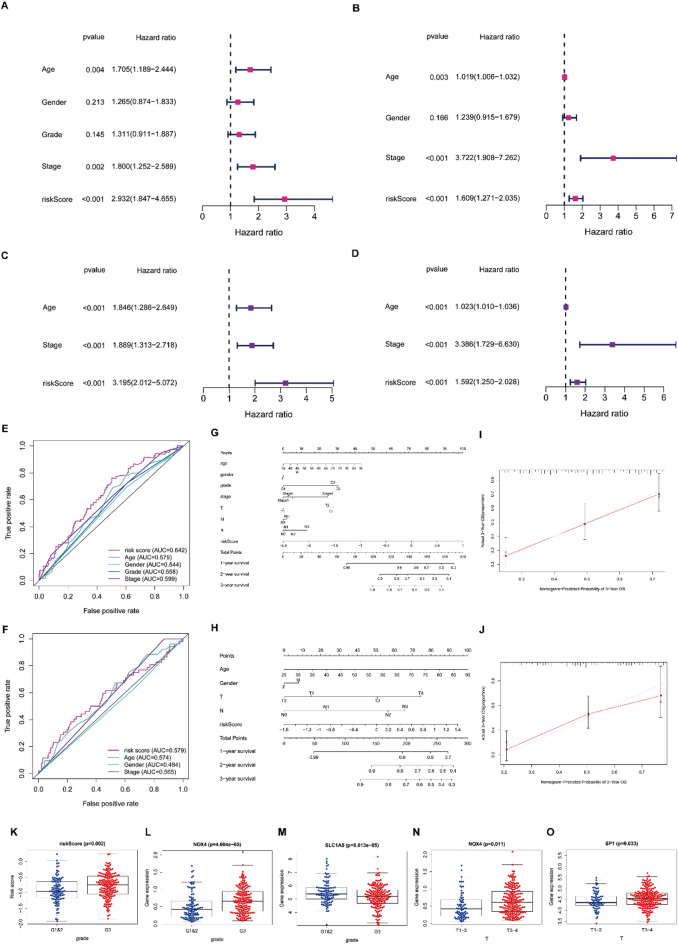
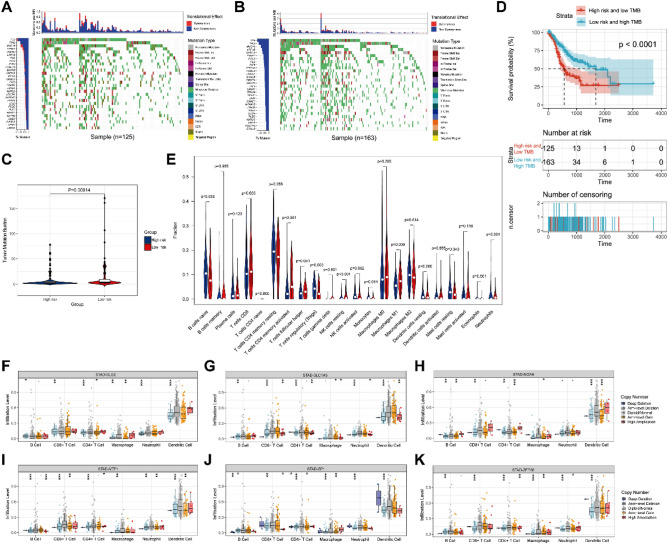
The global diagnosis rate and mortality of gastric cancer (GC) are among the highest. Ferroptosis and iron-metabolism have a profound impact on tumor development and are closely linked to cancer treatment and patient's prognosis. In this study, we identified six PRDEGs (prognostic ferroptosis- and iron metabolism-related differentially expressed genes) using LASSO-penalized Cox regression analysis. The TCGA cohort was used to establish a prognostic risk model, which allowed us to categorize GC patients into the high- and the low-risk groups based on the median value of the risk scores. Our study demonstrated that patients in the low-risk group had a higher probability of survival compared to those in the high-risk group. Furthermore, the low-risk group exhibited a higher tumor mutation burden (TMB) and a longer 5-year survival period when compared to the high-risk group. In summary, the prognostic risk model, based on the six genes associated with ferroptosis and iron-metabolism, performs well in predicting the prognosis of GC patients.


Conflict of interest statement

The authors declare no competing interests.

Figures

Figure 1
Figure 1
Identification the prognostic ferroptosis- and iron metabolism-related differentially expressed genes in GC. (A) Heatmap exhibited the expression levels of the DEGs between normal tumor and tissue. (B) Volcano plot of DEGs. (C) Forest plot showed the PRGs were associated with OS. (D) Heatmap exhibited the expression levels of the GCTFs between normal tumor and tissue. (E) Volcano plot of GCTFs. (F) Sankey plot of GCTFs and PRGs represented the regulatory network. (G) Venn diagram to determine the PRDEGs by intersecting DEGs and PRGs. (H) Heatmap exhibited the expression levels of the PRDEGs between normal tumor and tissue. (I) Forest plot showed the PRDEGs were associated with OS. (J) The correlation network of PRDEGs.
Figure 2
Figure 2
Prognostic analysis of the 6-gene prognostic risk model. (A,B) LASSO-penalized Cox regression analysis identified the 6-gene signature closely correlated with OS. (C) The distribution and the risk score median value of the TCGA cohort. (D) PCA analysis of the prognostic risk model in the TCGA cohort. (E) t-SNE analysis of the prognostic risk model in the TCGA cohort. (F) The distribution of the risk score and survival status in the TCGA cohort. (G) Survival analysis for GC patients of the different risk groups in the TCGA cohort. (H) AUC of time-dependent ROC curves assessed the prognostic sensitivity of the prognostic risk model in the TCGA cohort. (I) The distribution and the risk score median value of the GEO cohort. (J) PCA analysis of the prognostic risk model in the GEO cohort. (K) t-SNE analysis of the prognostic risk model in the GEO cohort. (L) The distribution of the risk score and survival status in the GEO cohort. (M) Survival analysis for GC patients of the different risk groups in the GEO cohort. (N) AUC of time-dependent ROC curves assessed the prognostic sensitivity of the prognostic risk model in the GEO cohort.
Figure 3
Figure 3
Independent prognostic performance of the prognostic risk model. (A) Forest plot visualizing the results of the univariate Cox regression analysis in the TCGA cohort. (B) The results of the univariate Cox regression analysis were verified in the GEO cohort. (C) Forest plot visualizing the results of the multivariate Cox regression analysis in the TCGA cohort. (D) The results of the multivariate Cox regression analysis were verified in the GEO cohort. (E) The ROC curves of the risk score and clinical indicators in TCGA cohorts. (F) The ROC curves of the risk score and clinical indicators in GEO cohorts. (G) The nomogram for predicting the survival time of GC patients at 1, 2, and 3 years in the TCGA cohort. (H) The nomogram for predicting the survival time of GC patients at 1, 2, and 3 years in the GEO cohort. (I) The calibration curves of the nomograms for survival time prediction at 3 years in the TCGA cohort. (J) The calibration curves of the nomograms for survival time prediction at 3-year in the GEO cohort. (K–O) The correlation between the PRDEGs and clinical indicators in TCGA cohort.
Figure 4
Figure 4
The association between risk score and TMB and the landscape of immune infiltration of TMB. (A) The profile of TMB in the high-risk group. (B) The profile of TMB in the low-risk group. (C) The number of TMB in the different risk groups. (D) K-M survival curve visualizing the differences in OS rates between the high TMB group and low TMB group. (E) The infiltrating levels of 22 immune cell types in different TMB groups. Blue indicated low TMB group and red indicated high TMB group. (F–K) Effect of somatic CNA of the 6-gene signature on the Immune Cell Infiltration. *P < 0.05, **P < 0.01, and ***P < 0.001.
Figure 5
Figure 5
Functional enrichment analysis. (A) GO enrichment analysis of the DEGRGs in the TCGA cohort. The top 10 terms were displayed. (B) KEGG pathways analysis of the DEGRGs in the TCGA cohort. The top 10 pathways were displayed. (C,D) GSEA analysis on GO and KEGG in the TCGA cohort. (E) GO enrichment analysis of the DEGRGs in the GEO cohort. The top 10 terms were displayed. (F) KEGG pathways analysis of the DEGRGs in the GEO cohort. The top 10 pathways were displayed. (G,H) GSEA analysis on GO and KEGG in the GEO cohort.
Figure 6
Figure 6
Correlation analysis of the prognostic risk model TIME of GC. (A) Comparison of the ssGSEA scores of diverse immune cells between the two risk groups in the TCGA cohort. (B) Differences of the ssGSEA scores of immune-related functions between the two risk groups in the TCGA cohort. (C) Comparison of the ssGSEA scores of diverse immune cells between the two risk groups in the GEO cohort. (D) Differences of the ssGSEA scores of immune-related functions between the two risk groups in the GEO cohort. (E–J) Immune cells with significant correlation with the risk score in GC patients. (K–P) Correlation analysis of the expression levels of PRDEGs and immune cell infiltration in GC patients. *P < 0.05, **P < 0.01, and ***P < 0.001.
Figure 7
Figure 7
Validation the expression of the PRDEGs in cells. (A–F) Validation the expression of the PRDEGs in normal (GES-1) and GC cell lines. (G) The box plot of PRDEGs expression in TCGA. *P < 0.05, **P < 0.01, and ***P < 0.001.
Figure 8
Figure 8
Expression of the PRDEGs. (A) The mRNA expression levels of the PRDEGs in GC and normal gastric tissue (*P < 0.05). Red represents GC and gray represents normal gastric tissue. (B) The representative protein expression of the PRDEGs in GC and normal gastric tissue.

Similar articles

Cited by

References

    1. Bray F, et al. Global cancer statistics 2018: GLOBOCAN estimates of incidence and mortality worldwide for 36 cancers in 185 countries. CA Cancer J. Clin. 2018;68:394–424. doi: 10.3322/caac.21492. - DOI - PubMed
    1. Wang J, et al. Pretreatment platelet-to-lymphocyte ratio is associated with the response to first-line chemotherapy and survival in patients with metastatic gastric cancer. J. Clin. Lab. Anal. 2017;32:22185. doi: 10.1002/jcla.22185. - DOI - PMC - PubMed
    1. Tan YK, Fielding JWL. Early diagnosis of early gastric cancer. Eur. J. Gastroenterol. Hepatol. 2006;18:821–829. doi: 10.1097/00042737-200608000-00004. - DOI - PubMed
    1. Chen S, Li T, Zhao Q, Xiao B, Guo J. Using circular RNA hsa_circ_0000190 as a new biomarker in the diagnosis of gastric cancer. Clin. Chim. Acta. 2017;466:167–171. doi: 10.1016/j.cca.2017.01.025. - DOI - PubMed
    1. Li P, et al. Circular RNA 0000096 affects cell growth and migration in gastric cancer. Br. J. Cancer. 2017;116:626–633. doi: 10.1038/bjc.2016.451. - DOI - PMC - PubMed