. 2024 Feb 22;15(1):1617.
doi: 10.1038/s41467-024-45473-y.

Porphyromonas gingivalis aggravates colitis via a gut microbiota-linoleic acid metabolism-Th17/Treg cell balance axis

Affiliations

Porphyromonas gingivalis aggravates colitis via a gut microbiota-linoleic acid metabolism-Th17/Treg cell balance axis

Lu Jia et al. Nat Commun. .

Abstract

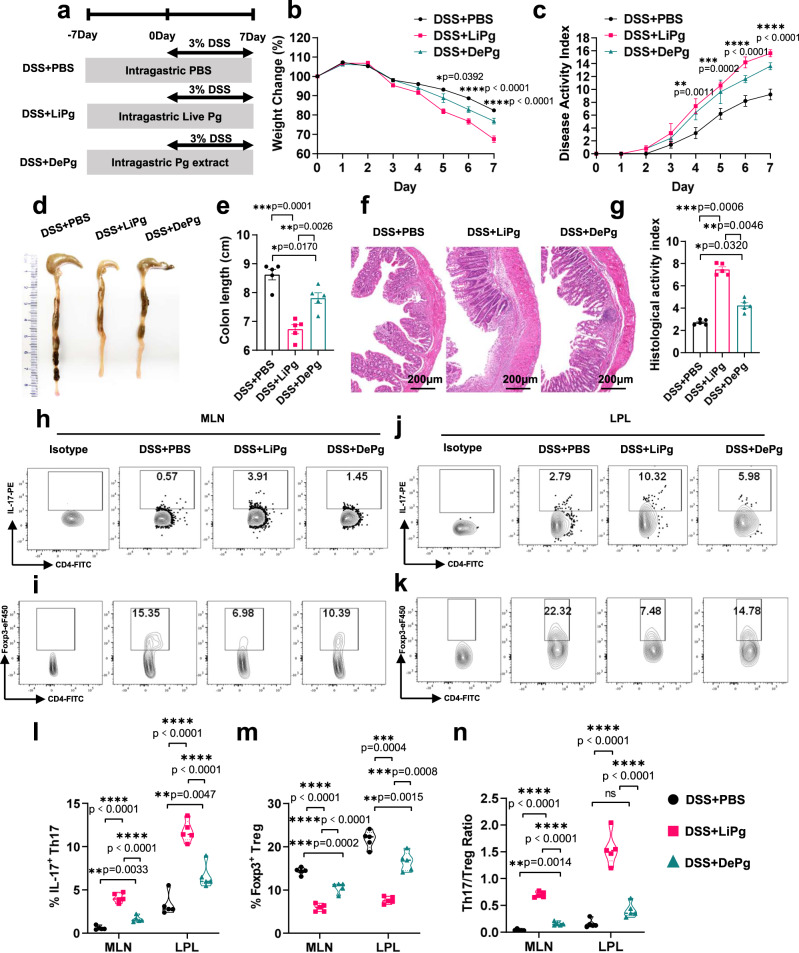
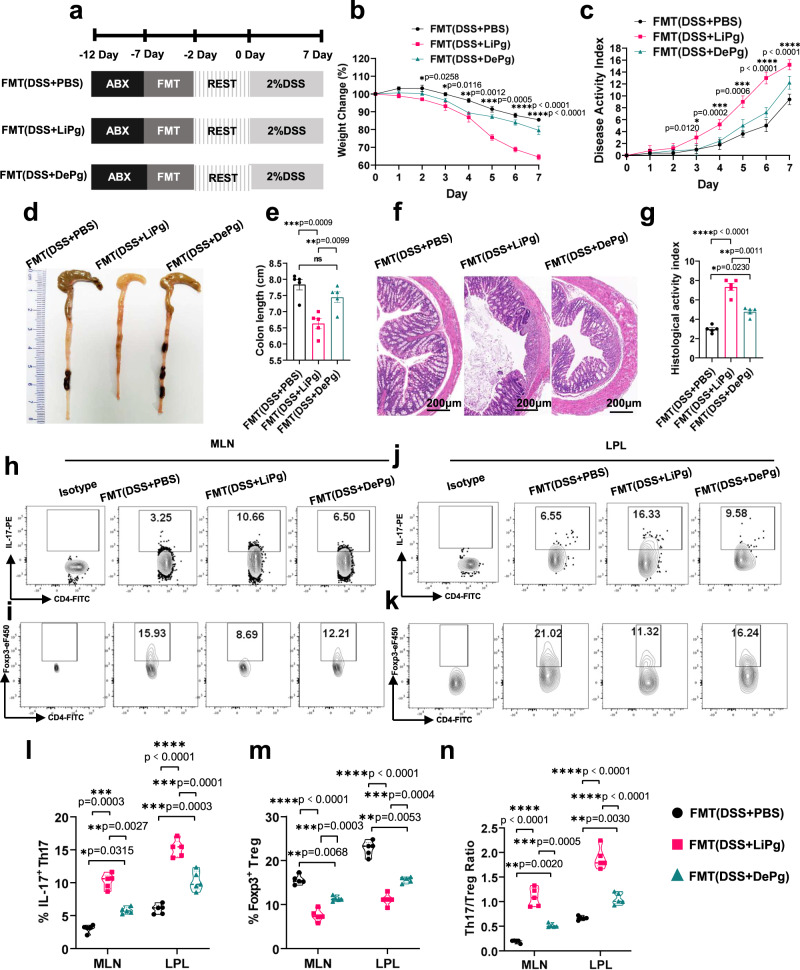
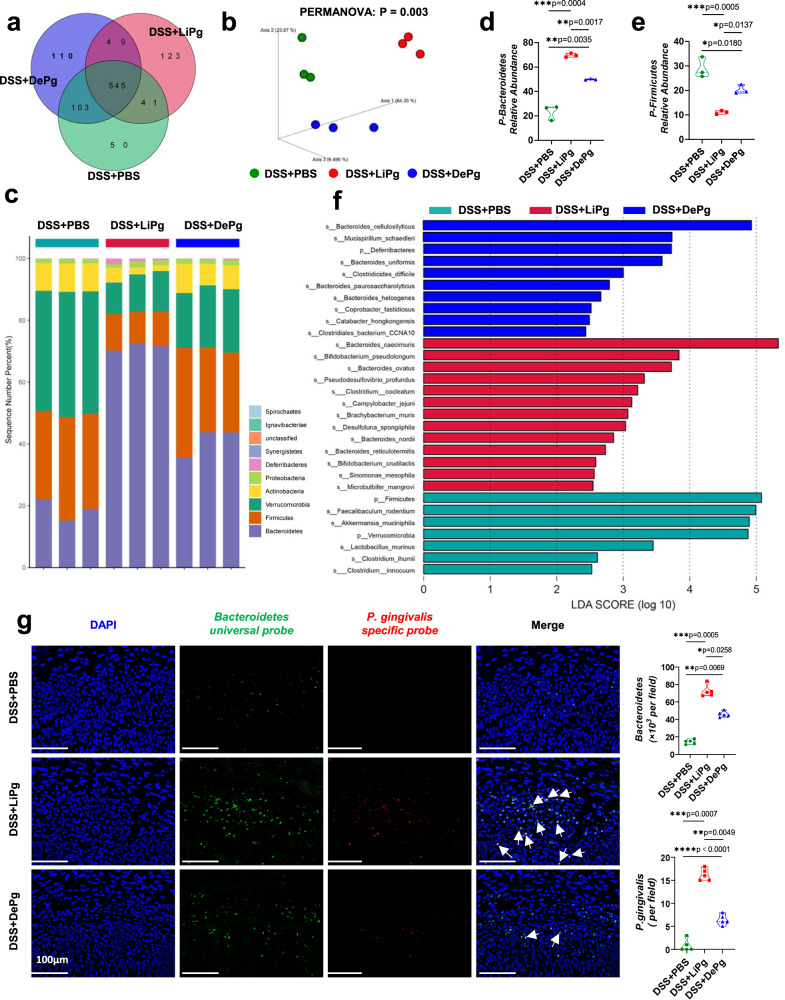
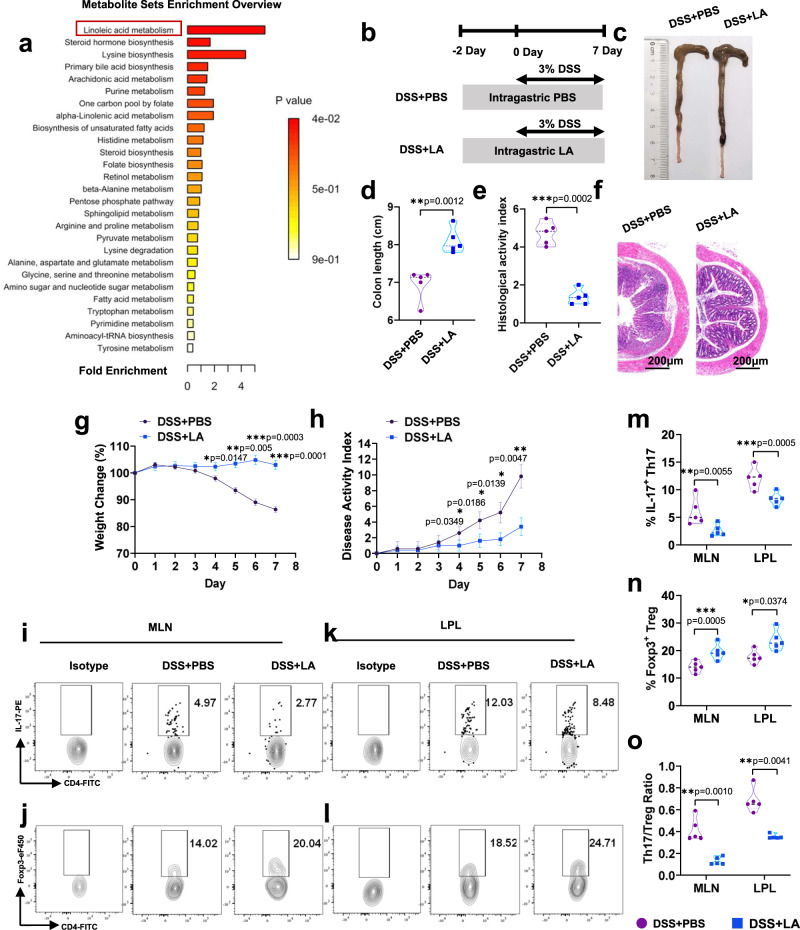
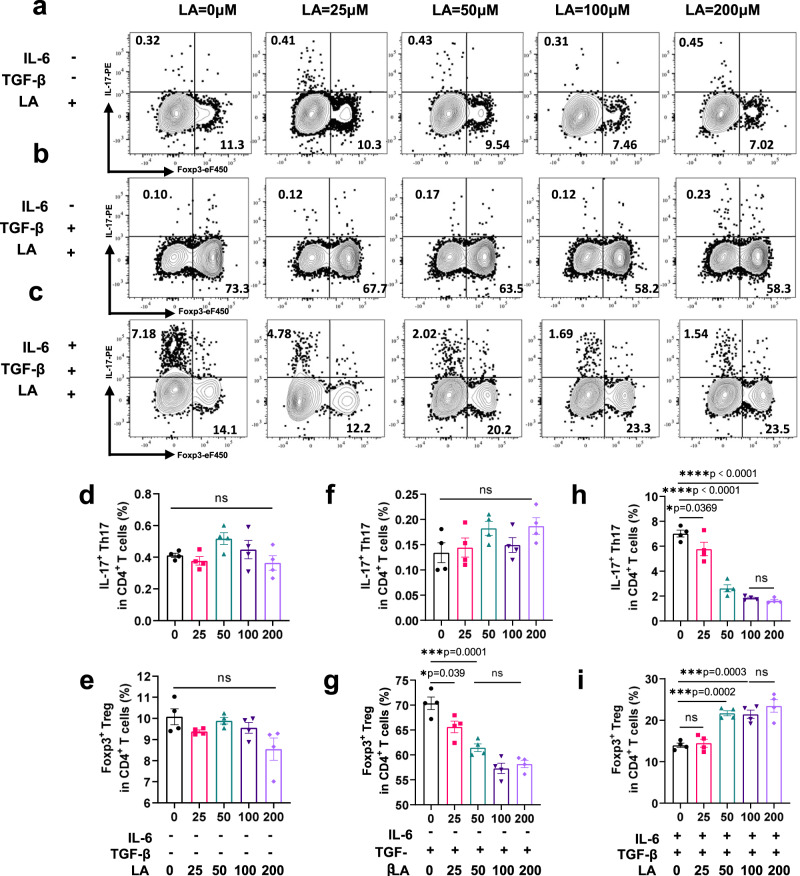
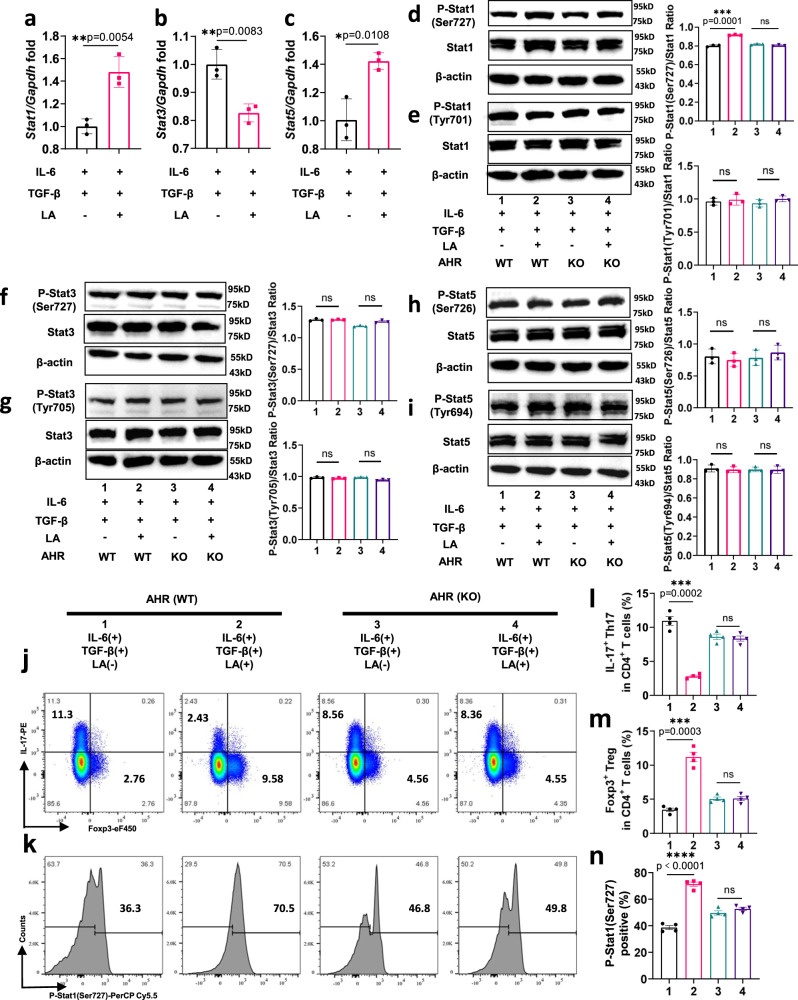
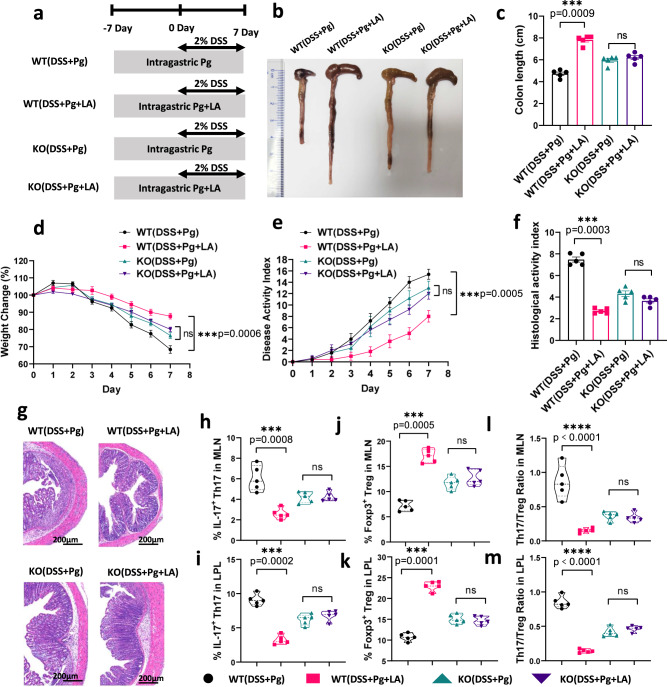
Periodontitis is closely related to inflammatory bowel disease (IBD). An excessive and non-self-limiting immune response to the dysbiotic microbiome characterizes the two. However, the underlying mechanisms that overlap still need to be clarified. We demonstrate that the critical periodontal pathogen Porphyromonas gingivalis (Pg) aggravates intestinal inflammation and Th17/Treg cell imbalance in a gut microbiota-dependent manner. Specifically, metagenomic and metabolomic analyses shows that oral administration of Pg increases levels of the Bacteroides phylum but decreases levels of the Firmicutes, Verrucomicrobia, and Actinobacteria phyla. Nevertheless, it suppresses the linoleic acid (LA) pathway in the gut microbiota, which was the target metabolite that determines the degree of inflammation and functions as an aryl hydrocarbon receptor (AHR) ligand to suppress Th17 differentiation while promoting Treg cell differentiation via the phosphorylation of Stat1 at Ser727. Therapeutically restoring LA levels in colitis mice challenged with Pg exerts anti-colitis effects by decreasing the Th17/Treg cell ratio in an AHR-dependent manner. Our study suggests that Pg aggravates colitis via a gut microbiota-LA metabolism-Th17/Treg cell balance axis, providing a potential therapeutically modifiable target for IBD patients with periodontitis.


Conflict of interest statement

All authors declare no competing interests.

Figures

Fig. 1
Fig. 1. Oral administration of Pg aggravated colitis.
a The experimental design. Pg is the key pathogen of periodontitis. A DSS-induced colitis model was established. Colitis mice were gavaged with live Pg (DSS+LiPg) or ultrasonic fragmentation extract of Pg (DSS+DePg). b Body weight of DSS + PBS, DSS+LiPg, and DSS+DePg mice during DSS-induced colitis, n = 5 biologically independent samples. cg Disease activity index (DAI) (c), colon length (d, e), and histological score (f, g) of DSS + PBS, DSS + LiPg, and DSS + DePg mice on day 8 after DSS induction, n = 5 biologically independent samples. Scale bar, 200 μm. hk The proportions of IL-17+ Th17 cells and Foxp3+ Treg cells and their ratio among total CD4+ T cells within the MLNs and LPLs were detected by flow cytometry and statistically analysed (ln), n = 5 biologically independent samples. Data are presented as the mean ± SEM; *p < 0.05; **p < 0.01; ***p < 0.001 by two-tailed one-way ANOVA. Pg Porphyromonas gingivalis, MLN mesenteric lymph node cells, LPL colon lamina propria lymphocytes, ANOVA analysis of variance, DSS dextran sodium sulfate. Source data are provided as a Source Data file.
Fig. 2
Fig. 2. Oral administration of Pg exacerbated colonic Th17/Treg cell imbalance in a gut microbiota-dependent manner.
a Diagram of the gut microbiota transplantation experiment. ABX: antibiotic cocktail. FMT: faecal microorganism transplantation. Transplantation of mouse faeces from the DSS + PBS/LiPg/DePg group into recipient mice→the FMT (DSS + PBS/LiPg/DePg) group. b Body weight of FMT (DSS + PBS), FMT (DSS+LiPg), and FMT (DSS+DePg) mice during DSS-induced colitis, n = 5 biologically independent samples. cg Disease activity index (DAI) (c), colon length (d, e), and histological score (f, g) of FMT (DSS + PBS), FMT (DSS+LiPg), and FMT (DSS+DePg) mice on day 8 after DSS induction, n = 5. Scale bar, 200 μm. hk The proportions of IL-17+ Th17 cells and Foxp3+ Treg cells and their ratio among total CD4+ T cells within the MLNs and LPLs were detected by flow cytometry and statistically analysed (ln), n = 5 biologically independent samples. Data are presented as the mean ± SEM; *p < 0.05; **p < 0.01; ***p < 0.001; ****p < 0.0001 by two-tailed one-way ANOVA. Pg Porphyromonas gingivalis, MLN mesenteric lymph node cells, LPL colon lamina propria lymphocytes, ANOVA analysis of variance, DSS dextran sodium sulfate. Source data are provided as a Source Data file.
Fig. 3
Fig. 3. Oral administration of Pg altered the gut microbiota composition.
a High-throughput metagenomic sequencing of the faecal bacterial genome from DSS + PBS, DSS+LiPg, and DSS+DePg mice. n = 3. The number of common or unique species among different groups in the Venn diagram. b 3D PCoA graph based on the Bray-Curtis distance matrix. PERMANOVA: F = 20.208, two-sided P value = 0.003. PERMANOVA: permutational multivariate analysis of variance. c Column diagram of the relative distribution of each sample at the phylum level (top 10). The Y-axis is the sequence number percent, indicating the ratio of this phylum level to the total annotation data. d, e The box plots indicate the top 2 relative abundances of each bacterial group at the phylum level (Bacteroidetes and Firmicutes). f The most differentially abundant taxa of characteristic microorganisms from DSS + PBS, DSS + LiPg, and DSS + DePg mice (LDA Sore = 4 by LEfSe). LDA Score: linear discriminant analysis score. g FISH of colonic lumen sections from DSS + PBS, DSS + LiPg, and DSS + DePg mice: Bacteroidetes universal probe (green), P. gingivalis-specific probe (red), and DAPI (blue). Scale bar, 100 μm. At least five sections per group were analysed. Data are presented as the mean ± SEM; *p < 0.05; **p < 0.01; ***p < 0.001; ****p < 0.0001 by two-tailed one-way ANOVA with two-sided p value. Source data are provided as a Source Data file.
Fig. 4
Fig. 4. Linoleic acid (LA) is the critical gut metabolite of dietary Pg in colitis mice and decreases the Th17/Treg cell balance.
a Enrichment analysis of the gut microbiota metabolic pathway from DSS + PBS, DSS + LiPg, and DSS + DePg mice based on untargeted LC‒MS/MS. n = 3 biologically independent samples. b The experimental design. A DSS-induced colitis model was established. Colitis mice were administered PBS (DSS + PBS) or linoleic acid (DSS + LA). cf Colon length (c, d) and histological score (e, f) of DSS + PBS and DSS + LA mice on day 8 after DSS induction, n = 5. Scale bar, 200 μm. g Body weight and (h) disease activity index (DAI) of DSS + PBS and DSS + LA mice during DSS-induced colitis, n = 5 biologically independent samples. il The proportions of CD4+IL-17+ Th17 cells and CD4+Foxp3+ Treg cells and their ratio among total CD4+ T cells within the MLNs and LPLs were detected by flow cytometry and statistically analysed (mo), n = 5. Data are presented as the mean ± SEM; *p < 0.05; **p < 0.01; ***p < 0.001 by two-sided unpaired t test. MLN mesenteric lymph node cells, LPL colon lamina propria lymphocytes, DSS dextran sodium sulfate. Source data are provided as a Source Data file.
Fig. 5
Fig. 5. Linoleic acid (LA) inhibited Th17 and promoted Treg cell differentiation in vitro.
a MACS-sorted naïve CD4+ T cells were cultured with anti-CD3/CD28 beads for three days. The expression of IL-17 and Foxp3 in naïve CD4+ T cells cocultured with different concentrations of LA detected by flow cytometry. b The expression of IL-17 and Foxp3 in naïve CD4+ T cell culture conditions induced with TGF-β under different concentrations of LA was detected by flow cytometry. c The expression of IL-17 and Foxp3 in naïve CD4+ T cell culture conditions induced with TGF-β and IL-6 under different concentrations of LA was detected by flow cytometry. d, f, h The proportion of CD4+IL-17+ Th17 cells to total CD4+ T cells in each group was statistically analysed. n = 4 biologically independent samples. e, g, i The proportion of CD4+Foxp3+ Treg cells to total CD4+ T cells in each group was statistically analysed. n = 4 biologically independent samples. Data are presented as the mean ± SEM; ns: no significant difference; *p < 0.05; **p < 0.01; ***p < 0.001 by two-tailed one-way ANOVA. Source data are provided as a Source Data file.
Fig. 6
Fig. 6. LA regulated Stat1 activation via AHR to repress the differentiation of Th17 cells.
ac MACS-sorted naïve CD4+ T cells were cultured with anti-CD3/CD28 beads and stimulated with IL-6 plus TGF-β and 50 μM LA for three days. Stat1, Stat3, and Stat5 gene expression was detected with RT‒qPCR. n = 3 independent experiments. di Stat1, Stat3, Stat5, and proteins phosphorylated at different sites were detected by Western blotting after adding LA into the Th17-inducing cultures isolated from AHR WT and KO splenocytes. n = 3 independent experiments. j Naïve CD4+ T cells isolated from WT and AHR−/− mice were stimulated with IL-6 plus TGF-β in the presence or absence of LA for three days, followed by restimulation with PMA and ionomycin cocktail for 6 h. Then, IL-17 and Foxp3 were detected by flow cytometry. k Naïve CD4+ T cells isolated from AHR WT and KO splenocytes were stimulated with IL-6 plus TGF-β in the presence or absence of LA for 24 h, fixed, permeabilized, and finally stained with phospho-Stat1 (Ser727). Intracellular levels of phospho-Stat1 (Ser727) were measured by flow cytometry. l, m The proportions of IL-17+ Th17 cells and Foxp3+ Treg cells to total CD4+ T cells in each group were statistically analysed. n = 4 biologically independent samples. n The positive rate of phospho-Stat1 (Ser727) was statistically analysed. n = 4 biologically independent samples. Data are presented as the mean ± SEM; ns no significant difference; *p < 0.05; **p < 0.01; ***p < 0.001 by two-tailed one-way ANOVA. MACS: magnetic-activated cell sorting. Source data are provided as a Source Data file.
Fig. 7
Fig. 7. LA supplementation alleviated Pg-induced aggravation of colitis and Th17/Treg cell imbalance in an AHR-dependent manner.
a The experimental design. Before the DSS-induced colitis model was established, WT or AHR KO mice were administered live Pg or Pg plus LA (named WT (DSS + Pg), WT (DSS + Pg + LA), KO (DSS + Pg), and KO (DSS + Pg + LA)). b, c Colon length of these four groups of mice on day 8 after DSS induction, n = 5. d, e Body weight (d) and disease activity index (DAI) (e) of mice during DSS-induced colitis, n = 5. f, g Histological scores of the four group mice on day 8 after DSS induction. n = 5. Scale bar, 200 μm. hm The proportions of IL-17+ Th17 cells and Foxp3+ Treg cells and their ratio among total CD4+ T cells within the MLNs and LPLs were detected by flow cytometry and statistically analysed. n = 5. Data are presented as the mean ± SEM; ns no significant difference; ***p < 0.001 by two-tailed one-way ANOVA. MLN mesenteric lymph node cells, LPL colon lamina propria lymphocytes, ANOVA analysis of variance, DSS dextran sodium sulfate. Source data are provided as a Source Data file.

Similar articles

Cited by

References

    1. Darveau RP. Periodontitis: a polymicrobial disruption of host homeostasis. Nat. Rev. Microbiol. 2010;8:481–490. doi: 10.1038/nrmicro2337. - DOI - PubMed
    1. Yamaguchi Y, Kurita-Ochiai T, Kobayashi R, Suzuki T, Ando T. Regulation of the NLRP3 inflammasome in Porphyromonas gingivalis-accelerated periodontal disease. Inflamm. Res. 2017;66:59–65. doi: 10.1007/s00011-016-0992-4. - DOI - PubMed
    1. Domokos Z, et al. Patients with inflammatory bowel disease have a higher chance of developing periodontitis: A systematic review and meta-analysis. Front Med. (Lausanne) 2022;9:1020126. doi: 10.3389/fmed.2022.1020126. - DOI - PMC - PubMed
    1. Zhang Y, et al. The Association between Periodontitis and Inflammatory Bowel Disease: A Systematic Review and Meta-analysis. Biomed. Res. Int. 2021;2021:6692420. - PMC - PubMed
    1. She YY, et al. Periodontitis and inflammatory bowel disease: a meta-analysis. BMC Oral. Health. 2020;20:67. doi: 10.1186/s12903-020-1053-5. - DOI - PMC - PubMed