. 2024 Feb 22;15(1):1645.
doi: 10.1038/s41467-024-45518-2.

Microbes translocation from oral cavity to nasopharyngeal carcinoma in patients

Affiliations

Microbes translocation from oral cavity to nasopharyngeal carcinoma in patients

Ying Liao et al. Nat Commun. .

Abstract

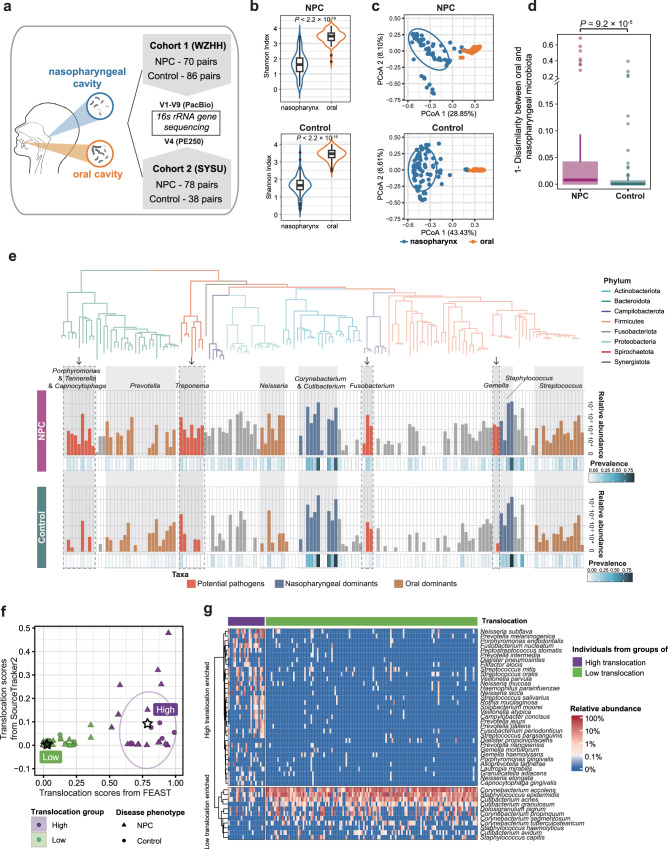
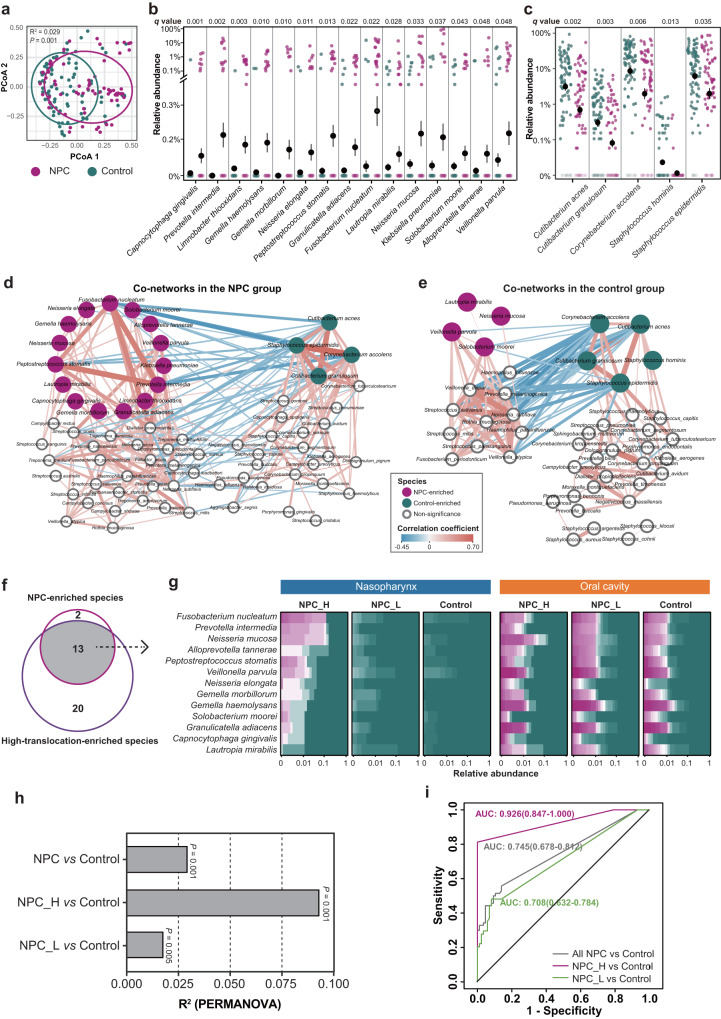
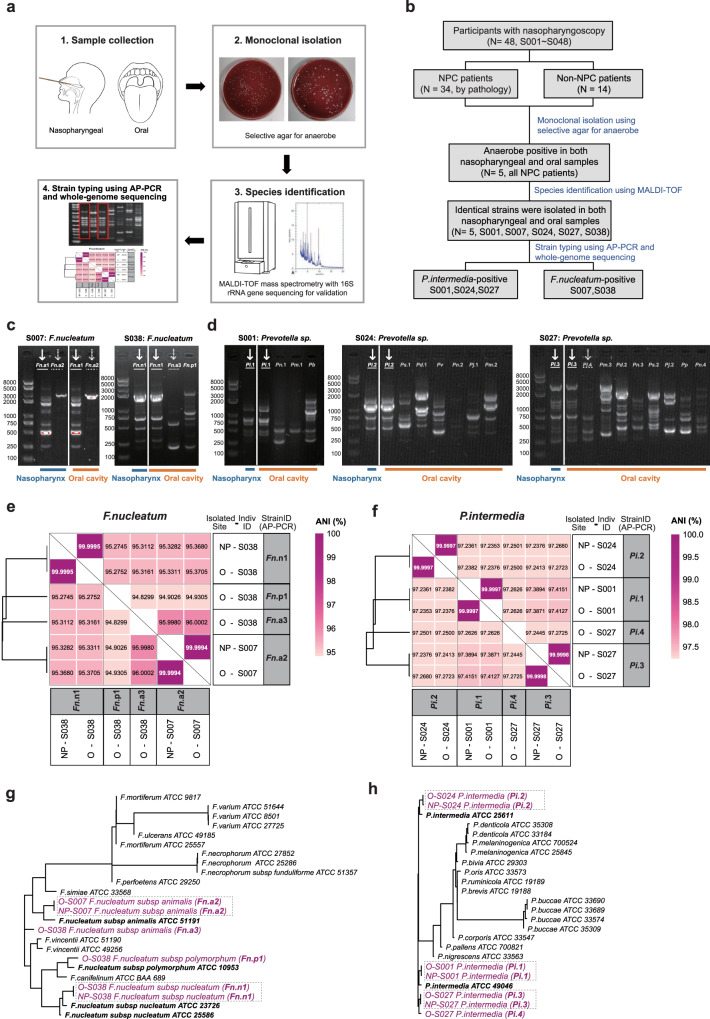
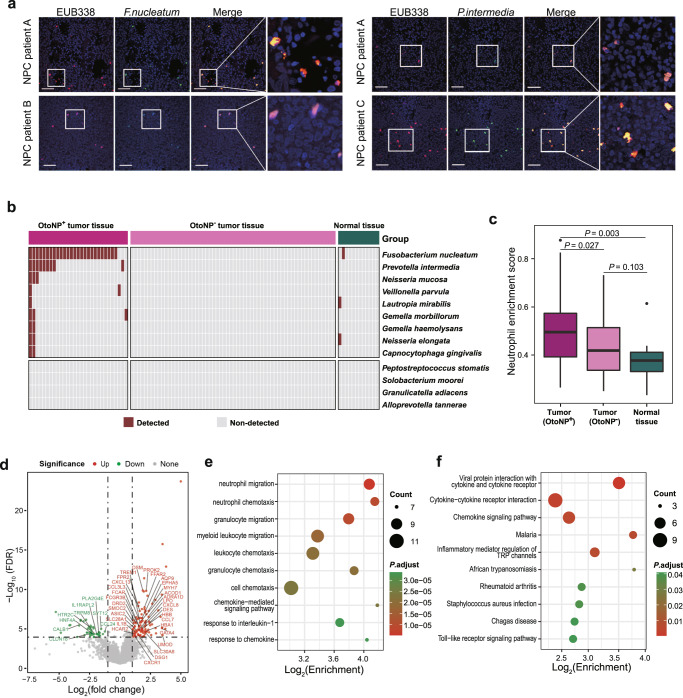
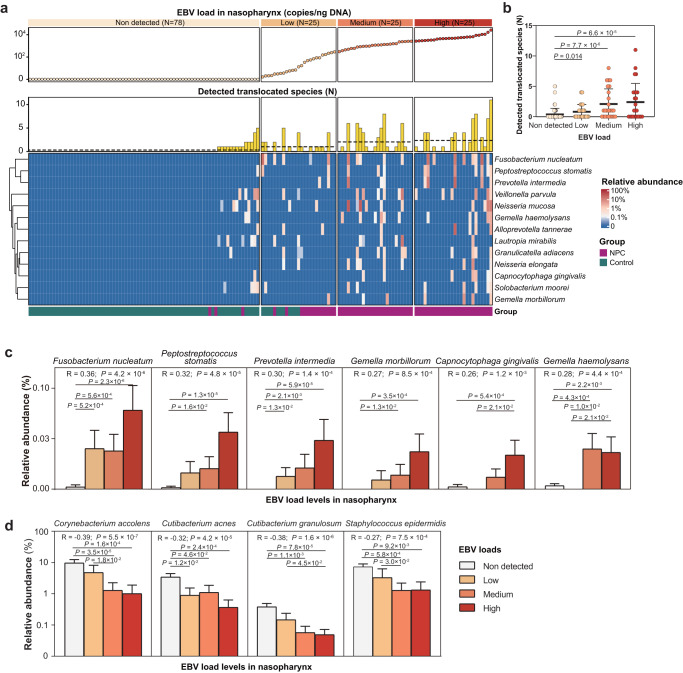
The presence of oral microbes in extra-oral sites is linked to gastrointestinal cancers. However, their potential ectopically colonization in the nasopharynx and impact on local cancer development remains uncertain. Our study involving paired nasopharyngeal-oral microbial samples from nasopharyngeal carcinoma (NPC) patients and controls unveils an aberrant oral-to-nasopharyngeal microbial translocation associated with increased NPC risk (OR = 4.51, P = 0.012). Thirteen species are classified as oral-translocated and enriched in NPC patients. Among these, Fusobacterium nucleatum and Prevotella intermedia are validated through culturomics and clonal strain identification. Nasopharyngeal biopsy meta-transcriptomes confirm these microbes within tumors, influencing local microenvironment and cytokine response. These microbes correlate significantly with the Epstein-Barr virus (EBV) loads in the nasopharynx, exhibiting an increased dose-response relationship. Collectively, our study identifies oral microbes migrating to the nasopharynx, infiltrating tumors, impacting microenvironments and linking with EBV infection. These results enhance our understanding of abnormal microbial communication and their roles in carcinogenesis.


Conflict of interest statement

The authors declare no competing interests.

Figures

Fig. 1
Fig. 1. The influx of oral microbes shaped two types of nasopharyngeal microbial communities.
a Designs of NPC case-control microbiota study. b The Violin plots of Shannon alpha diversity index between nasopharyngeal and oral microbiota. P values between the two groups were determined by the Wilcoxon rank-sum test (two-sided). Overlayed boxplots were presented with the median marked by thick black line, the interquartile range marked by the white bar, the range by the thin black line and outliners by the black dots (N = 70 for NPC, and N = 86 for control). c The PCoA plots based on Bray-Curtis distance within NPC patients (N = 70) or controls (N = 86). PCoA analysis was applied in combined NPC and control samples, and plots were presented separately on the same set of axes. Ellipses with 75% levels were shown. d The oral-nasopharyngeal paired Bray-Curtis distance between NPC patients and controls. P values between the two groups were determined by the Wilcoxon rank-sum test (two-sided). Boxplots were presented with the median marked by thick line, the interquartile range marked by the bar, the range by the thin line and outliners by dots (N = 70 for NPC, and N = 86 for control). e The phylogenetic tree represented ASVs of core species with >5% presence in nasopharyngeal microbiota. The phylogenetic tree was constructed by Mega7 software using the neighbor-joining method. The bar plots indicated the relative abundance of these species in nasopharynx which the filled colors indicate the types of microbes (top three commensal genera of nasopharynx and oral cavity, or potential pathogens). The heatmap indicated the prevalence of microbes in nasopharynx. f The scatter plot showing the two translocation clusters divided based on results from FEAST and SourceTracker2 algorithms using k-means methods. Ellipses with 75% levels were shown. Star represented the center of each cluster. g The heatmap showing the significant differential species between high- (N = 21) /low- (N = 135) translocation groups based on nasopharyngeal microbiota data (ANCOM-BC, two-sided, FDR q < 0.05) with adjusting for age, sex, cigarette smoking status, alcohol drinking status, whether have caries and whether have oral or nasal diseases. bg were plotted based on data from Cohort 1. PCoA principal coordinate analysis, ASV amplicon sequence variant, FEAST fast expectation-maximization microbial source tracking, ANCOM-BC analysis of compositions of microbiomes with bias correction, FDR false discovery rate. Source data are provided as a Source Data file.
Fig. 2
Fig. 2. Characteristic microbial communities appeared in the nasopharynx of NPC patients.
a The PCoA plot based on Bray-Curtis dissimilarity distance showing the compositional differences between NPC (N = 70) and control (N = 86) groups with adjusting for the confounding variables (R2 and P value was obtained from PERMANOVA, two-sided). The dot plots showing the relative abundances of NPC-enriched (b) and NPC-delepted (c) species (ANCOM-BC, two-sided, FDR q < 0.05) with adjusting for the confounding variables. Data represented mean ± SEM (N = 70 for NPC, and N = 86 for control). The co-occurrence network of nasopharyngeal microbiota in NPC patients (d, N = 70) and controls (e, N = 86). Only significant correlations were shown in the networks (SparCC, |r| > 0.25 and P < 0.05, two-sided). Each node represented a microbial species, NPC-enriched and control-enriched species were shown in pink and green, respectively. Each edge represented the correlation between paired species, and its width reflected the absolute value of the correlation coefficient. Co-inclusion associations were colored in red, whereas co-exclusion correlations were colored in blue. f The venn plot showing 13 species were both NPC-enriched and high-translocation-enriched which were defined as “NPCOtoNP” species. g The heatmaps show the relative abundance and prevalence of “NPCOtoNP” species in oral and nasopharyngeal samples from NPC patients (N = 70) and controls (N = 86). h The bar plots showing the R2 and P values obtained from PERMANOVA (two-sided) of NPC (N = 70)/NPC_H (N = 16)/NPC_L (N = 54) vs control (N = 86) groups with 1001 permutations. i The ROC curves of all NPC vs control, NPC_H vs control, and NPC_L vs control groups, corresponding AUCs (95%CI) were shown. Data were based on the nasopharyngeal microbiota of Cohort 1. The confounding variables contain age, sex, cigarette smoking status, alcohol drinking status, whether have caries and whether have oral or nasal diseases. PCoA principal coordinate analysis, PERMANOVA Permutational multivariate analysis of variance, ANCOM-BC analysis of compositions of microbiomes with bias correction, FDR false discovery rate, SparCC sparse correlations for compositional data algorithm, NPC_H NPC patients with high-translocation, NPC_L NPC patients with low-translocation, ROC Receiver operating characteristic, AUC Area Under the Curve, 95% CI 95% confidence intervals. Source data are provided as a Source Data file.
Fig. 3
Fig. 3. Identical microbial strains colonized in the nasopharynx and oral cavity of NPC patients.
a The schematic of the culturomics design. Nasopharyngeal swabs and saliva samples were collected and cultured in anaerobic conditions; clones were identified by MALDI-TOF MS combined with Sanger sequencing of 16S rRNA genes. Typical clones were performed strain typing using AP-PCR and whole genome sequencing. b The flowchart of the study. AP-PCR patterns of Fusobacterium nucleatum from S007 and S038 (c) and Prevotella intermedia from S001, S024 and S027 (d). Identical strains were highlighted with line/dashed lines. Three experiments were repeated independently with similar results. The comparison of ANI between different isolates of Fusobacterium nucleatum (e) and Prevotella intermedia (f). g, h Phylogenetic trees for genus Fusobacterium and Prevotella. MALDI-TOF MS, Matrix Assisted Laser Desorption/ionization Time-Of-Flight mass spectrometry, AP-PCR arbitrarily primed polymerase chain reaction, ANI average nucleotide identity, F.nuleatum Fusobacterium nucleatum, P.intermedia Prevotella intermedia, Fn.a Fusobacterium nucleatum subsp. Animals; Fn.n, Fusobacterium nucleatum subsp. nucleatum; Fn.p, Fusobacterium nucleatum subsp. polymorphum; Pi, Prevotella intermedia, Pm, Prevotella melaninogenica; Ps, Prevotella salivae; Pd, Prevotella denticola; Pn, Prevotella nigrescens; Pj, Prevotella jejuni; Pp, Prevotella pallens. Source data are provided as a Source Data file.
Fig. 4
Fig. 4. Oral translocated microbes infiltrated the tumor and affected the tumor microenvironment.
a Representative images of the presence of Fusobacterium nucleatum (left) and Prevotella intermedia (right) in tumor tissues of NPC patients. EUB338 (red) was a Cy3-conjugated universal bacterial oligonucleotide probe. F. nucleatum and P. intermedia were FITC-conjugated oligonucleotide probes (green). High-magnification images of the boxed area are shown on the right. Scale bars, 50 μm. Three and four patients were identified for F. nucleatum and P. intermedia with similar results. b The detection status of “NPCOtoNP” microbes in meta-transcriptomic sequencing data of nasopharyngeal tissues (N = 29 for OtoNP+ tumors, N = 60 for OtoNP- tumors and N = 12 for normal tissues). c The boxplot showing the enrichment score for neutrophil among OtoNP+ tumors (N = 29), OtoNP- tumors (N = 60) and normal tissues (N = 12). P values were determined by t test (two-sided). Boxplots were presented with the median marked by thick black line, the interquartile range marked by the bar, the range by the thin line and outliners by the black dots (d) The volcano plot showing the differentially expressed genes between OtoNP+ (N = 29) and OtoNP- (N = 60) tumor tissues (edgeR, two-sided, FDR-q < 0.05 & |log2FC| > 1). Genes involved in top 10 significant GO and KEGG pathways were labeled in the plot. The results of pathways enrichment analysis of differential genes based on GO (e) and KEGG pathways (f). “NPCOtoNP” microbes, the species that NPC-enriched and high-translocation-enriched; All pathways were with the FDR-adjusted P < 0.05 (two-sided). OtoNP+ tumor, the tumor with “NPCOtoNP” microbes; OtoNP tumor, the tumor without “NPCOtoNP” microbes, FISH fluorescence in situ hybridization probes, ssGSEA single sample Gene Set Enrichment Analysis, GO Gene Ontology, KEGG Kyoto Encyclopedia of Genes and Genomes, FDR false discovery rate. Source data are provided as a Source Data file.
Fig. 5
Fig. 5. The association between oral translocated microbes and EBV infection in nasopharynx.
a Correlation between EBV loads and translocated (“NPCOtoNP”) species in nasopharynx. Individuals were classified into four groups according to EBV load: non-detected group (EBV were not detected in samples, N = 78), and low, medium and high groups (for samples with EBV detected, individuals were divided by 33% and 67% quartiles, N = 25, 25, 25 representatively). Each column represented an individual. EBV loads were shown by dot plots on the top; the corresponding data of the number of detected “NPCOtoNP” species were shown by bar plots in the middle; and the relative abundances of “NPCOtoNP” species were shown by heatmap at the bottom. b The association between the number of detected “NPCOtoNP” microbes and EBV loads in the nasopharynx (N = 153). P values were determined by the Wilcoxon rank-sum test (two-sided). c The correlation analyses between “NPCOtoNP” microbes and EBV load were performed using Spearman’s correlation coefficient for ranked data, and P values between the two groups were determined by the Wilcoxon rank-sum test (two-sided, N = 153). d The correlation analyses between control-enriched microbes and EBV load were performed using Spearman’s correlation coefficient for ranked data, and P values between the two groups were determined by the Wilcoxon rank-sum test (two-sided, N = 153). Data was shown in mean ± SEM. NPC nasopharyngeal carcinoma, EBV Epstein-Barr virus, “NPCOtoNP” microbes, the species that NPC-enriched and high-translocation-enriched. Source data are provided as a Source Data file.

References

    1. Human Microbiome Project Consortium. Structure, function and diversity of the healthy human microbiome. Nature. 2012;486:207–214. doi: 10.1038/nature11234. - DOI - PMC - PubMed
    1. Lloyd-Price J, et al. Strains, functions and dynamics in the expanded human microbiome project. Nature. 2017;550:61–66. doi: 10.1038/nature23889. - DOI - PMC - PubMed
    1. Park S-Y, et al. Oral-gut microbiome axis in gastrointestinal disease and cancer. Cancers. 2021;13:2124. doi: 10.3390/cancers13092124. - DOI - PMC - PubMed
    1. Zhang J, et al. Differential oral microbial input determines two microbiota pneumo-types associated with health status. Adv. Sci. 2022;9:e2203115. doi: 10.1002/advs.202203115. - DOI - PMC - PubMed
    1. Read E, Curtis MA, Neves JF. The role of oral bacteria in inflammatory bowel disease. Nat. Rev. Gastroenterol. Hepatol. 2021;18:731–742. doi: 10.1038/s41575-021-00488-4. - DOI - PubMed

LinkOut - more resources