. 2024 Feb 22;14(1):4393.
doi: 10.1038/s41598-024-55120-7.

Deep learning segmentation of fibrous cap in intravascular optical coherence tomography images

Affiliations

Deep learning segmentation of fibrous cap in intravascular optical coherence tomography images

Juhwan Lee et al. Sci Rep. .

Abstract

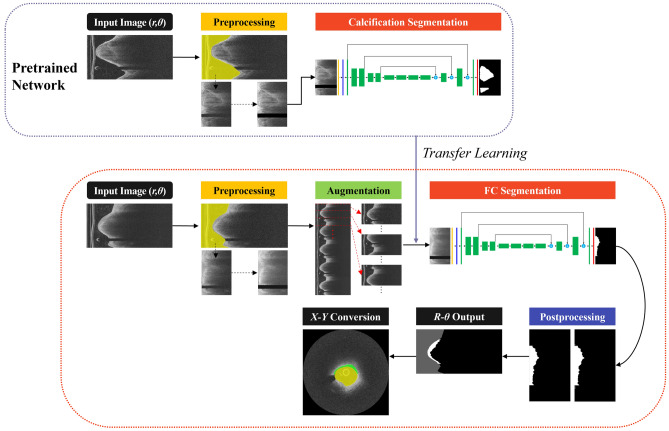
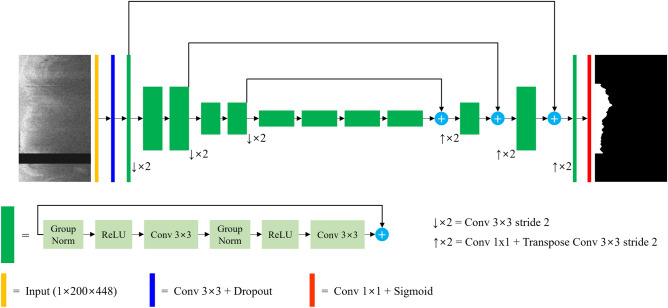
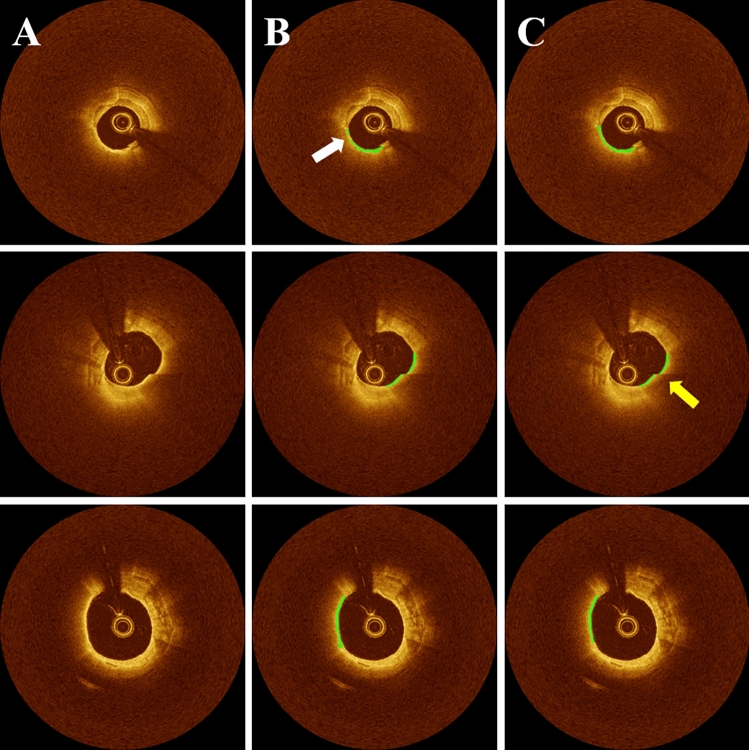
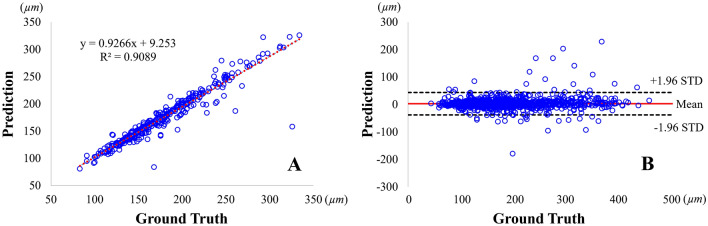
Thin-cap fibroatheroma (TCFA) is a prominent risk factor for plaque rupture. Intravascular optical coherence tomography (IVOCT) enables identification of fibrous cap (FC), measurement of FC thicknesses, and assessment of plaque vulnerability. We developed a fully-automated deep learning method for FC segmentation. This study included 32,531 images across 227 pullbacks from two registries (TRANSFORM-OCT and UHCMC). Images were semi-automatically labeled using our OCTOPUS with expert editing using established guidelines. We employed preprocessing including guidewire shadow detection, lumen segmentation, pixel-shifting, and Gaussian filtering on raw IVOCT (r,θ) images. Data were augmented in a natural way by changing θ in spiral acquisitions and by changing intensity and noise values. We used a modified SegResNet and comparison networks to segment FCs. We employed transfer learning from our existing much larger, fully-labeled calcification IVOCT dataset to reduce deep-learning training. Postprocessing with a morphological operation enhanced segmentation performance. Overall, our method consistently delivered better FC segmentation results (Dice: 0.837 ± 0.012) than other deep-learning methods. Transfer learning reduced training time by 84% and reduced the need for more training samples. Our method showed a high level of generalizability, evidenced by highly-consistent segmentations across five-fold cross-validation (sensitivity: 85.0 ± 0.3%, Dice: 0.846 ± 0.011) and the held-out test (sensitivity: 84.9%, Dice: 0.816) sets. In addition, we found excellent agreement of FC thickness with ground truth (2.95 ± 20.73 µm), giving clinically insignificant bias. There was excellent reproducibility in pre- and post-stenting pullbacks (average FC angle: 200.9 ± 128.0°/202.0 ± 121.1°). Our fully automated, deep-learning FC segmentation method demonstrated excellent performance, generalizability, and reproducibility on multi-center datasets. It will be useful for multiple research purposes and potentially for planning stent deployments that avoid placing a stent edge over an FC.

Keywords: Deep learning; Fibrous cap; Fibrous cap thickness; Intravascular optical coherence tomography; Segmentation; Thin-cap fibroatheroma.


Conflict of interest statement

The authors declare no competing interests.

Figures

Figure 1
Figure 1
Workflow of FC segmentation in IVOCT images. The key steps include preprocessing, data augmentation, FC segmentation, transfer learning, and postprocessing. Preprocessing involves guidewire shadow detection, lumen segmentation, pixel-shifting, and noise filtering on raw IVOCT data (r,θ), followed by data augmentation on the preprocessed images. The output serves as input to the FC segmentation network. Postprocessing techniques, such as filling and morphological operations, are utilized to reduce small false positive errors. For transfer learning (top, blue dotted box), the network is trained using IVOCT calcification images with the same preprocessing and network architecture.
Figure 2
Figure 2
SegResNet Architecture for FC Segmentation. The preprocessed IVOCT image serves as the input, starting with an initial 3 × 3 convolution and dropout layers. Each green block represents a ResNet-like block with group normalization. The decoder outputs a predicted label, followed by a sigmoid activation function to generate a pixel-wise classification map. Both the input and output images have the same size (200 × 448 pixels in (r,θ)). In the input image, the black strip indicates the removed guidewire shadow.
Figure 3
Figure 3
FC Segmentation results for different deep learning models with transfer learning. The panels include (A) IVOCT image in Cartesian coordinates, (B) ground truth, (C) U-Net, (D) Attention U-Net, (E) nnU-Net, and (F) SegResNet. Each row represents different instances of IVOCT images with FC present (shown in green). Among all the networks, SegResNet exhibited the highest segmentation performance in terms of Dice (0.837 ± 0.012) and PPV (82.5% ± 3.7%) across all five-folds of cross-validation. The green color indicates FC plaque regions, which are magnified within the red boxes.
Figure 4
Figure 4
Mean Dice loss curve during validation as computed over a fold. Red and blue curves are results with and without transfer learning, as described in the text. With transfer learning, the curve reached an asymptotic result with many fewer epochs. In addition, there was an improved Dice value in this run with transfer learning. The black dotted lines indicate the points of highest Dice coefficients for each curve.
Figure 5
Figure 5
Effect of pretraining and transfer learning on the number of labeled samples required for training. With transfer learning (TL, brown bars), Dice values are always greater than the result without transfer learning. In addition, with transfer learning, there is convergence towards an asymptotic Dice value whereas without transfer learning, performance is continuing to improve much between 80 and 100% of labeled training samples. Note that with transfer learning, only 60% of samples gives a better result than 100% of the samples without transfer learning. The task for pretraining was segmentation of calcified plaques in IVOCT images.
Figure 6
Figure 6
FC segmentation results on the held-out test set. The panels include (A) Cartesian IVOCT image, (B) ground truth, and (C) automated prediction. Each row represents different instances of IVOCT images. In panel (B) (top), the ground truth FC label appears disconnected at 8 o'clock (indicated by the white arrow); however, our proposed method accurately predicts FC regions, demonstrating its high generalizability. Moreover, our method delivered reliable results even in the presence of image reconstruction errors, as depicted in panel (C) (at 3 o'clock, highlighted by the yellow arrow). The green color indicates FC plaque regions.
Figure 7
Figure 7
Comparison of mean FC thickness measurements between the ground truth and the proposed method, calculated on the held-out test set. The held-out test set comprised 1,362 FC images from 74 IVOCT pullbacks (UHCMC). In panel (A), the linear regression analysis demonstrates a remarkably high similarity (R2: 0.909) between the proposed method and the ground truth. Additionally, in the Bland–Altman analysis (panel B), the mean bias of FC thickness measurements was 2.95 ± 20.73 µm, with only a small number of cases (32 out of 1,362) exceeding the limits of agreement (indicated by black dotted lines). These findings indicate the absence of significant bias in the proposed method compared to the ground truth.
Figure 8
Figure 8
Reproducibility of FC assessment in scan-rescan IVOCT images as obtained from an untreated lesion in paired pre- and post-stenting IVOCT pullbacks. The panels include (A) Cartesian IVOCT image and (B) automated prediction. The top and bottom rows correspond to the first (pre-stenting) and second (post-stenting) scans, respectively. In this case, FC measurements between scans were as follows: FC thickness (114 µm/130 µm), FC arc angle (314°/321°), and FC area (1.76 mm2/1.49 mm2), indicating its excellent reproducibility. The color green represents FC plaque regions.
Figure 9
Figure 9
3D visualizations of FC thickness from representative IVOCT pullbacks with (A) large and (B) small lesions. Both lesions are by definition TCFAs because they have at least a point where the FC is under 65 µm. In the case of the large lesion, the FC had length = 28.2 mm, maximum angle = 271°, and surface area = 66.0 mm2. These values suggest vulnerability as compared to the small lesion with attributes of an FC length of 4.9 mm, a maximum angle of 109°, and a surface area of 4.2 mm2. For high-risk cases, clinicians may consider additional revascularization strategies such as a more aggressive statin treatment (see “Discussion”).

References

    1. Virmani R, Burke AP, Kolodgie FD, Farb A. Vulnerable plaque: The pathology of unstable coronary lesions. J. Interv. Cardiol. 2002;15:439–446. doi: 10.1111/j.1540-8183.2002.tb01087.x. - DOI - PubMed
    1. Tian J, et al. Prevalence and characteristics of TCFA and degree of coronary artery stenosis: An OCT, IVUS, and angiographic study. J. Am. Coll. Cardiol. 2014;64:672–680. doi: 10.1016/j.jacc.2014.05.052. - DOI - PubMed
    1. Virmani R, Kolodgie FD, Burke AP, Farb A, Schwartz SM. Lessons from sudden coronary death. Arterioscler. Thromb. Vasc. Biol. 2000;20:1262–1275. doi: 10.1161/01.ATV.20.5.1262. - DOI - PubMed
    1. Kume T, et al. Measurement of the thickness of the fibrous cap by optical coherence tomography. Am. Heart J. 2006;152(755):e1–755.e4. - PubMed
    1. Tearney GJ, et al. Consensus standards for acquisition, measurement, and reporting of intravascular optical coherence tomography studies: A report from the international working group for intravascular optical coherence tomography standardization and validation. J. Am. Coll. Cardiol. 2012;59:1058–1072. doi: 10.1016/j.jacc.2011.09.079. - DOI - PubMed

MeSH terms