

Genomic evidence for rediploidization and adaptive evolution following the whole-genome triplication
- PMID: 38388712
- PMCID: PMC10884412
- DOI: 10.1038/s41467-024-46080-7
Genomic evidence for rediploidization and adaptive evolution following the whole-genome triplication
Abstract
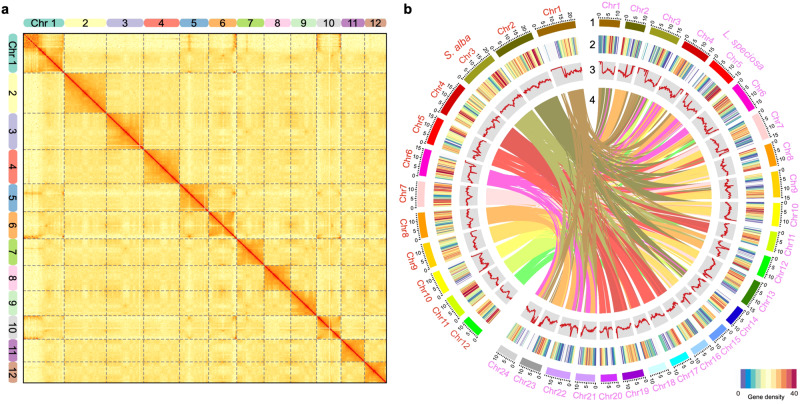
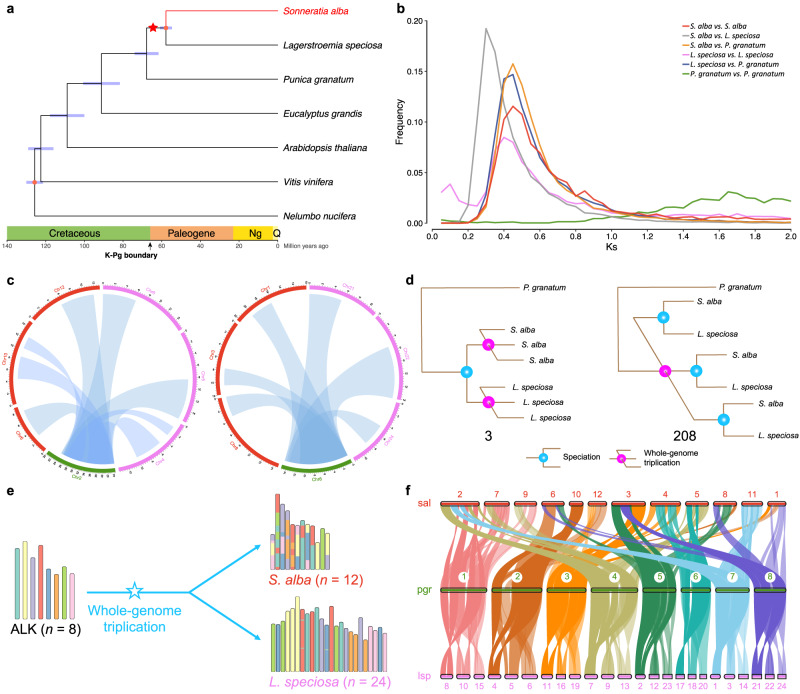
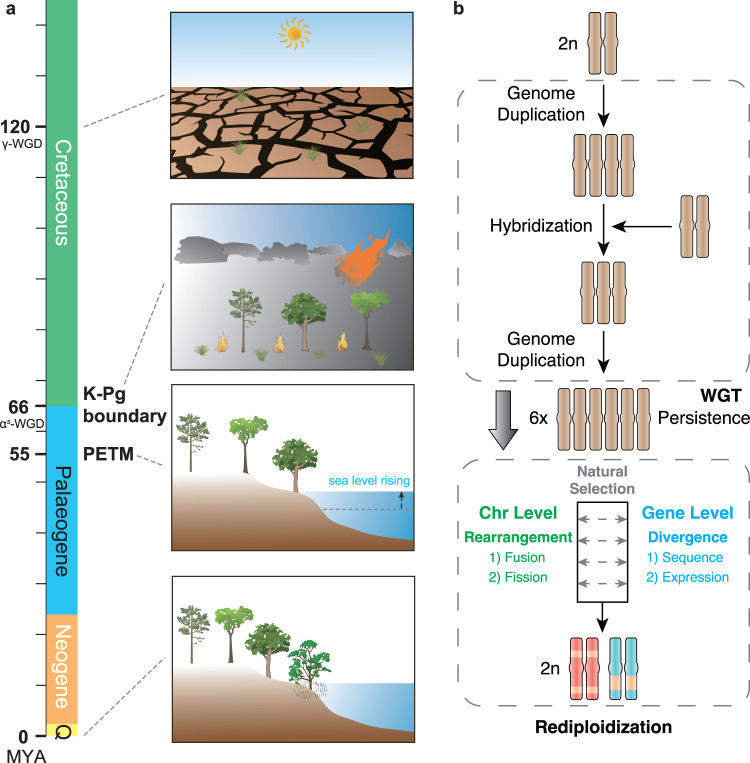
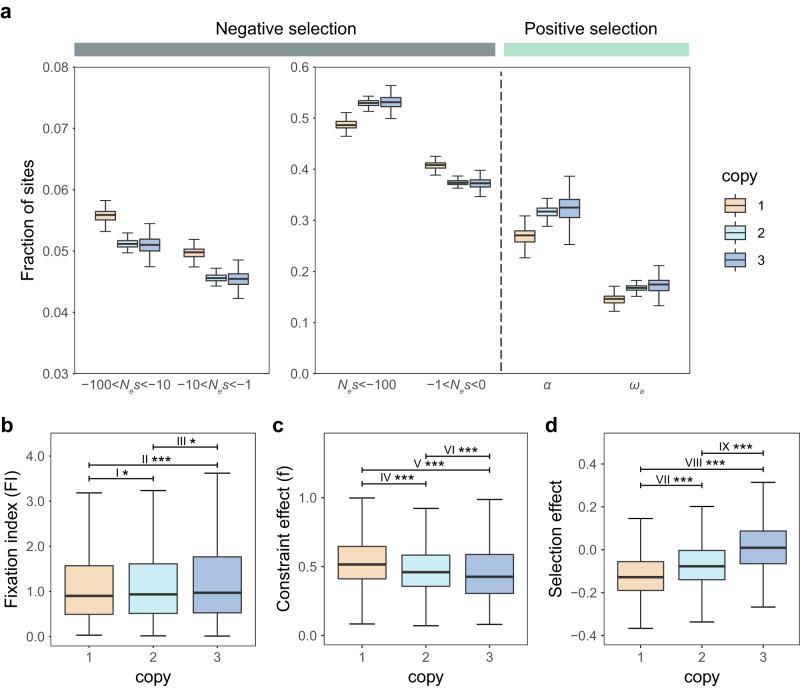
Whole-genome duplication (WGD), or polyploidy, events are widespread and significant in the evolutionary history of angiosperms. However, empirical evidence for rediploidization, the major process where polyploids give rise to diploid descendants, is still lacking at the genomic level. Here we present chromosome-scale genomes of the mangrove tree Sonneratia alba and the related inland plant Lagerstroemia speciosa. Their common ancestor has experienced a whole-genome triplication (WGT) approximately 64 million years ago coinciding with a period of dramatic global climate change. Sonneratia, adapting mangrove habitats, experienced extensive chromosome rearrangements post-WGT. We observe the WGT retentions display sequence and expression divergence, suggesting potential neo- and sub-functionalization. Strong selection acting on three-copy retentions indicates adaptive value in response to new environments. To elucidate the role of ploidy changes in genome evolution, we improve a model of the polyploidization-rediploidization process based on genomic evidence, contributing to the understanding of adaptive evolution during climate change.
© 2024. The Author(s).
Conflict of interest statement
The authors declare no competing interests.
Figures
Similar articles
-
Polyploidy and genome evolution in plants.Curr Opin Genet Dev. 2015 Dec;35:119-25. doi: 10.1016/j.gde.2015.11.003. Epub 2015 Dec 2. Curr Opin Genet Dev. 2015. PMID: 26656231 Review.
-
Genome evolution of the ancient hexaploid Platanus × acerifolia (London planetree).Proc Natl Acad Sci U S A. 2024 Jun 11;121(24):e2319679121. doi: 10.1073/pnas.2319679121. Epub 2024 Jun 3. Proc Natl Acad Sci U S A. 2024. PMID: 38830106 Free PMC article.
-
Polyploidy and interspecific hybridization: partners for adaptation, speciation and evolution in plants.Ann Bot. 2017 Aug 1;120(2):183-194. doi: 10.1093/aob/mcx079. Ann Bot. 2017. PMID: 28854567 Free PMC article. Review.
-
Ancestral polyploidy in seed plants and angiosperms.Nature. 2011 May 5;473(7345):97-100. doi: 10.1038/nature09916. Epub 2011 Apr 10. Nature. 2011. PMID: 21478875
-
Lineage-specific rediploidization is a mechanism to explain time-lags between genome duplication and evolutionary diversification.Genome Biol. 2017 Jun 14;18(1):111. doi: 10.1186/s13059-017-1241-z. Genome Biol. 2017. PMID: 28615063 Free PMC article.
Cited by
-
Adaptation in Unstable Environments and Global Gene Losses: Small but Stable Gene Networks by the May-Wigner Theory.Mol Biol Evol. 2024 Apr 2;41(4):msae059. doi: 10.1093/molbev/msae059. Mol Biol Evol. 2024. PMID: 38507653 Free PMC article.
-
Recent allopolyploidization and transcriptomic asymmetry in the mangrove shrub Acanthus tetraploideus.BMC Genomics. 2025 May 2;26(1):438. doi: 10.1186/s12864-025-11557-2. BMC Genomics. 2025. PMID: 40316933 Free PMC article.
-
A telomere-to-telomere gap-free assembly integrating multi-omics uncovers the genetic mechanism of fruit quality and important agronomic trait associations in pomegranate.Plant Biotechnol J. 2025 Jul;23(7):2852-2870. doi: 10.1111/pbi.70107. Epub 2025 May 3. Plant Biotechnol J. 2025. PMID: 40318230 Free PMC article.
-
Epilobieae genomes and the evolution of Myrtales.BMC Plant Biol. 2025 Jul 23;25(1):950. doi: 10.1186/s12870-025-07003-w. BMC Plant Biol. 2025. PMID: 40696290 Free PMC article.
-
Genomic Patterns of Loss of Distyly and Polyploidization in Primroses.Mol Biol Evol. 2025 Jul 30;42(8):msaf162. doi: 10.1093/molbev/msaf162. Mol Biol Evol. 2025. PMID: 40696990 Free PMC article.
References
-
- Darwin, F. & Seward, A. C. More Letters of Charles Darwin (John Murray, 1903).
MeSH terms
Grants and funding
- 32170230/National Natural Science Foundation of China (National Science Foundation of China)
- 31971540/National Natural Science Foundation of China (National Science Foundation of China)
- 31830005/National Natural Science Foundation of China (National Science Foundation of China)
- RCBS20221008093316043/Shenzhen Science and Technology Innovation Commission
LinkOut - more resources
Full Text Sources
Miscellaneous
