. 2024 Mar;27(3):421-432.
doi: 10.1038/s41593-024-01576-9. Epub 2024 Feb 22.

Blood-brain barrier disruption and sustained systemic inflammation in individuals with long COVID-associated cognitive impairment

Affiliations

Blood-brain barrier disruption and sustained systemic inflammation in individuals with long COVID-associated cognitive impairment

Chris Greene et al. Nat Neurosci. 2024 Mar.

Erratum in

Abstract

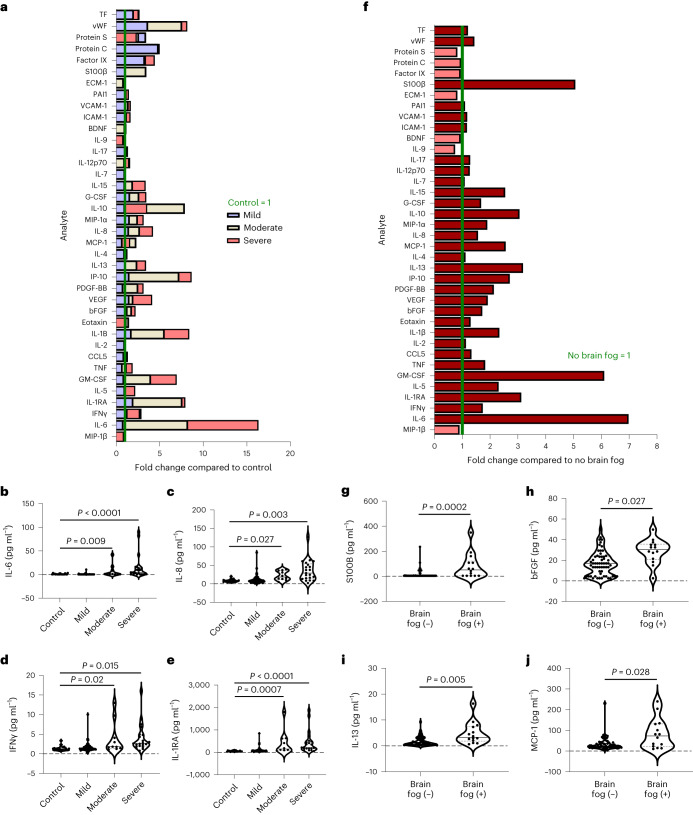
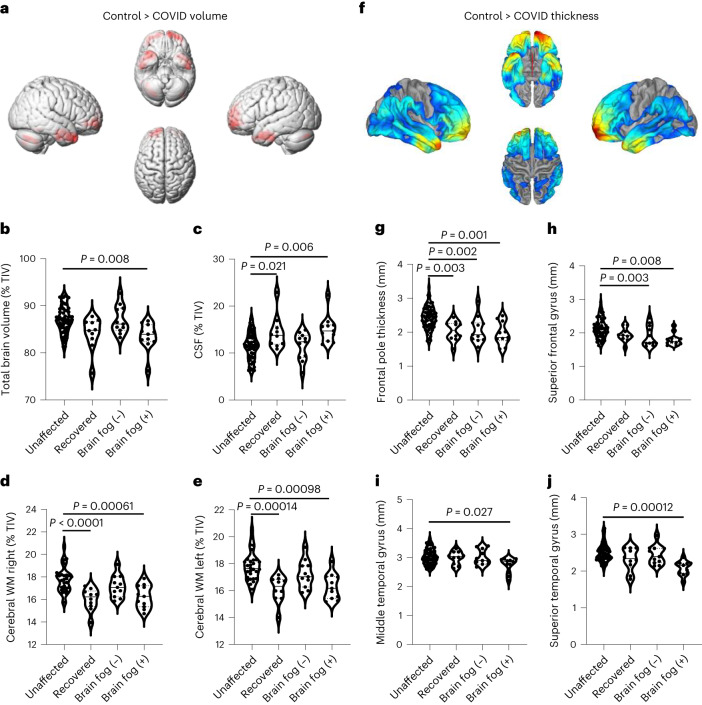
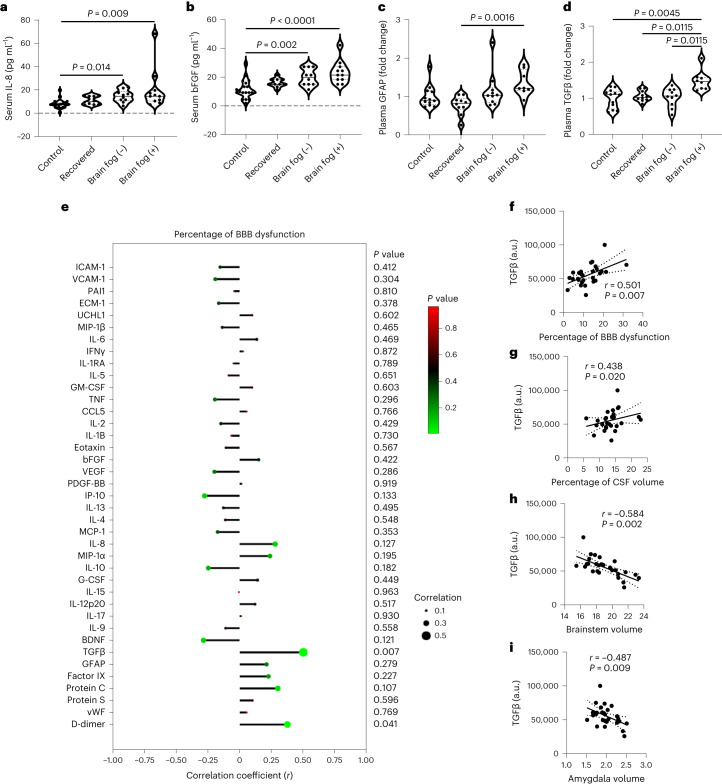
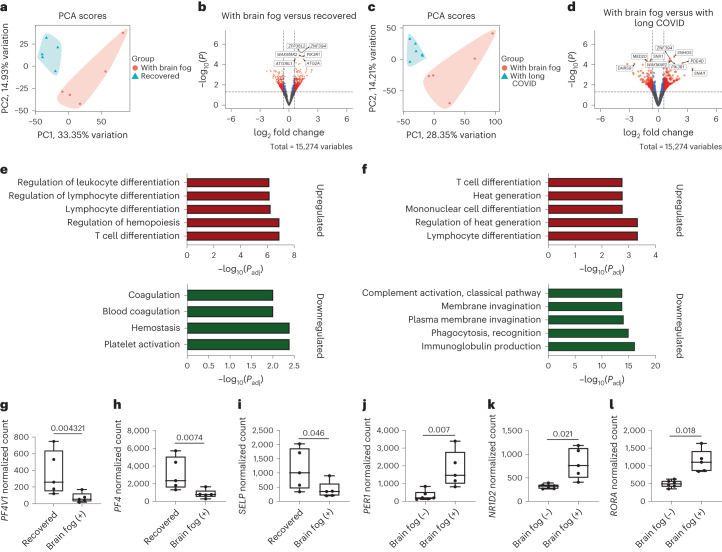
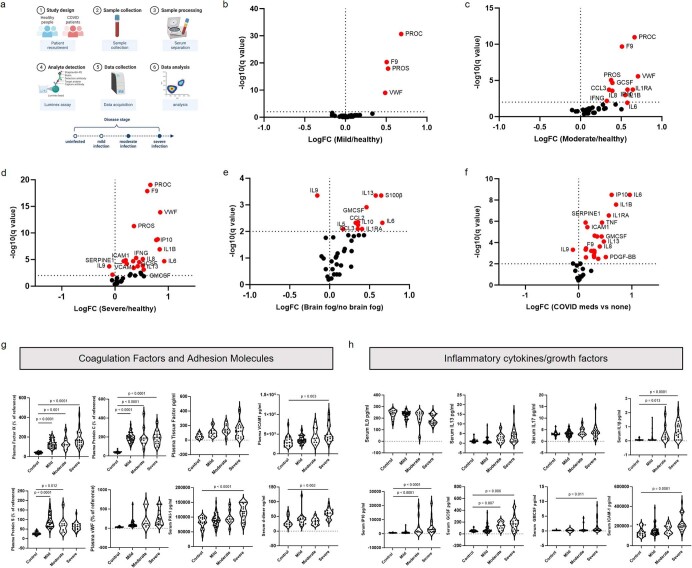
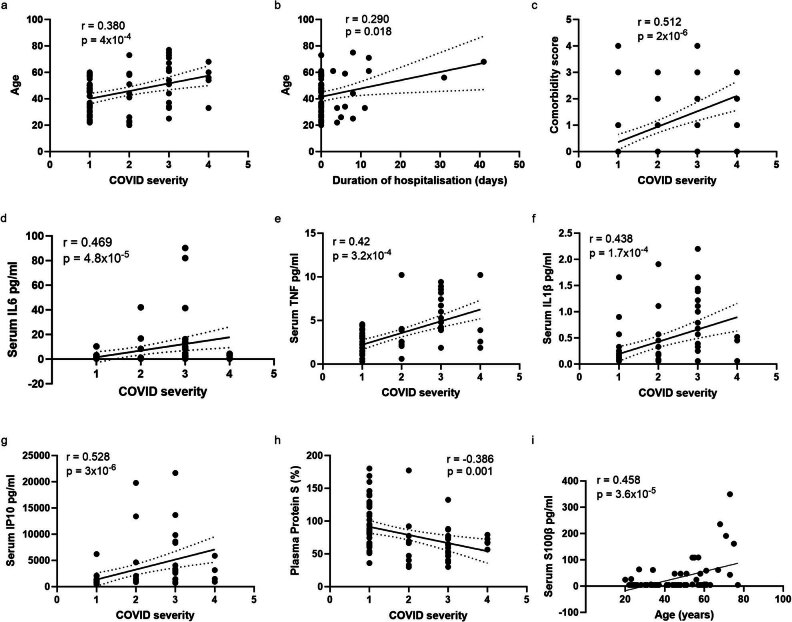
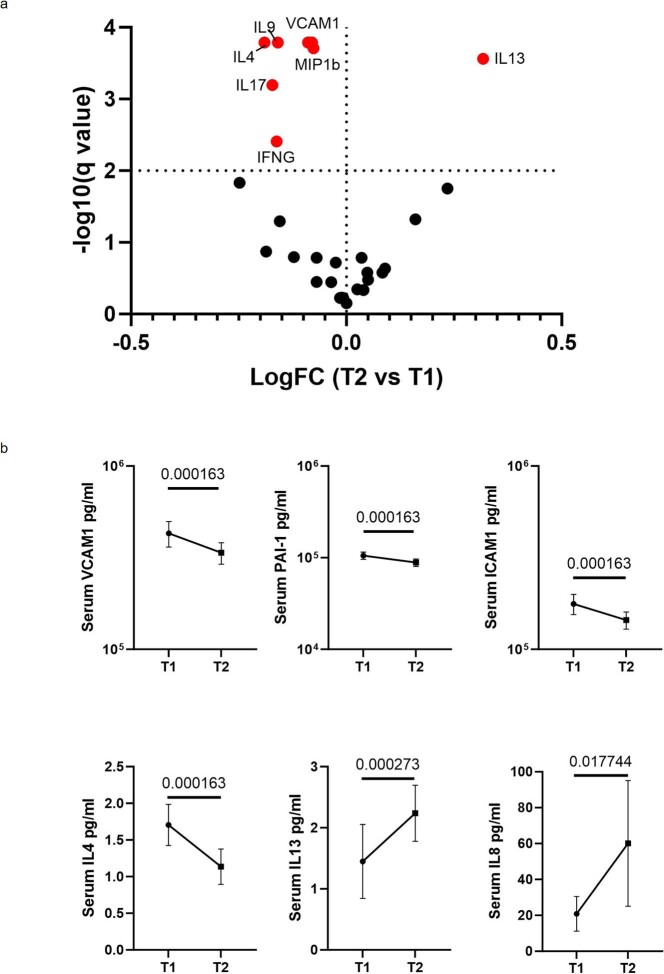
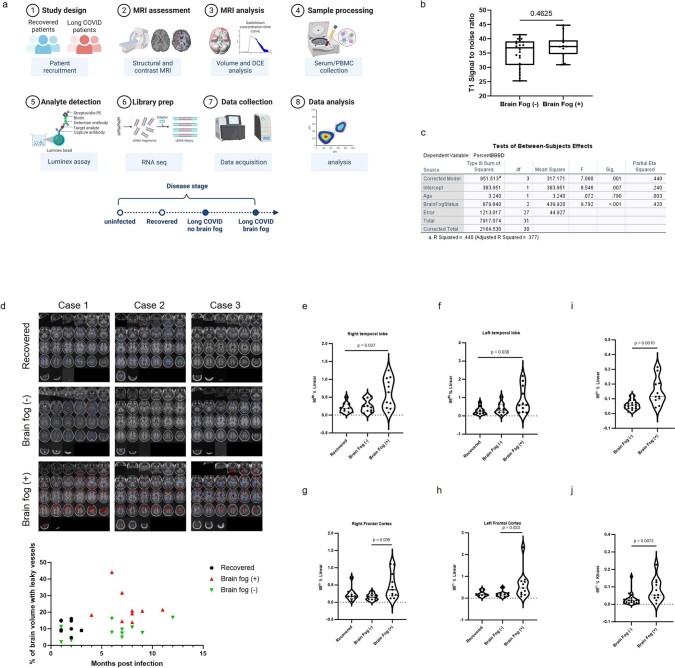
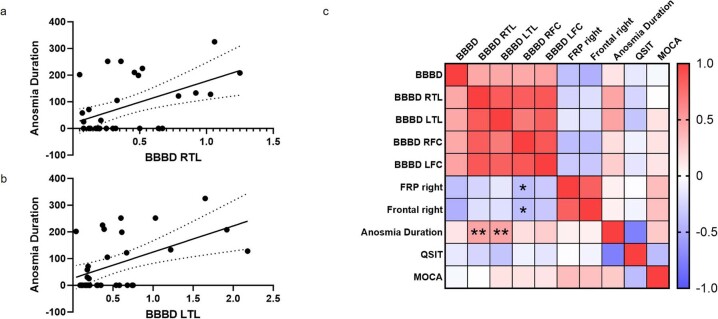
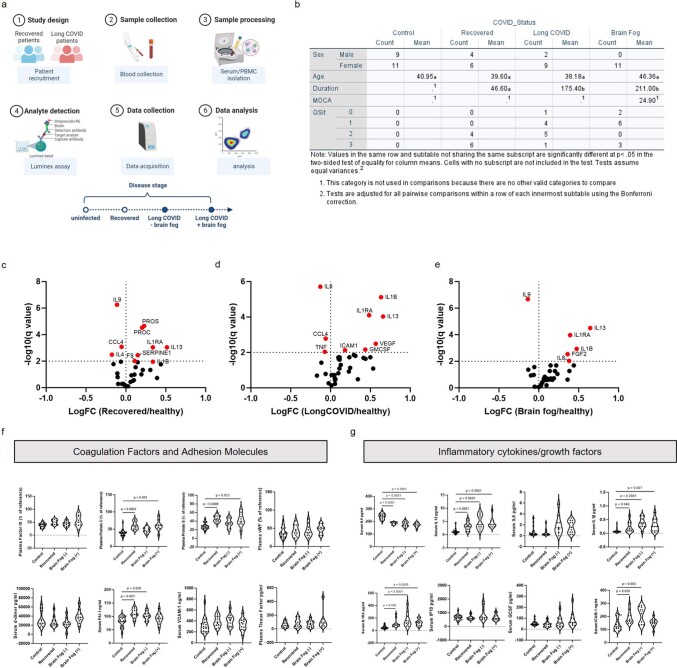
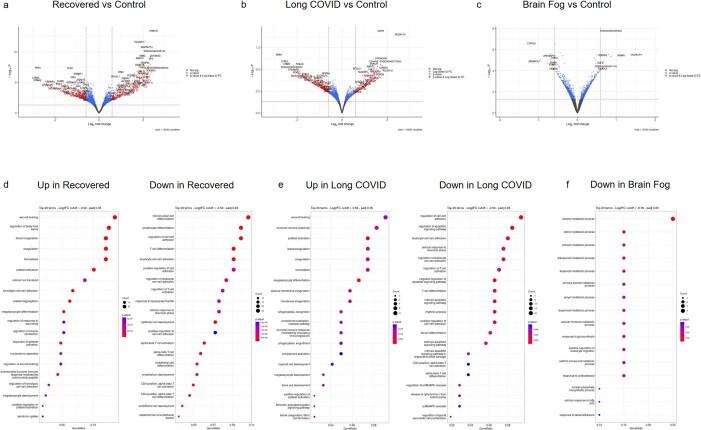
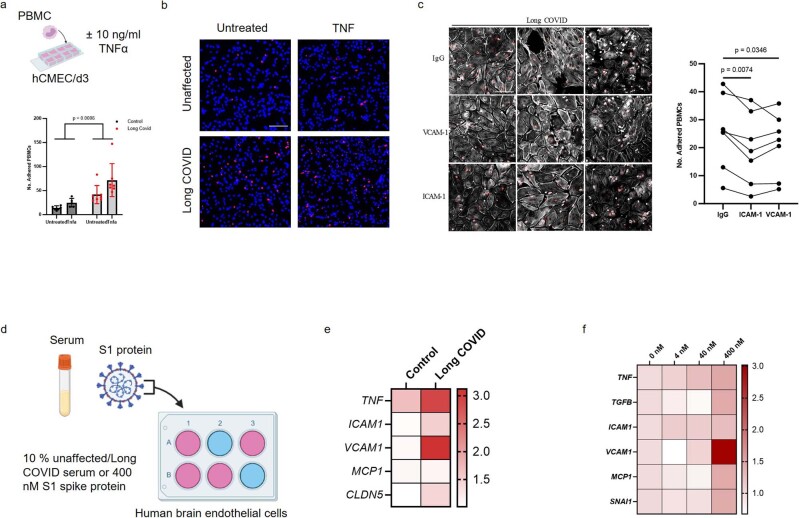
Vascular disruption has been implicated in coronavirus disease 2019 (COVID-19) pathogenesis and may predispose to the neurological sequelae associated with long COVID, yet it is unclear how blood-brain barrier (BBB) function is affected in these conditions. Here we show that BBB disruption is evident during acute infection and in patients with long COVID with cognitive impairment, commonly referred to as brain fog. Using dynamic contrast-enhanced magnetic resonance imaging, we show BBB disruption in patients with long COVID-associated brain fog. Transcriptomic analysis of peripheral blood mononuclear cells revealed dysregulation of the coagulation system and a dampened adaptive immune response in individuals with brain fog. Accordingly, peripheral blood mononuclear cells showed increased adhesion to human brain endothelial cells in vitro, while exposure of brain endothelial cells to serum from patients with long COVID induced expression of inflammatory markers. Together, our data suggest that sustained systemic inflammation and persistent localized BBB dysfunction is a key feature of long COVID-associated brain fog.


Conflict of interest statement

The authors declare no competing interests.

Figures

Fig. 1
Fig. 1. Inflammation and BBB permeability in cases infected with acute COVID-19.
a, Analyte abundance plots showing serum concentrations of blood biomarkers in unaffected patients and patients with mild, moderate and severe SARS-CoV-2. Each cytokine was normalized to the respective mean cytokine level in unaffected individuals. BDNF, brain-derived neurotrophic factor; CCL5, C-C motif chemokine 5; MIP-1α, macrophage inflammatory protein-1 alpha; PAI1, plasminogen activator inhibitor-1; PDGF-BB, platelet-derived growth factor-BB; VEGF, vascular endothelial growth factor. be, Levels of IL-6 (P = 0.009 moderate versus control, P < 0.0001 severe versus control) (b), IL-8 (P = 0.027 moderate versus control, P = 0.003 severe versus control) (c), IFNγ (P = 0.02 moderate versus control, P = 0.015 severe versus control) (d) and IL-1RA (P = 0.0007 moderate versus control, P < 0.0001 severe versus control) (e) according to COVID severity. f, Analyte abundance plots showing serum concentrations of blood biomarkers in cases with brain fog versus cases without. Each cytokine was normalized to the respective mean cytokine level in individuals without brain fog. gj, Levels of serum S100β (P = 0.0002) (g), bFGF (P = 0.027) (h), IL-13 (P = 0.005) (i) and MCP-1 (P = 0.028) (j) according to brain fog status. Data were analyzed using analysis of covariance (ANCOVA) adjusting for age, sex, COVID severity and comorbidities. The violin plots show the median (solid line) and interquartile (dashed lines) values; each data point represents one patient. Source data
Fig. 2
Fig. 2. BBB disruption in long COVID-associated brain fog.
a, Patient cohort for dynamic contrast-enhanced magnetic resonance imaging (DCE-MRI). b, Age distribution across cohorts (n = 10 recovered, n = 11 without brain fog (−), n = 11 with brain fog (+)). c, Time from COVID+ PCR test to scan across cohorts (n = 10 recovered, n = 11 without brain fog (−), n = 11 with brain fog (+)). Data were analyzed using a two-sided Kruskal–Wallis test with Dunn’s correction for multiple comparisons (P = 0.0157 without brain fog (−) versus recovered; P = 0.0004 with brain fog (+) versus recovered). d, Averaged BBB permeability maps in cases with and without brain fog. e, Quantification of the percentage of brain volume with leaky blood vessels in the cohort with brain fog compared to recovered cases (P = 0.0057) and cases without brain fog (P = 0.0004). Data were analyzed using a one-way analysis of variance with Tukey’s correction. f, Frequency distribution of the percentage of BBB-disrupted voxels in cases with and without brain fog. g, Representative BBB permeability maps at the level of the TLs, FLs and OLs showing enhanced BBB permeability in cases with brain fog. hk, Quantification of regional BBB permeability in the right TL (P = 0.0095) (h), left TL (P = 0.0202) (i), right frontal cortex (P = 0.0123) (j) and left frontal cortex (P = 0.0047) (k). Data were analyzed using a two-sided Mann–Whitney U-test. The box plots display the minimum and maximum values (whiskers), median (solid line) and interquartile range (IQR) (upper and lower box). The violin plots show the median (solid line) and IQR (dashed lines); each data point represents one patient. Schematics in a were created with BioRender.com. Source data
Fig. 3
Fig. 3. COVID-associated brain changes.
a, Voxel-based morphometry map indicating brain regions with reduced volume in patients with previous SARS-CoV-2 infection. be, Group-wise comparison of total brain volume (P = 0.008 brain fog (+) versus control) (b), CSF volume (P = 0.021 recovered versus control; P = 0.006 brain fog (+) versus control) (c), right WM volume (P < 0.0001 recovered versus control; P = 0.00061 brain fog (+) versus control) (d) and left WM volume (P = 0.00014 recovered versus control; P = 0.00098 brain fog (+) versus control) (e) in unaffected individuals, recovered individuals and individuals with long COVID and brain fog. Data were analyzed using an ANCOVA, adjusting for age, sex and total intracranial volume (TIV), with Bonferroni correction. f, Surface-based morphometry map indicating brain regions with reduced cortical thickness in patients with previous SARS-CoV-2 infection. gj, Group-wise comparison of frontal pole thickness (P = 0.003 recovered versus control; P = 0.002 brain fog (−) versus control; P = 0.001 brain fog (+) versus control) (g), superior frontal gyrus thickness (P = 0.003 brain fog (−) versus control; P = 0.008 brain fog (+) versus control) (h), middle temporal gyrus (P = 0.027 brain fog (+) versus control) (i) and superior temporal gyrus (P = 0.00012 brain fog (+) versus control) (j) in the unaffected, recovered, long COVID and brain fog cohorts. Data were analyzed using an ANCOVA adjusting for age and sex with Bonferroni correction. Maps were generated with Computational Anatomy Toolbox (CAT12) running in the Statistical Parametric Mapping (SPM12) software on MATLAB 2021a. The violin plots show the median (solid line) and IQR (dashed lines). Cohorts were compared with an unpaired t-test, with a family-wise error of less than 0.05, adjusted for age, sex and TIV. Volumetric and thickness region of interest measurements were obtained from volBrain. Source data
Fig. 4
Fig. 4. BBB permeability is associated with structural brain changes.
af, Spearman partial correlation between the percentage of BBB-disrupted voxels and GBV (a), WM right volume (b), WM left volume (c), right cerebrum volume (d), left cerebrum volume (e) and CSF volume (f). The dotted lines represent the 95% confidence intervals (CIs). g, Plot of Spearman correlations between BBB permeability and brain volume measurements. Each data point represents one patient. Dot size corresponds to the Spearman correlation coefficient, while color represents the P value. Spearman partial correlation analysis for all panels was adjusted for age, sex and TIV. Source data
Fig. 5
Fig. 5. Plasma TGFβ is associated with increased BBB permeability.
ad, Serum and plasma concentrations of IL-8 (P = 0.014 brain fog (−) versus control; P = 0.009 brain fog (+) versus control) (a), bFGF (P = 0.002 brain fog (−) versus control; P < 0.0001 brain fog (+) versus control) (b), GFAP (P = 0.0016 brain fog (+) versus recovered) (c) and TGFβ (P = 0.0045 brain fog (+) versus control; P = 0.0115 brain fog (+) versus recovered; P = 0.0115 brain fog (+) versus brain fog (−)) (d) between each cohort. a,b, Data were analyzed using an ANCOVA adjusted for age and sex with Bonferroni correction. c,d, Data were analyzed using a two-tailed Kruskal–Wallis test with Dunn’s correction. e, Correlation plot between analyte levels and BBB permeability. fi, Spearman correlation between levels of TGFβ and percentage of BBB dysfunction (f), percentage of CSF volume (g), brainstem volume (h) and amygdala volume (i). The dashed lines represent the 95% CIs. The violin plots show the median (solid line) and IQR (dashed lines). Each data point represents one patient. ad, Kruskal–Wallis test. fi, Spearman partial correlation analysis controlling for age, sex and TIV. Multiple comparisons were Benjamini–Hochberg-corrected, with P < 0.026 considered discoveries. Source data
Fig. 6
Fig. 6. Immunovascular dysfunction in long COVID blood samples.
a, PCA plot of brain fog versus recovered PBMC samples. b, Volcano plot depicting DEGs (red circles) with a log2 fold change > 0.58 or < −0.58 (vertical dashed lines) and P < 0.05 (horizontal dashed line). All DEGs with log2 fold change < 0.58 or > −0.58 and P < 0.05 are also displayed (blue circles). Data were analyzed using a Wald test with multiple comparisons controlled with an FDR. c, PCA plot of brain fog versus recovered PBMC samples. d, Volcano plot of DEGs (red circles) with a log2 fold change > 0.58 or < −0.58 (vertical dashed lines) and P < 0.05 (horizontal dashed line). DEGs with a log2 fold change < 0.58 or or > −0.58 and P < 0.05 are also displayed (blue circles). Data were analyzed using a Wald test with multiple comparisons controlled with an FDR. e,f, Top five upregulated and downregulated terms from brain fog versus recovered (e) and brain fog versus long COVID (f) cohorts. gi, Normalized counts of PF4V1 (g), PF4 (h) and SELP (i) in brain fog versus recovered cohorts (n = 5 recovered, n = 5 with brain fog). jl, Normalized counts of PER1 (j), NR1D2 (k) and RORA (l) in the cohort with brain fog versus the cohort with long COVID (n = 6 without brain fog (−), n = 5 with brain fog (+)). Data were analyzed using a Wald test with multiple comparisons controlled with an FDR. The box plots display the minimum and maximum values (whiskers), the median (solid line) and the IQR (upper and lower box) with significance set at P < 0.05. Statistical significance was assessed using DESeq2 with a Wald test and Benjamini–Hochberg correction. Source data
Extended Data Fig. 1
Extended Data Fig. 1. Disease severity is associated with changes in serum markers of inflammation.
a) Study design for acute COVID cohort. bd) Volcano plot of differentially expressed analytes in mild, moderate, and severe COVID patient’s vs healthy controls. e) Volcano plot of differentially expressed analytes between patients with vs without brain fog. f) Volcano plot of differentially expressed proteins between patients receiving vs not receiving COVID-directed medication. g) Levels of expression of Factor IX (p < 0.0001 Mild vs Control, p = 0.001 Moderate vs Control, p < 0.0001 Severe vs Control), Protein C (p < 0.0001 Mild vs Control, p < 0.0001 Moderate vs Control, p < 0.0001 Severe vs Control), Protein S (p < 0.0001 Mild vs Control, p = 0.012 Moderate vs Control), Tissue Factor, VCAM-1 (p = 0.0003 Severe vs Control), vWF, PAI-1 (p < 0.0001 Severe vs Control), D-dimer (p = 0.002 Severe vs Control). Data was analysed by ANCOVA adjusting for age and sex with Bonferroni correction for multiple comparisons. h) Levels of expression of IL-9, IL-13, IL-17, IL-1β (p = 0.013 Moderate vs Control, p < 0.0001 Severe vs Control), 10 kDa interferon gamma-induced protein (p < 0.0001 Moderate vs Control, p < 0.0001 Severe vs Control), G-CSF (p = 0.007 Moderate vs Control, p = 0.006 Severe vs Control), GM-CSF (p = 0.011 Severe vs Control), ICAM-1 (p = 0.0001 Severe vs Control). Data was analysed by ANCOVA adjusting for age and sex with Bonferroni correction for multiple comparisons. Violin plots show median (solid line) and interquartile values (dashed lines). Each datapoint represents one patient. All plots were generated in GraphPad PRISM. Multiple comparisons were controlled for by Benjamini-Hochberg correction. Schematic in a created with BioRender.com. Source data
Extended Data Fig. 2
Extended Data Fig. 2. COVID severity is associated with blood levels of inflammatory cytokines.
a) Pearson correlation between patient age and COVID severity. b) Pearson correlation between patient age and duration of hospitalisation. c) Pearson correlation between comorbidity score and COVID severity. dh) Pearson correlation between levels of IL-6, TNF, IL-1B, IP-10 and Protein S with COVID severity. i) Pearson correlation between age and levels of S100β. Dashed lines represent 95 % confidence intervals. Data in d-i were analysed by partial correlations with age, sex, and comorbidities as covariates. Multiple comparisons were controlled for by Benjamini-Hochberg correction.
Extended Data Fig. 3
Extended Data Fig. 3. Longitudinal changes in serum analytes.
a) Volcano plot of differentially expressed analytes between sample 1 (T1) and sample 2 (T2) following deterioration of clinical symptoms in hospitalised patients. b) Levels of sVCAM1, PAI-1, sICAM-1, IL-4, IL-13 and IL-8 between T1 and T2 (n = 27 paired samples). Error bars are mean ± s.d. For IL-8, ICAM-1, VCAM-1, PAI-1, VEGF, BDNF (n = 34 paired samples). Matched samples were compared with two-sided Wilcoxon signed-rank test. Multiple comparisons were controlled for by Benjamini-Hochberg correction. Source data
Extended Data Fig. 4
Extended Data Fig. 4. BBB disruption persists up to one year post SARS-CoV-2 infection in individuals with brain fog.
a) Study design for Long COVID cohort. b) Signal to noise ratio in T1 weighted scans (n = 21 Brain Fog (-), n = 11 Brain Fog (+)). c) Summary statistics for the effects of age and brain fog on BBB permeability (effect of brain fog status on % BBB disruption p = 0.0006). d) Representative DCE-MRI scans from 3 recovered, Long COVID and brain fog participants. eh) Quantification of regional BBB permeability in the right temporal lobe (p = 0.037 Brain Fog (+) vs Recovered), left temporal lobe (p = 0.036 Brain Fog (+) vs Recovered), right frontal cortex (p = 0.039 Brain Fog (+) vs Brain Fog (-)) and left frontal cortex (p = 0.033 Brain Fog (+) vs Brain Fog (-). Data analysed by two-sided Kruskal-Wallis test with Bonferroni correction. i) Whole brain 95th percentile values in participants with or without brain fog (p = 0.001). Data was analysed by two-sided Mann-Whitney test. j) 95th percentile Ktrans values in participants with or without brain fog (p = 0.0072). Data was analysed by two-sided Mann-Whitney test. Box plots display min and max values (whiskers), median values (solid line) and interquartile range (upper/lower box). Violin plots show median (solid line) and interquartile values (dashed lines). Schematic in a created with BioRender.com. Source data
Extended Data Fig. 5
Extended Data Fig. 5. BBB disruption in the temporal lobes correlates with duration of anosmia.
a, b) Spearman correlations between regional BBB disruption in the temporal lobes and the duration of anosmia. Dashed lines represent 95 % confidence intervals. c) Correlation heatmap between regional BBB disruption, anosmia status and cognitive performance as assessed by the Montreal Cognitive Assessment (MOCA). Data was analysed by Spearman partial correlations adjusted for age and sex. Source data
Extended Data Fig. 6
Extended Data Fig. 6. Systemic inflammatory changes in recovered and Long COVID patients.
a) Study design for Long COVID cohort. b) Demographics of all cohorts. Data was analysed by One-Way ANOVA with Bonferroni correction for multiple comparisons. ce) Volcano plots of differentially expressed analytes in recovered, Long COVID and brain fog cohorts compared to healthy controls. Multiple comparisons were controlled for by Benjamini-Hochberg correction. f) Level of expression of Factor IX, Protein C (p = 0.0001 Recovered vs Control, p = 0.001 Brain Fog (+) vs Control), Protein S (p = 0.0008 Recovered vs Control, p = 0.013 Brain Fog (+) vs Control), vWF, D-dimer, PAI-1 (p = 0.001 Recovered vs Control, p = 0.017 Brain Fog (-) vs Control), VCAM-1 and Tissue Factor according to disease status. Data was analysed by ANCOVA adjusting for age and sex with Bonferroni correction for multiple comparisons. g) Levels of expression of IL-9 (p < 0.0001 Recovered vs Control, p < 0.0001 Brain Fog (-) vs Control, p < 0.0001 Brain Fog (+) vs Control), IL-13 (p < 0.0001 Recovered vs Control, p < 0.0001 Brain Fog (-) vs Control, p < 0.0001 Brain Fog (+) vs Control), IL-6, IL-1β (p = 0.046 Recovered vs Control, p < 0.0001 Brain Fog (-) vs Control, p = 0.007 Brain Fog (+) vs Control), IL-1RA (p = 0.002 Recovered vs Control, p < 0.0001 Brain Fog (-) vs Control, p = 0.0005 Brain Fog (+) vs Control), IP-10, G-CSF and ICAM-1 (p = 0.020 Recovered vs Control, p = 0.003 Brain Fog (-) vs Control) according to disease status. Data was analysed by ANCOVA adjusting for age and sex with Bonferroni correction for multiple comparisons. Violin plots show median (solid line) and interquartile values (dashed lines). Each datapoint represents one patient. Schematic in a created with BioRender.com. Source data
Extended Data Fig. 7
Extended Data Fig. 7. Transcriptional characterisation of PBMCs across all patient groups.
ac) Volcano plots of differentially expressed analytes in recovered, Long COVID and brain fog patient’s vs healthy controls. Data was analysed by Wald test with multiple comparisons controlled with Benjamini-Hochberg correction. df) Bubble plots of enriched Gene Ontology biological processes in each cohort. Bubble plots show top 20 enriched terms with absLog2FC cut-off < 0.59 and adjusted p-value < 0.05. Pathway enrichment p values were calculated in clusterProfiler with the enrichGO function with Benjamini-Hochberg adjustment and cutoff p-value of 0.05.
Extended Data Fig. 8
Extended Data Fig. 8. Adhesion of Long COVID PBMCs to human brain endothelial cells.
a, b) Peripheral blood mononuclear cells (PBMCs) from Long COVID participants show greater adherence to the human brain endothelial cell line, hCMEC/d3, in the presence or absence of 10 ng/ml TNFa (n = 5 Control, n = 7 Long COVID). Error bars are mean ± s.d. Data in a was analysed by two-way ANOVA with Tukey correction. Each datapoint represents one patient. c) PBMCs from long COVID patients in the presence of IgG, VCAM-1 or ICAM-1 blocking antibodies (n = 6 long COVID patients). Data was analysed by repeated measures one-way ANOVA with Tukey correction for multiple comparisons. Each datapoint represents one patient. d) Schematic of experiments to assess the effect of long COVID patient serum or spike protein on human brain endothelial cells. e) Exposure of hCMEC/d3 cells to 10 % serum from healthy or long COVID participants and quantification of gene expression changes by q-RT-PCR. Long COVID serum significantly increased TNF (P = 0.0006) and VCAM1 (P < 0.0001) vs control serum. f) Exposure of hCMEC/d3 cells to vehicle or 4, 40 or 400 nM S1 spike protein and quantification of gene expression changes by q-RT-PCR. 400 nM S1 spike protein significantly increased TNF (P = 0.024), TGFB1 (P = 0.0274), VCAM1 (P < 0.0001), MCP1 (P = 0.0269) and SNAI1 (P = 0.0389) vs vehicle. For e, n = 4 healthy serum samples and n = 8 long COVID serum samples were used. Scale bar – 50 µm. Schematics in a and d created with BioRender.com. Source data

Comment in

Similar articles

Cited by

References

    1. Wu Z, McGoogan JM. Characteristics of and important lessons from the coronavirus disease 2019 (COVID-19) outbreak in China: summary of a report of 72 314 cases from the Chinese Center for Disease Control and Prevention. JAMA. 2020;323:1239–1242. doi: 10.1001/jama.2020.2648. - DOI - PubMed
    1. Zhu N, et al. A novel coronavirus from patients with pneumonia in China, 2019. N. Engl. J. Med. 2020;382:727–733. doi: 10.1056/NEJMoa2001017. - DOI - PMC - PubMed
    1. Helms J, et al. Neurologic features in severe SARS-CoV-2 infection. N. Engl. J. Med. 2020;382:2268–2270. doi: 10.1056/NEJMc2008597. - DOI - PMC - PubMed
    1. Taquet M, Geddes JR, Husain M, Luciano S, Harrison PJ. 6-month neurological and psychiatric outcomes in 236 379 survivors of COVID-19: a retrospective cohort study using electronic health records. Lancet Psychiatry. 2021;8:416–427. doi: 10.1016/S2215-0366(21)00084-5. - DOI - PMC - PubMed
    1. Bohmwald K, Gálvez NMS, Ríos M, Kalergis AM. Neurologic alterations due to respiratory virus infections. Front. Cell. Neurosci. 2018;12:386. doi: 10.3389/fncel.2018.00386. - DOI - PMC - PubMed

MeSH terms