. 2024 May;67(5):822-836.
doi: 10.1007/s00125-024-06099-3. Epub 2024 Feb 22.

Phenotype-based targeted treatment of SGLT2 inhibitors and GLP-1 receptor agonists in type 2 diabetes

Affiliations

Phenotype-based targeted treatment of SGLT2 inhibitors and GLP-1 receptor agonists in type 2 diabetes

Pedro Cardoso et al. Diabetologia. 2024 May.

Abstract

Aims/hypothesis: A precision medicine approach in type 2 diabetes could enhance targeting specific glucose-lowering therapies to individual patients most likely to benefit. We aimed to use the recently developed Bayesian causal forest (BCF) method to develop and validate an individualised treatment selection algorithm for two major type 2 diabetes drug classes, sodium-glucose cotransporter 2 inhibitors (SGLT2i) and glucagon-like peptide-1 receptor agonists (GLP1-RA).

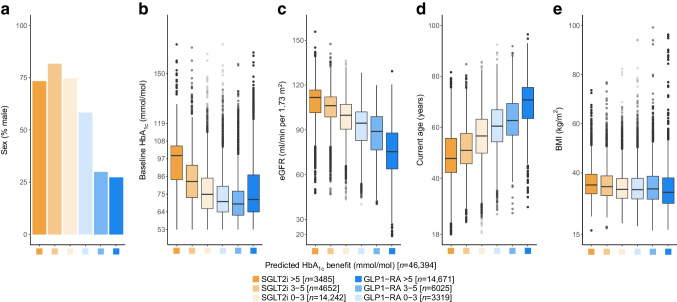
Methods: We designed a predictive algorithm using BCF to estimate individual-level conditional average treatment effects for 12-month glycaemic outcome (HbA1c) between SGLT2i and GLP1-RA, based on routine clinical features of 46,394 people with type 2 diabetes in primary care in England (Clinical Practice Research Datalink; 27,319 for model development, 19,075 for hold-out validation), with additional external validation in 2252 people with type 2 diabetes from Scotland (SCI-Diabetes [Tayside & Fife]). Differences in glycaemic outcome with GLP1-RA by sex seen in clinical data were replicated in clinical trial data (HARMONY programme: liraglutide [n=389] and albiglutide [n=1682]). As secondary outcomes, we evaluated the impacts of targeting therapy based on glycaemic response on weight change, tolerability and longer-term risk of new-onset microvascular complications, macrovascular complications and adverse kidney events.

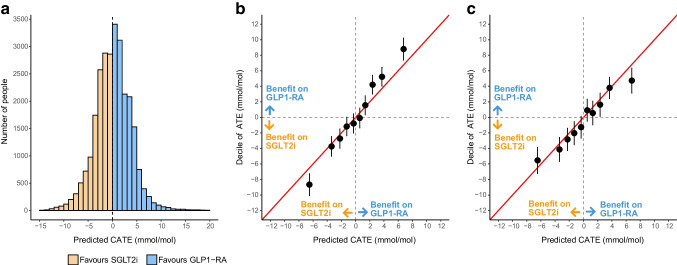
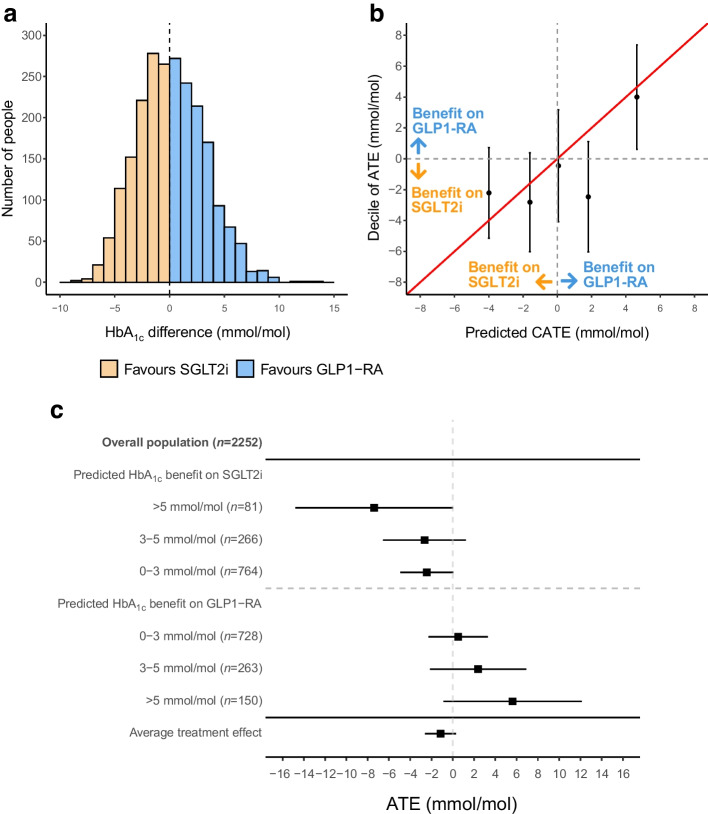
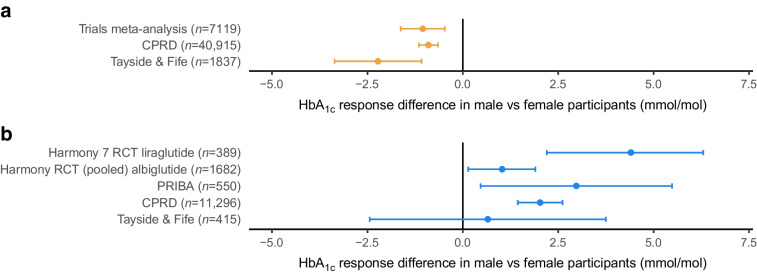
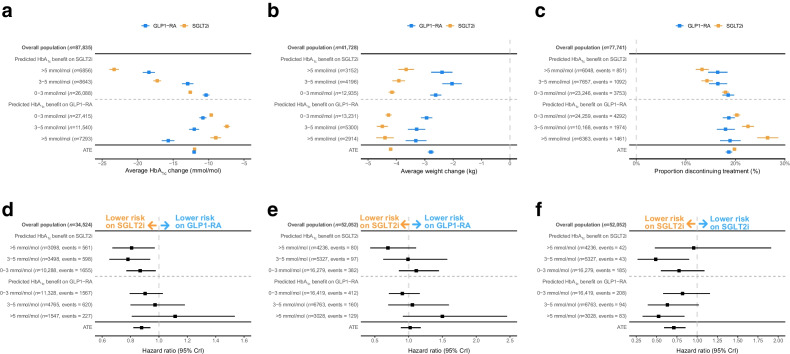
Results: Model development identified marked heterogeneity in glycaemic response, with 4787 (17.5%) of the development cohort having a predicted HbA1c benefit >3 mmol/mol (>0.3%) with SGLT2i over GLP1-RA and 5551 (20.3%) having a predicted HbA1c benefit >3 mmol/mol with GLP1-RA over SGLT2i. Calibration was good in hold-back validation, and external validation in an independent Scottish dataset identified clear differences in glycaemic outcomes between those predicted to benefit from each therapy. Sex, with women markedly more responsive to GLP1-RA, was identified as a major treatment effect modifier in both the UK observational datasets and in clinical trial data: HARMONY-7 liraglutide (GLP1-RA): 4.4 mmol/mol (95% credible interval [95% CrI] 2.2, 6.3) (0.4% [95% CrI 0.2, 0.6]) greater response in women than men. Targeting the two therapies based on predicted glycaemic response was also associated with improvements in short-term tolerability and long-term risk of new-onset microvascular complications.

Conclusions/interpretation: Precision medicine approaches can facilitate effective individualised treatment choice between SGLT2i and GLP1-RA therapies, and the use of routinely collected clinical features for treatment selection could support low-cost deployment in many countries.

Keywords: Bayesian non-parametric modelling; GLP1-receptor agonists; Heterogeneous treatment effects; Precision medicine; SGLT2-inhibitors; Type 2 diabetes.


Figures

Fig. 1
Fig. 1
Predicted CATE effects and model calibration. (a) Distribution of CATE estimates for SGLT2i vs GLP1-RA in the CPRD development cohort; negative values reflect a predicted HbA1c treatment benefit on SGLT2i and positive values reflect a predicted treatment benefit on GLP1-RA. (b) Calibration between ATE and predicted CATE estimates, by decile of predicted CATE in the development cohort. (c) Calibration of CATE estimates in the validation cohort. ATE estimates are adjusted for all the variables used in the treatment selection model (see Methods)
Fig. 2
Fig. 2
External validation in Tayside & Fife, Scotland (n=2252). (a) Distribution of CATE estimates for SGLT2i vs GLP1-RA; negative values reflect a predicted glucose-lowering treatment benefit on SGLT2i and positive values reflect a predicted treatment benefit on GLP1-RA. (b) Calibration between adjusted ATE and predicted CATE estimates, by quintile of predicted CATE. (c) ATE estimates within subgroups defined by clinically meaningful CATE thresholds (SGLT2i benefit >5, 3–5 and 0–3 mmol/mol, GLP1-RA benefit >5, 3–5 and 0–3 mmol/mol). Bars represent 95% CrI
Fig. 3
Fig. 3
Distributions of major clinical characteristics predicting differential HbA1c outcome with SGLT2i and GLP1-RA. Distributions of key differential clinical characteristics in the combined development and validation cohorts (n=46,394 with complete predictor data) for subgroups defined by predicted HbA1c outcome differences: SGLT2i benefit >5 mmol/mol, 3–5 mmol/mol and 0–3 mmol/mol, GLP1-RA benefit >5 mmol/mol, 3–5 mmol/mol and 0–3 mmol/mol. The box and whisker plots include median, first and third quartile, with outliers laying further than 1.5 times the interquartile range. (a) Percentage of male individuals in each of the subgroups. (b) Baseline HbA1c. (c) eGFR. (d) Current age. (e) BMI
Fig. 4
Fig. 4
Differences in HbA1c outcome by sex, in randomised clinical trial and observational datasets. All estimates are adjusted for baseline HbA1c. Estimates lower than zero represent a greater HbA1c reduction in male compared with female participants. Bars represent 95% CrI. (a) SGLT2i: point estimates for the trials meta-analysis and CPRD are reproduced from Dennis et al (2022) [6]. (b) GLP1-RA
Fig. 5
Fig. 5
Differences in short-term and long-term clinical outcomes with SGLT2i and GLP1-RA for subgroups defined by predicted HbA1c response differences. (a) Twelve month HbA1c change from baseline. (b) Twelve month weight change. (c) Six month risk of discontinuation. (d) HR for 5 year risk of new-onset microvascular complications (retinopathy, nephropathy or neuropathy). (e) HR for 5 year relative risk of MACE. (f) HR for 5 year risk of heart failure. HRs represent the relative risk for those treated with GLP1-RA in comparison with SGLT2i therapy, with a value under 1 favouring SGLT2i therapy. Data underlying the figure are reported in ESM Table 3. Bars represent 95% CrI

References

    1. Dennis JM. Precision medicine in type 2 diabetes: using individualized prediction models to optimize selection of treatment. Diabetes. 2020;69(10):2075–2085. doi: 10.2337/dbi20-0002. - DOI - PMC - PubMed
    1. Davies MJ, Aroda VR, Collins BS, et al. Management of hyperglycemia in type 2 diabetes, 2022. A consensus report by the American Diabetes Association (ADA) and the European Association for the Study of Diabetes (EASD) Diabetologia. 2022;65(12):1925–1966. doi: 10.1007/s00125-022-05787-2. - DOI - PMC - PubMed
    1. Cefalu WT, Kaul S, Gerstein HC, et al. Cardiovascular outcomes trials in type 2 diabetes: where do we go from here? Reflections from a diabetes care editors’ expert forum. Diabetes Care. 2018;41(1):14–31. doi: 10.2337/dci17-0057. - DOI - PMC - PubMed
    1. McGovern A, Feher M, Munro N, de Lusignan S. Sodium-glucose co-transporter 2 (SGLT2) inhibitor: comparing trial data and real-world use. Diabetes Ther. 2017;8:365–376. doi: 10.1007/s13300-017-0254-7. - DOI - PMC - PubMed
    1. Shields BM, Dennis JM, Angwin CD, et al. Patient stratification for determining optimal second-line and third-line therapy for type 2 diabetes: the TriMaster study. Nat Med. 2023;29:376–383. doi: 10.1038/s41591-022-02120-7. - DOI - PMC - PubMed

MeSH terms

Substances