. 2024 May;56(5):900-912.
doi: 10.1038/s41588-024-01665-2. Epub 2024 Feb 22.

Chromosome evolution screens recapitulate tissue-specific tumor aneuploidy patterns

Affiliations

Chromosome evolution screens recapitulate tissue-specific tumor aneuploidy patterns

Emma V Watson et al. Nat Genet. 2024 May.

Abstract

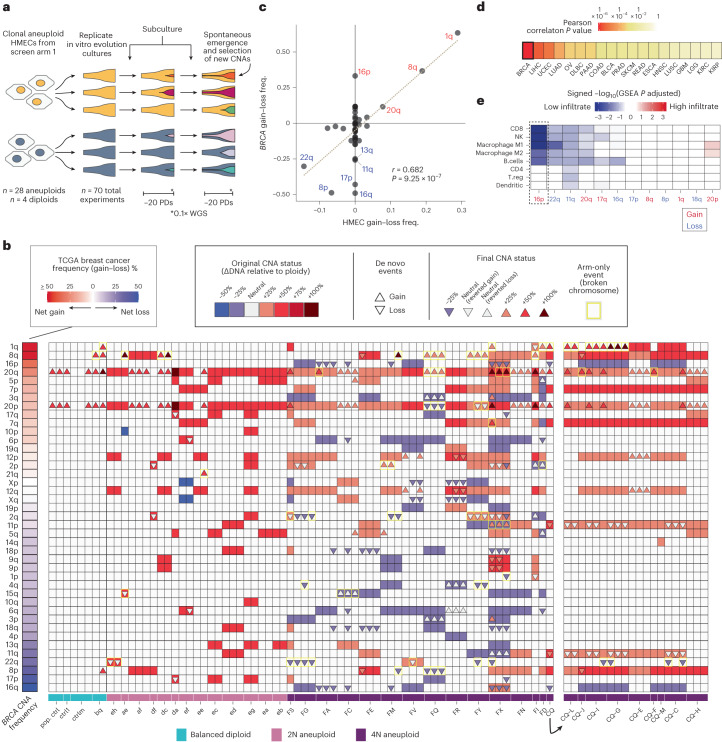
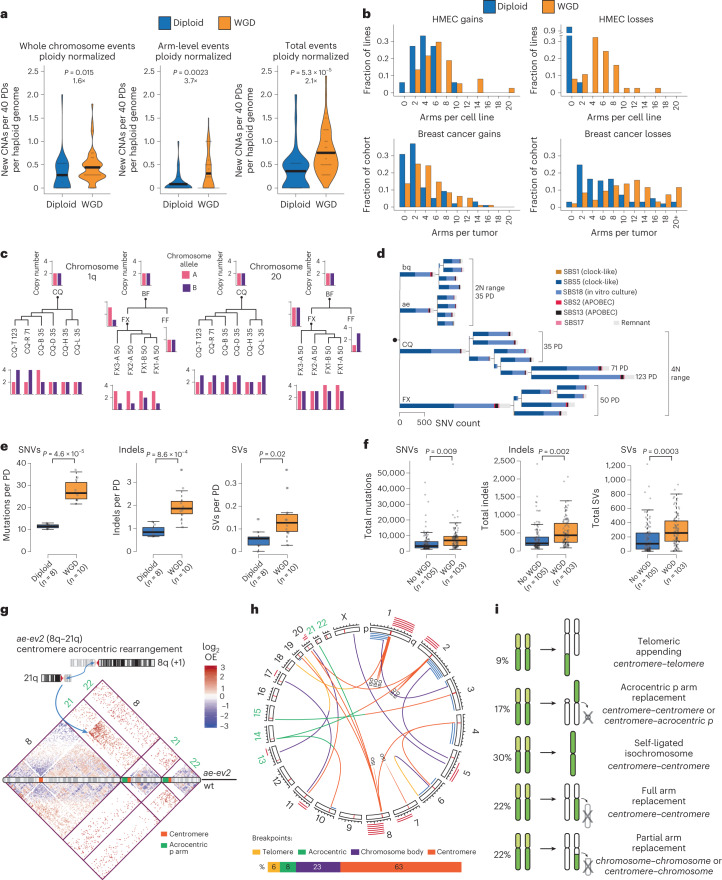
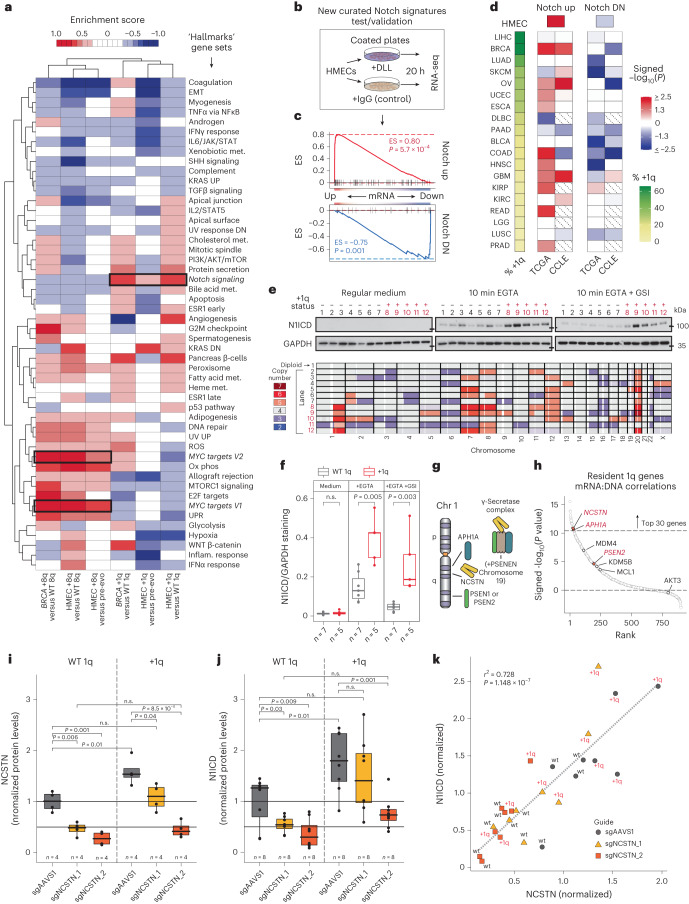
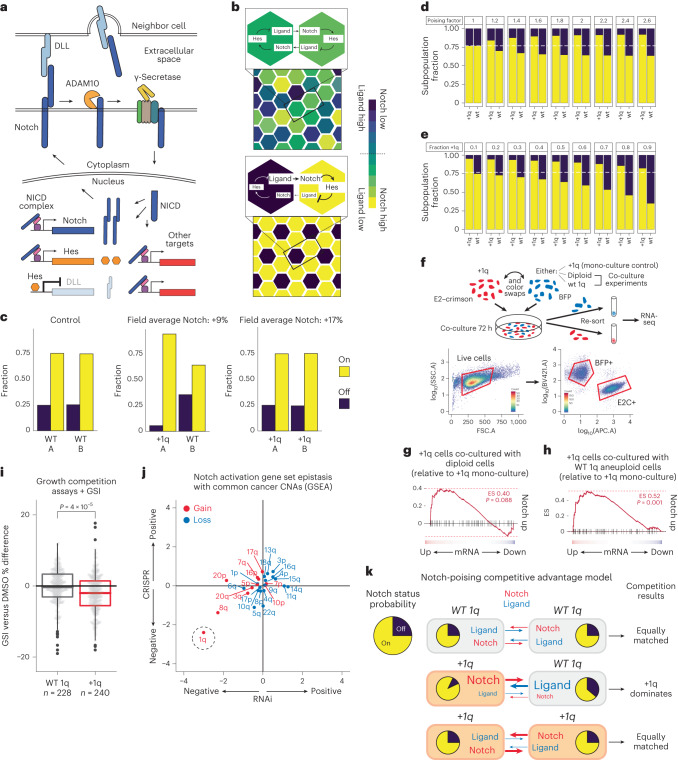
Whole chromosome and arm-level copy number alterations occur at high frequencies in tumors, but their selective advantages, if any, are poorly understood. Here, utilizing unbiased whole chromosome genetic screens combined with in vitro evolution to generate arm- and subarm-level events, we iteratively selected the fittest karyotypes from aneuploidized human renal and mammary epithelial cells. Proliferation-based karyotype selection in these epithelial lines modeled tissue-specific tumor aneuploidy patterns in patient cohorts in the absence of driver mutations. Hi-C-based translocation mapping revealed that arm-level events usually emerged in multiples of two via centromeric translocations and occurred more frequently in tetraploids than diploids, contributing to the increased diversity in evolving tetraploid populations. Isogenic clonal lineages enabled elucidation of pro-tumorigenic mechanisms associated with common copy number alterations, revealing Notch signaling potentiation as a driver of 1q gain in breast cancer. We propose that intrinsic, tissue-specific proliferative effects underlie tumor copy number patterns in cancer.


Conflict of interest statement

The authors declare no competing interests.

Figures

Fig. 1
Fig. 1. Whole chromosome aneuploidy screens in HMEC and RPTEC cell lines select cognate tumor type whole chromosome CNA patterns.
a, Whole chromosome aneuploidy screens. Diploid HMECs or RPTECs were treated with reversine (48 h). Cells recovered and proliferated for two PDs (5–7 days), then were cloned, karyotyped by WGS and banked as clonal cell lines. b,c, Copy number profiles for diploid- (top) and tetraploid-range (bottom) aneuploid clones from the screen for HMECs (b) and for diploid-range RPTECs (c). Groups indicate independent reversine-treated populations. Red, increased copy. Blue, decreased copy. Gray, neutral copy. d,e, Frequency correlations of whole chromosome gains in the TCGA breast cancer cohort (all subtypes) and the HMEC screens (d), including both diploids and tetraploids (average of two screen replicates), with Pearson’s correlation coefficient (r = 0.83) and associated P value (P = 1.39 × 10−6) shown, and RPTEC screens (e) with Pearson’s correlation coefficient (r = 0.79) and associated P value (P = 8.26 × 10−6) shown in comparison with the TCGA kidney cancer cohort. Dashed red lines indicate linear model fit of the data. f, Clustered heatmap of Pearson’s correlation coefficients (r) comparing whole chromosome gain frequencies across tumor types and in vitro HMEC and RPTEC screens. DLBC, diffuse large B cell lymphoma; n = 47. READ, rectal adenocarcinoma; n = 162. COAD, colon adenocarcinoma; n = 282. UCEC, uterine corpus endometrial carcinoma; n = 425. HNSC, head and neck squamous cell carcinoma; n = 522. LUSC, lung squamous cell carcinoma; n = 356. BRCA, breast invasive carcinoma; n = 722. ESCA, esophageal carcinoma; n = 184. BLCA, bladder urothelial carcinoma; n = 408. OV, ovarian serous cystadenocarcinoma; n = 576. KIRP, kidney renal papillary cell carcinoma; n = 272. KIRC, kidney renal clear cell carcinoma; n = 314. PAAD, pancreatic adenocarcinoma; n = 183. SKCM, skin cutaneous melanoma; n = 104. LUAD, lung adenocarcinoma; n = 446. LIHC, liver hepatocellular carcinoma; n = 370. PRAD, prostate adenocarcinoma; n = 420. GBM, glioblastoma; n = 521. LGG, low-grade glioma; n = 502. g, Percentage of the breast and kidney tumors with WGD (PCAWG cohort) (left) and percentage of HMEC or RPTEC clonal cell lines that went through WGD (right). P values derived from chi-squared tests. Source data
Fig. 2
Fig. 2. In vitro evolution of aneuploid HMEC lineages leads to convergent selection of breast cancer-associated arm-level CNAs.
a, Diagram of the in vitro evolution experiments with aneuploid and diploid HMEC clones. b, Heatmap summary of all original (first screen, solid squares) and newly selected (triangles) copy number events in long-term evolution experiments in diploid, 2N-range and 4N-range aneuploid HMECs, plotted by arm. The first (wider) column indicates copy number gain or loss frequencies in the breast cancer TCGA cohort. All subsequent columns represent independent in vitro evolution experiments grouped and labeled by clonal lineage and ploidy. Colors inside triangles indicate final copy number state after the newly acquired event. Diploid clone names are indicated by lowercase letters, and tetraploid clones are indicated by uppercase letters. True arm-level events that probably involve broken chromosomes are highlighted in yellow. Right of the heatmap includes a summary of the evolution experiments in daughter subclones of clone CQ. c, Correlation between true arm-level event frequencies in the HMEC in vitro evolution screen (n = 90 in vitro evolution experiments; gain minus loss frequencies) and breast cancer arm-level event frequencies (TCGA cohort, n = 722). Pearson’s correlation coefficient (r = 0.68) and associated P value (P = 9.25 × 10−7) are shown. Dashed gray line indicates linear regression model of the data. d, Heatmap of Pearson’s correlation P values from comparisons of chromosome arm-level gain minus loss frequencies in evolved HMECs and various solid tumors (see Fig. 1f legend for tumor type abbreviations and numbers of patient samples). e, Transcriptomic GSEA-based immune infiltrate analysis by immune cell type for breast cancers with various CNAs (TCGA database). Gain of 16p (which is not selected in vitro but is frequent in breast cancer) is significantly associated with reduced CD8 T-cell, natural killer (NK) cell and macrophage signatures. P values are calculated by assessing the frequency with which the enrichment score of a gene set in a ranking exceeds that of random ranking permutation (10,000 permutations) and is adjusted for multiple gene sets testing. T.reg, regulatory T cells. Source data
Fig. 3
Fig. 3. WGD enhances genomic variation.
a, Ploidy-normalized CNA acquisition rates (per 40 population doublings) in 2N- and 4N-range aneuploids during in vitro evolution. Acquired whole chromosome (left), arm-level (middle) and total (sum of both) (right) events are quantified. P values calculated from two-sided Wilcoxon tests. Fold changes of rates between diploid and WGD are also shown. Thick black lines indicate mean rates. b, Distributions of arm gains (left) and losses (right) per in vitro-evolved HMEC line (top) and across breast cancers (bottom). Whole chromosome gains/losses are counted as two arms. c, Haplotype-resolved CNAs deduced from variant allele frequencies in deep WGS for two evolved tetraploid lineages (CQ and BF) reveal no absolute allelic preferences for selection of +1q (left) or +20 (right). d, Reconstructed phylogenetic tree from shared and private base substitutions in four evolved clonal lineages. Length of branches corresponds to the number of newly acquired base substitutions. Colors indicate mutational signature composition. e, Rates of mutation (SNVs), indel and non-centromeric SV acquisition in 2N- and 4N-range HMEC lineages per population doubling (gray dots). P values calculated from two-sided Wilcoxon tests. f, Total SNVs, indels and non-centromeric SVs in WGD compared to non-WGD breast cancers (gray dots) in the PCAWG dataset. P values calculated from two-sided t-tests. g, Schematic diagram of an acrocentric translocation that mediates gain of 8q through fusion to 21q in clone ae-ev2, with 21q remaining neutral (top). Hi-C heatmap of observed/expected values (log2 transformed) spanning chromosomes 8, 21 and 22 (upper triangle, ae-ev2; bottom triangle, diploid control) (bottom). The blue arrows highlight the fusion event and the corresponding increase in Hi-C contacts. h, Circos plot showing all CNA-facilitating translocations detected in this study (top). Individual CNA events are plotted as red (gain) and blue (loss) bars with translocations colored by location (telomere, yellow; acrocentric, green; chromosome body, purple; centromere, orange). Acrocentric chromosomes are labeled with green. Percentages of SV breakpoints involving different chromosomal regions (bottom). ISO, isochromosome. i, Schematic diagrams and percentage of occurrences of the five main categories of events observed during in vitro evolution that facilitated arm-level CNA formation. Source data
Fig. 4
Fig. 4. Multiple cancer-associated aneuploidy events can significantly improve growth rate.
a,b, Correlation of growth rates (PDs per day) for HMEC (a) and RPTEC (b) aneuploid clones compared to average CNA frequencies in cognate tumor types, breast cancer (a) and renal cancer (b). Parental diploid population growth rates are indicated by horizontal dotted black lines, ± standard error of the mean (green shading). a, Pearson’s correlation coefficient squared (r2 = 0.60) and associated P value (P = 0.070) are shown. Dashed line indicates linear regression model of the data. b, Pearson’s correlation coefficient squared (r2 = 0.26) and P = 0.078. c, Growth rates of evolved lineages that gained combinations of +20, +8q and/or +1q compared to pre-evolved isogenic ancestors. P values calculated from two-sided Wilcoxon tests. Solid black line indicates median diploid control growth rate. rev, reversion. d, Correlation of the growth rate differences (D, delta) between evolved and ancestor clones, relative to ancestor clone growth rate. Colors indicate time to clonal sweep of CNAs (in PDs). Plus signs indicate copies gained (one plus sign, one copy). Pearson’s correlation coefficient squared (r2 = 0.80) and associated P value (P = 0.016) are shown. Dashed gray line indicates linear regression model of the data. e, Bar graphs showing Hallmark GSEA scores (signed −log10(false discovery rate)) of differentially expressed gene sets in newly aneuploidized (pre-evolved) clones (dark blue) and in post-evolved aneuploids (light blue), each compared to diploid controls. All copy number-specific effects on gene expression were normalized before analysis. Gene sets with differential expression are grouped on the basis of their relative behavior in pre- and post-evolved aneuploid cells. EMT, epithelial-to-mesenchymal transition; Ox. phos., oxidative phosphorylation; UV, ultraviolet. Source data
Fig. 5
Fig. 5. The +1q is associated with increased Notch activation in vitro and in human tumors due to increased γ-secretase gene dosage on 1q.
a, Hallmark GSEA profile clustering of +1q or +8q HMECs and breast cancers relative to WT counterparts. MYC and Notch gene sets outlined in black. ROS, reactive oxygen species; met., metabolism; DN, down; UPR, unfolded protein response; Inflam., inflammatory; EMT, epithelial-to-mesenchymal transition; Ox phos, oxidative phosphorylation; UV, ultraviolet. b, Diagram of ligand-based Notch activation assay. DLL, DLL1 + DLL4 recombinant protein. c, Curated Notch activation and repression gene set enrichment in HMECs after 20 h ligand exposure. GSEA scores (0.80 and −0.75) and associated P values (P = 5.7 × 10−4 and P = 0.001) are shown, respectively, for Notch activation (up) and repression (DN) sets. d, Signed −log10 P values from GSEA with curated Notch gene sets for +1q versus WT 1q differential expression rankings across tumor types, sorted by prevalence of +1q. Cancer types with <10 samples in the CCLE not included (hatched squares). DN, down. e, Western blots (top) showing cleaved NOTCH1 (N1ICD) in +1q and WT 1q HMEC lines (bottom) in response to calcium depletion (4 mM EGTA, 10 min), ±GSI (5 μM L-685,458, pre-incubated for 30 min). GAPDH shown as loading control. f, Quantification of N1ICD (e), normalized to GAPDH. P values calculated from two-sided Wilcoxon test. g, Diagram of the γ-secretase complex and gene locations on 1q. h, Ranked 1q-resident gene mRNA/DNA correlations (signed −log10 P value from Pearson’s correlations) in matched tumor/normal BRCA samples. γ-secretase genes labeled red. Other proposed drivers of 1q are also shown. i,j, Western blot quantification of NCSTN protein (i) and N1ICD (j) in diploid (WT 1q) and +1q HMECs infected with lentivirus containing either control (sgAAVS1) or NCSTN-targeting CRISPR guides and treated with EGTA for 10 min. NCSTN and N1ICD levels were normalized to GAPDH, and NCSTN/GAPDH and N1ICD/GAPDH ratios were normalized to the average ratio of sgAAVS1 WT 1q cells. P values were calculated from two-sided t-test, not corrected for multiple testing. n.s., not significant. k, Correlation between NCSTN and N1ICD protein levels in each sample quantified in i and j. Pearson’s correlation coefficient squared (r2 = 0.73) and associated P value (P = 1.15 × 10−7) are shown. Dashed line indicates linear regression model of the data. Source data
Fig. 6
Fig. 6. A model for +1q-driven Notch poising.
a, Diagram of the Notch signaling pathway. b, In silico simulations of Notch lateral inhibition in a 40 × 40 field of cells (see Supplementary Video 1). The simulation starts with randomly assigned Notch status (top) and is run over 1,000 min, which generates a Notch-on/Notch-off pattern across the field of cells (bottom). c, Results of simulations of mono-cultured WT (left), +1q (right) and co-cultured (middle) populations with respect to Notch activation status. Cells are randomly assigned to group A or B. The fraction of cells after simulation with N1ICD >0.5 (on) and N1ICD <0.5 (off) for groups A and B is shown. WT 1q poising factor = 1. +1q poising factor = 2.2 (based on experiments in Fig. 5e). d, Simulations varying the Notch-poising factor. e, Simulations varying the proportion of +1q and WT 1q co-cultured subpopulations. f, Co-culture experimental design to test dominant lateral inhibition as predicted by modeling (top). Gating strategy for sorting BFP- and E2–crimson-tagged populations after co-culture (bottom). g,h, Expression of the Notch activation signature in +1q HMECs co-cultured with diploid HMECs compared to mono-cultured +1q HMECs, with GSEA score (0.40) and associated P value (P = 0.088) (g), and co-cultured with WT 1q aneuploid HMECs with GSEA score (0.52) and P value (P = 0.001) (h). i, The fraction of viable WT 1q (blue) or +1q (red) cells in co-culture with WT 1q cells ± GSI (2 μM L-685,458, 72 h). DMSO, dimethyl sulfoxide (control). j, DepMap analysis of epistasis between common arm-level CNAs and the Notch activation gene set, in RNAi (x axis) and CRISPR (y axis) datasets. Genes were ranked based on their effect score correlation to CNA status. GSEA was then performed for each CNA-based epistasis ranking using the Notch activation signature. Cancer cell lines derived from tumor types with high frequencies of +1q were used for this analysis (breast carcinoma, lung adenocarcinoma and liver hepatocellular carcinoma). k, Model for +1q-driven Notch poising and increased juxtracrine competition. As +1q subclones encounter WT 1q cells, they occupy mostly Notch-on states, providing growth advantage. Source data
Extended Data Fig. 1
Extended Data Fig. 1. Establishment of aneuploid cell lines from HMECs and RPTECs.
(a) Distributions of mRNA log2FC for Breast-specific (n = 44), Kidney-specific (n = 190), and non-specific (n = 11691) genes in RPTECs vs HMECs (left) and in KIRC vs BRCA tumors (right). RNA-seq data for RPTECs and HMECs generated in this study; RNA-seq data for human tumors is from the TCGA database. Breast- and Kidney-specific genes were annotated by the Human Protein Atlas. (b) Scatter plots of mRNA log2FC values from the differential expression analysis in (a). P value (P = 4.4 × 10−257) calculated from linear regression analysis. (c) Low-coverage DNA-seq pipeline for copy number calling. Read counts of raw sequencing data in 100 kb bins is shown after each step of the data analysis pipeline, and final inferred copy number states. (d) Single-cell profiles of hTERT-HMECs treated with reversine for 48 hours, clustered by Euclidean distance. (e) Single-cell profiles of hTERT-RPTECs treated with reversine for 48 hours, clustered by Euclidean distance. (f) Bright field images (left) and propidium iodide staining FACs analysis (right) of the hTERT-HMEC parental population (top) and a tetraploid-range clone (bottom). Gating strategy for G1 population and parameter extraction shown. (g) Density plots of PI fluorescence (x-axis) corresponding to scatterplots in (f). (h) Tetraploid HMEC clones are larger in size than diploid clones based on image analysis from a group of 43 representative clones. (i) Mean forward scatter (x-axis) and G1 peak PI fluorescence of HMEC aneuploid clones normalized to parental diploids from both control and reversine-treated populations (top). Tetraploids form a separate cluster. Same is shown for RPTEC clones (bottom; one HMEC tetraploid is included for comparison). (j) Copy number profiles of clones selected from HMEC tetraploid screens, replicate #1 (top) and replicate # 2 (bottom), clustered by Euclidean distance. Clone names from this set start with ‘F’ (that is FA, FB, FC, etc.). (k) Copy number profiles of diploid HMEC screen replicate #2. (l) Copy number profiles of diploid RPTEC screen replicate #2. Source data
Extended Data Fig. 2
Extended Data Fig. 2. Screen replicate and mis-segregation frequency comparisons.
(a) Correlation between HMEC screen replicates (top), and between RPTEC screen replicates (bottom) with respect to whole chromosome gain frequency. Pearson’s correlation coefficient squared (top: r2 = 0.79, bottom: r2 = 0.37) and associated P value (top: P = 1.84 × 10−8, bottom: P = 2.24 × 10−3) are shown. Dashed line indicates linear regression model of the data. (b) Top: Correlation between HMEC screen gain selection frequency (average of two screens) and HMEC chromosome mis-segregation frequency with reversine treatment at 48 h. Bottom: Correlation between RPTEC screen gain selection frequency (average of two screens) and RPTEC chromosome mis-segregation frequency with reversine treatment at 48 h. Pearson’s correlation coefficient squared (top: r2 = 0.005, bottom: r2 = 0.002) and associated P value (top: P = 0.74, bottom: P = 0.84) are shown. Dashed line indicates linear regression model of the data. (c) Top: Correlation between HMEC chromosome mis-segregation frequency (this study) and RPE1 cell line chromosome mis-segregation frequency (Klaasen et al 2022). Bottom: Correlation between RPTEC chromosome mis-segregation frequency (this study) and RPE1 cell line chromosome mis-segregation frequency (Klaasen et al 2022). Pearson’s correlation coefficient squared (top: r2 = 0.53, bottom: r2 = 0.3) and associated P value (top: P = 8.74 × 10−5, bottom: P = 6.34 × 10−3) are shown. Dashed line indicates linear regression model of the data. Source data
Extended Data Fig. 3
Extended Data Fig. 3. Individual comparisons between in vitro chromosome gain frequencies and human tumor gain frequencies.
Corresponding to Fig. 1f. Frequencies of whole chromosome gains in HMEC screens (average of screen 1 and screen 2) compared to various tumor type frequencies (left). The same is plotted for RPTEC screen comparisons on the right. HMEC screen amplification frequencies compared to RPTEC screen amplification frequencies is shown in the top middle panel. Pearson’s correlation coefficient squared (r2) and associated P value are shown. Dashed lines indicate linear regression models of the data. Source data
Extended Data Fig. 4
Extended Data Fig. 4. The CNA landscapes of tumors.
(a) Stacked bar plot showing the average number of genes affected by whole chromosome, arm-level, and all other types of events across various solid tumor types. (b) Table showing raw values associated with (a), left, and percentages, right, of total number of genes affected by CNAs on average by CNA type. Source data
Extended Data Fig. 5
Extended Data Fig. 5. Evolution of clonal HMEC lineages in long-term culture.
(a) Copy number plots for 2 pure diploid HMEC clones, one diploid clone mix, and 12 2N-range aneuploid HMEC clones grown in culture over time. The top bar of each panel represents the original clonal copy number profile (PD0). Most clones were grown in multiple replicate cultures, for up to 40 population doublings. Several lineages were propagated longer than 40 PDs. (b) Copy number plots for 13 4N-range aneuploid HMEC clones grown in culture over time. The top bar of each panel represents the original clonal copy number profile (PD0). Clones were grown in duplicate or triplicate for most lineages, for up to 40 population doublings. (c) Copy number plots for CQ daughter clone in vitro evolution experiments. Same color bar as for (b). (d) Net chromosome arm gain/loss frequencies after in vitro evolution experiments (newly selected events only) compared to net gain/loss frequencies in the breast cancer TCGA cohort. Whole chromosome aneuploidies are also counted towards net gain/loss frequencies plotted by arm. For the HMEC frequency calculations, each copy comprising multi-copy events are counted towards the total events, and net event sums are divided by the total number of evolved lineage experiments (n = 90). For breast cancer frequency calculations, at least 50% of the arm must be gained/lost to count as an arm-level event. BRCA; n = 722 samples. Pearson’s correlation coefficient (r = 0.574) and associated P value (P = 8.84 × 10−5) for the correlation are shown. Dashed line indicates linear regression model of the data. 16p is highlighted for its opposite behavior in HMECs (deleted as part of whole chromosome 16 loss) and breast cancers (gained), however +16p is associated with immune evasion tumors (see Fig. 2e). Source data
Extended Data Fig. 6
Extended Data Fig. 6. Mutations observed in pre- and post-evolved HMEC lineages.
(a) A circos plot displaying variants detected in parental HMEC diploid line. Variants were annotated using germline SNP information and those with minor allele frequency greater than 0.001 in human population were filtered out. From outmost to inmost track: chromosomal ideogram, base substitutions with its variant allele frequencies, copy number profile, and structural variations are shown. Detailed mutational information is provided in Supplementary Table 1 − 3. (b) A circos plot describing all variants from 24 HMEC clones after in vitro evolution. (c) Heatmaps indicating SNP concordance between aneuploid clones analyzed by deep WGS for chromosome 20 (left) and 1q (right). On the x axis, the clones are grouped according to their lineages, which are displayed by dendrograms. Circles on the dendrogram indicates parental clones, and the other branches indicate phylogeny of daughter clones. On y axis, clones were clustered based on concordance of SNP allelic frequencies residing in the chromosomes of interest. Heatmaps were colored using the fraction of shared, amplified SNPs between the clones. Self-comparisons excluded (black squares). (d) Spectrum of genome-wide base substitutions in 96 possible trinucleotide contexts across all sequenced HMEC clones. (e) Linear decomposition of the observed spectrum using the ICGC/PCAWG-derived mutational signature catalogue. Two mutational signatures related to in vitro culture process explain a large majority of mutations acquired during the evolution. (f) Spectrum of genome-wide base substitutions in 96 possible trinucleotide contexts in diploid HMEC clones. (g) As in (c) but for tetraploid HMEC clones. Cosine similarity between diploid and tetraploid profiles was 0.986. (h) Overlaps of breakpoint positions of acquired SVs with various epigenomic features. We used publicly available epigenomic datasets for the HMEC cell line, except for replication timing dataset which was from the MCF7 breast cancer cell line. To account for the uncertainty of observed values, each error bar is calculated based on a Poisson test. Observed values and their 95% confidence interval are available in Source Data. P values derived from goodness of fit test by Chi-square without multiple testing correction. (i) Ploidy-adjusted rates of mutations, indels, and non-centromeric SVs in diploid- and tetraploid-range HMECs. P values calculated from two-sided Wilcoxon test. (j) Ploidy-adjusted counts of mutations, indels, and non-centromeric SVs in breast tumors in the PCAWG dataset. P values calculated from two-sided t-tests. Source data
Extended Data Fig. 7
Extended Data Fig. 7. Mapping SVs with low-coverage Hi-C and Giemsa staining.
(a) Top: Copy number plot for clone CQ-ev-H. Bottom: raw read mapping data from deep WGS analysis showing evidence for an 11q-17q translocation breakpoint, which facilitates copy number gains of 11p and 17q. (b) Hi-C plots for chromosomes 11 and 17 in the CQ-ev-H clone (top triangle of diamond) and diploid control (bottom triangle of diamond). Each pixel represents the log2 observed vs expected interaction between a pair of 1 Mb bins (see Methods). Only bins with >1 read are included in the analysis. Since the average number of bin interactions in trans-chromosome interaction space is less than 1, all colored pixels in trans-chromosome interaction space have a positive value. Log2 ratios are capped at +3 or −3. The two diamonds to the right are zoom-ins of the 1 Mb region centered on the known translocation, re-binned at 10 kb. The known translocation is indicated by the dotted line. The chromosome 11-17 translocation is automatically detected from Hi-C data by a modified version of the HiNT algorithm (far right panel). ES = enrichment score (HiNT score of mutant/ HiNT score of diploid control). (c) Sparse Hi-C mapping of two centromeric translocations in the evolved HMEC FQ lineage. (d) Sparse Hi-C mapping of a centromeric translocation in the evolved HMEC FY lineage. (e) Schematic diagram of fold-back inversion identified by deep WGS resulting in an imbalance on chromosomes 1 and 3 in clone FX-ev2-A. (f) Giemsa staining and karyotyping of the normal diploid HMEC clone bq. A karyotype summary of five profiled cells from each is shown on the right. (g) Giemsa staining and karyotyping of the evolved 2N-range aneuploid clone dc-ev2 that gained two copies of 8q. (h) Giemsa staining and karyotyping of an evolved 4N-range aneuploid from the CQ series that gained 4 copies of 1q. Isochromosomes were suspected based on 1q gain dynamics (occurring in multiples of two) and a lack of evidence of trans-fusions in Hi-C. Copy number plots based on WGS for each line are shown as bars above the G-banding images. Source data
Extended Data Fig. 8
Extended Data Fig. 8. RNA-seq analysis of HMEC diploid- and tetraploid-range aneuploid cell lines.
(a) Gene expression is directly related to copy number, as shown by mRNA log2 fold changes (log2FC) of ten 2N-range aneuploid cell lines compared to control diploids (three replicates per line). Each dot is a gene ordered by genomic position and colored according to the known DNA copy number, with DNA copy number profiles above each plot for reference. The distribution plots to the right of each panel indicate the log2FC in mRNA levels for all genes representing each ploidy state in the aneuploid cell line. Lines indicate where mRNA expression would be expected if totally concordant with DNA log2FC from baseline ploidy. Clones from the same aneuploid lineage are boxed together (that is ancestor clone and evolved population). (b) Gene expression plots as in a), but for 4N-range aneuploid clones. (c) Gene expression plots for several CQ lineage daughter clones, pre- and post-evolved (top and bottom plots in each box). (d) Summary of all RNA-seq data for 2N-range aneuploid HMEC clones in (a) normalized to diploid controls. Log2FC distributions of genes on chromosomes with copy number 1, 2, 3, or 4. (e) Summary of all RNA-seq data for 4N-range aneuploid HMEC clones in (b-c) normalized to diploid controls. Log2FC distributions of genes on chromosomes with ploidies 3, 4, 5, 6, 7, or 8. Source data
Extended Data Fig. 9
Extended Data Fig. 9. +1q and +8q associated gene expression changes in HMECs and breast tumors.
(a) HMEC lines were grouped according to +1q (top) or +8q (bottom) status and differential gene expression analysis was performed. mRNA log2 fold changes are plotted for all expressed genes across the genome. Panels on the right show the distributions of log2FCs for resident genes on 1q (top) or 8q (bottom) compared to all other genes. (b) Same analysis as in (a) but for TCGA breast cancer samples. (c) Gene set enrichment analysis of +1q and +8q tumors in each major breast cancer subtype, and across the entire cohort (‘All’). Genes were ranked based on their differential expression in +1q or +8q tumors within each subtype. The Hallmarks gene sets were used. Colors indicated signed negative log10 P values from GSEA. (d) Top: +1q or WT 1q HMECs were exposed to ligand (DLL1 + DLL4 combined 2.5 µg/ml + fibronectin, coated plates), or ligand + GSI (2 μM L-685,458) for 20 h. Control plates (no ligand) were coated with 2.5 µg/ml human IgG + fibronectin. RNA-seq analysis was performed and average log2FC of Notch Activation gene set is plotted for each condition relative to diploid control conditions. +1q HMECs display increased Notch activation capacity when incubated for 20 h on ligand-coated plates, and increased residual Notch activation when GSIs are added. P values calculated from two-sided t-test. Bottom: WT 1q and +1q cell lines used in this experiment. (e) Correlation between mRNA log2FC and DNA log2FC in matched tumor-normal breast cancer TCGA data for the three γ-secretase genes on 1q. P values calculated from linear regression analysis. Dashed lines indicate linear regression models of the data. (f) Expression levels for resident 1q γ-secretase genes APH1A, PSEN2, and NCSTN in +1q and WT 1q HMECs. P values calculated from two-sided t-test. (g) A total of four replicate experiments were performed comparing NCSTN knockdown in WT 1q and +1q HMEC lines. NCSTN (first and third panels) and N1ICD (second and fourth panels) were blotted from lysates of cells treated with EGTA for 10 min. N1ICD imaging required 10x longer exposure. Source data
Extended Data Fig. 10
Extended Data Fig. 10. +1q mediated Notch poising.
(a) Matrix of clone vs clone co-culture +/− GSI experiments summarized in Fig. 6i. Average of three biological replicate experiments is shown for each co-culture experiment. (b) Copy number profiles of cell lines utilized in co-culture experiments in a) and c). (c) Absolute growth rates of WT 1q (blue) or +1q (red) aneuploid cells when co-cultured with either: diploid cells, WT 1q aneuploid cells, pre-1q gain isogenic ancestor cells, or +1q aneuploid cells. The left panel is without GSI, the right panel is + GSI (2 μM L-685,458). Log2FC growth rates relative to mono-culture are shown. P values calculated from two-sided t-tests. (d) Gene set enrichment plots for +1q-associated differential gene effect score rankings in breast cancer cells lines in the DepMap CRISPR (top) and RNAi (bottom) datasets using the curated Notch Activation gene set. P values and normalized enrichment scores (NES) calculated from GSEA. (e) Diagram illustrating potential implications of +1q Notch poising for tumor evolution. As +1q subclones emerge, they encounter mostly WT 1q cells and thus occupy fully Notch-ON states, providing growth advantage. As +1q cells take over, they run out of WT 1q cells to occupy Notch-OFF states and supply ligand and must occupy both Notch-ON and Notch-OFF states, diminishing the growth advantage. Source data

References

    1. Sheltzer JM, et al. Single-chromosome gains commonly function as tumor suppressors. Cancer Cell. 2017;31:240–255. doi: 10.1016/j.ccell.2016.12.004. - DOI - PMC - PubMed
    1. Tang Y-C, Amon A. Gene copy-number alterations: a cost-benefit analysis. Cell. 2013;152:394–405. doi: 10.1016/j.cell.2012.11.043. - DOI - PMC - PubMed
    1. Torres EM, et al. Effects of aneuploidy on cellular physiology and cell division in haploid yeast. Science. 2007;317:916–924. doi: 10.1126/science.1142210. - DOI - PubMed
    1. Ohashi A, et al. Aneuploidy generates proteotoxic stress and DNA damage concurrently with p53-mediated post-mitotic apoptosis in SAC-impaired cells. Nat. Commun. 2015;6:1–16. doi: 10.1038/ncomms8668. - DOI - PMC - PubMed
    1. Stingele S, et al. Global analysis of genome, transcriptome and proteome reveals the response to aneuploidy in human cells. Mol. Syst. Biol. 2012;8:608. doi: 10.1038/msb.2012.40. - DOI - PMC - PubMed