. 2024 Mar;26(3):393-403.
doi: 10.1038/s41556-024-01353-7. Epub 2024 Feb 22.

Drosophila TMEM63 and mouse TMEM63A are lysosomal mechanosensory ion channels

Affiliations

Drosophila TMEM63 and mouse TMEM63A are lysosomal mechanosensory ion channels

Kai Li et al. Nat Cell Biol. 2024 Mar.

Abstract

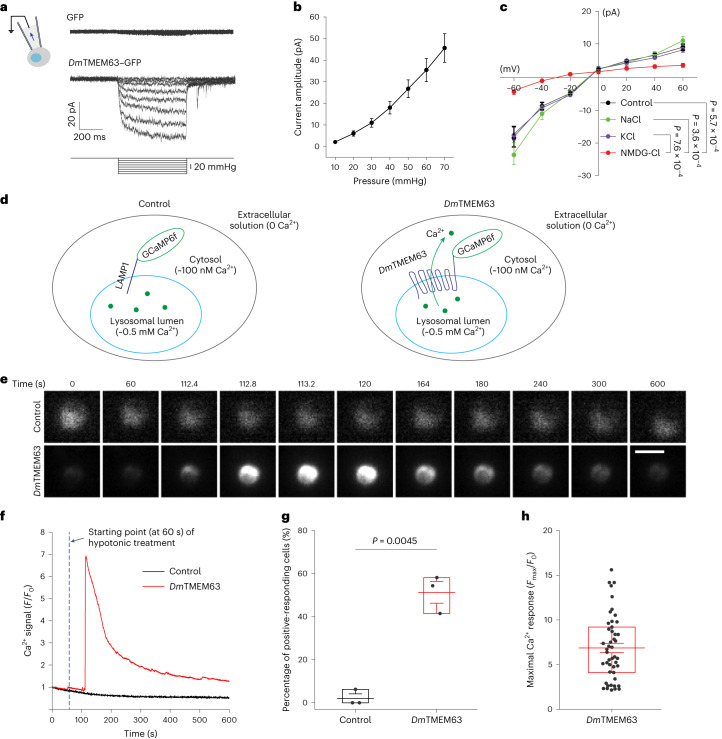
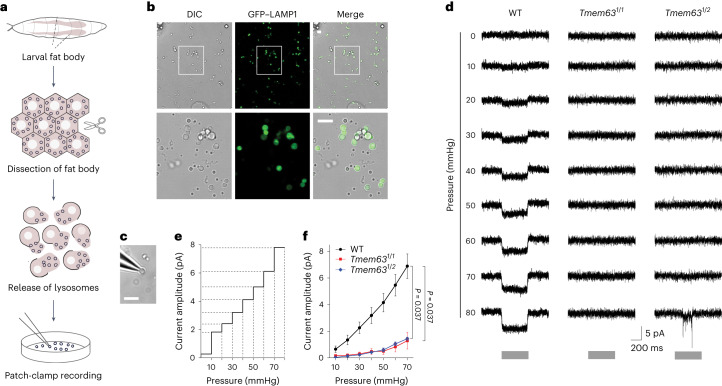
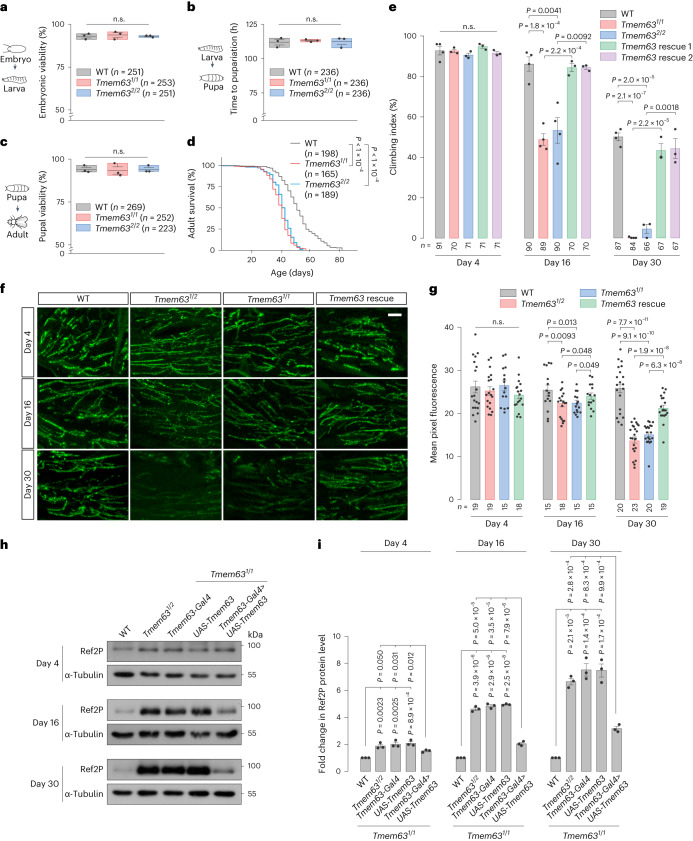
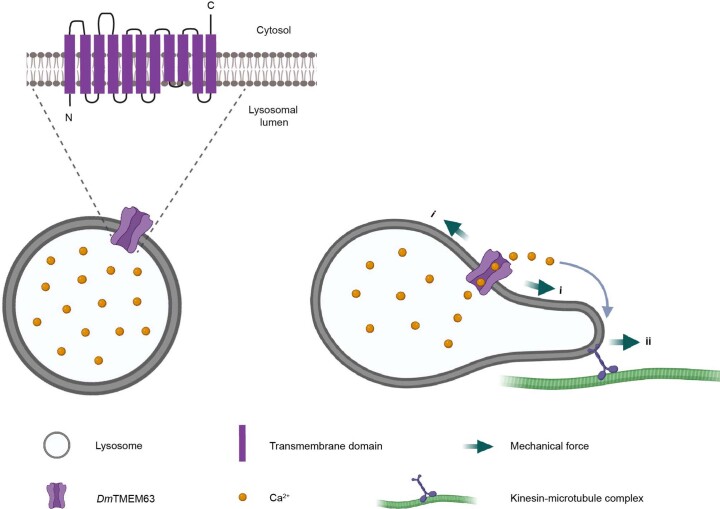
Cells sense physical forces and convert them into electrical or chemical signals, a process known as mechanotransduction. Whereas extensive studies focus on mechanotransduction at the plasma membrane, little is known about whether and how intracellular organelles sense mechanical force and the physiological functions of organellar mechanosensing. Here we identify the Drosophila TMEM63 (DmTMEM63) ion channel as an intrinsic mechanosensor of the lysosome, a major degradative organelle. Endogenous DmTMEM63 proteins localize to lysosomes, mediate lysosomal mechanosensitivity and modulate lysosomal morphology and function. Tmem63 mutant flies exhibit impaired lysosomal degradation, synaptic loss, progressive motor deficits and early death, with some of these mutant phenotypes recapitulating symptoms of TMEM63-associated human diseases. Importantly, mouse TMEM63A mediates lysosomal mechanosensitivity in Neuro-2a cells, indicative of functional conservation in mammals. Our findings reveal DmTMEM63 channel function in lysosomes and its physiological roles in vivo and provide a molecular basis to explore the mechanosensitive process in subcellular organelles.


Conflict of interest statement

The authors declare no competing interests.

Figures

Fig. 1
Fig. 1. DmTMEM63 localizes to lysosomes.
a, Representative images showing the expression patterns of the DmTMEM63 proteins and organellar markers in S2 cells. b, Quantification of the co-localization between DmTMEM63 and lysosome (n = 11 cells), mitochondrion (n = 10 cells) or peroxisome (n = 10 cells). Data shown are mean ± s.e.m. c, Schematic representation of the genomic locus of Tmem63 in WT and DmTmem63FP (FP, fluorescent protein) knock-in flies. GFP or mCherry was inserted to follow the last amino acid of the endogenous DmTMEM63 protein. The green triangle and blue bar indicate the start codon and stop codon, respectively. d, Immunoblots of head extracts in WT, DmTmem63GFP and DmTmem63mCherry flies showing the presence of full-length fusion proteins. e, Co-localization of DmTMEM63 proteins with lysosomal markers in VNC motor neurons and fat bodies of the wandering-stage DmTmem63mCherry fly larvae. Lysosomes were labelled by GMR51B08-Gal4-driven Spin–GFP or Cg-Gal4-driven GFP–LAMP1. f, Representative images showing the expression of DmTMEM63 proteins and LysoTracker-Red signals in the fat body of the DmTmem63GFP wandering-stage larvae. LysoTracker-stained acidic organelles. For df, the results are representative of three independent experiments. For e and f, dashed lines indicate a single cell within the tissues. Scale bars, 5 µm (a,e and f). Numerical data and unprocessed blots are available as Source data. Source data
Fig. 2
Fig. 2. DmTMEM63 is a mechano- and osmo-sensitive channel.
a, Representative MS current traces recorded from S2 cells expressing GFP or DmTMEM63–GFP at a holding potential of −80 mV. b, Dose-dependence curve of stretch-induced currents. n = 9 cells. c, IV curves of MS currents recorded in S2 cells expressing DmTMEM63–GFP. Currents were evoked by pressure at −45 mmHg. Control (n = 11 cells) is the standard pipette solution, and NaCl (n = 13 cells), KCl (n = 10 cells) and NMDG-Cl (n = 7 cells) indicate pipette solution consisting NaCl, KCl and NMDG-Cl, respectively (Methods). d, A schematic showing the strategy of lysosomal calcium imaging. S2 cells expressing GCaMP6f-fused LAMP1 (control group) or GCaMP6f-fused DmTMEM63 (DmTMEM63 group) were perfused with Ca2+-free hypotonic solution (160 mOsm l−1) revealing Ca2+ efflux from lysosomes. The estimated Ca2+ concentrations in the lysosomal lumen and cytosol are indicated. e,f, Representative time-lapse images (e) and Ca2+ intensity traces (f) showing the GCaMP6f signals in response to hypotonic treatment. Scale bar, 10 µm. g, Percentage of cells responsive to hypo-osmolarity in control (n = 34 cells) or DmTMEM63 (n = 89 cells). Ca2+ intensity increases by over 70% were considered as positive-responding cells in three independent experiments. h, The maximal Ca2+ signals of positive-responding cells in the DmTMEM63 group. n = 47 cells. Data shown are mean ± s.e.m. (b,c). In c, the statistical significance was determined by two-sided Mann–Whitney test and the P values at −60 mV are shown. In g, the statistical significance was determined by unpaired two-sided Student’s t-test. In g and h, lines represent the mean, bounds of box edge the interquartile range, and whiskers indicate the range of standard error. Numerical data are available as Source data. Source data
Fig. 3
Fig. 3. DmTMEM63 mediates lysosomal mechanosensitivity.
a, Schematic of the experimental procedure for patch-clamp recording from native lysosomes of the Drosophila fat body. Fat bodies were dissected from late-L3 stage larvae. Lysosomes were released from broken fat body cells and placed on the coverslips for recording. b, Top: images showing the lysosomes (GFP–LAMP1-positive vesicles) on the recording coverslip. Bottom: a magnified view of the boxed region. DIC, differential interference contrast. c, An image showing a patch-clamped lysosome on the tip of a recording pipette. d, MS currents of the lysosomal membranes in response to negative pressure in lysosome-attached patch-clamp configuration. Lysosomes were isolated from WT flies and Tmem63 mutants, respectively. Pressures were applied from −10 to −80 mmHg (10 mmHg per step) at a holding potential of −60 mV. Grey bars indicate the time duration of the pressure clamp. e, A surface plot showing the current responses of a single lysosomal patch. f, Group data of the dose-dependence curve of the MS currents. (WT, n = 6 lysosomes; Tmem631/1, n = 3 lysosomes; Tmem631/2, n = 3 lysosomes). Data shown are mean ± s.e.m. The statistical significance was determined by two-sided Mann–Whitney test, and the P values at −70 mmHg were shown. Scale bars, 5 µm (b and c). Numerical data are available as Source data. Source data
Fig. 4
Fig. 4. Alternation of DmTMEM63 expression remodels lysosomal morphology.
ad, Images (a and c) and quantifications (b and d) of lysosomes (marked by GFP–LAMP1) in fat body cells of the mid L3-stage WT or Tmem63 mutant larvae under fed or 4 h starved conditions. eh, Images (e and g) and quantifications (f and h) of lysosomes in mid L3-stage larval fat body cells under fed or 4 h starved conditions. Fat-body specific Tmem63-OE was achieved using Cg-Gal4 driver. Lysosomal distribution and lysosomal shape were quantified as the fraction of lysosomes in the periphery and the circularity of lysosomes, respectively. The cell nuclei are labeled in blue. Scale bars, 10 µm (a,c,e and g). In a and c, dashed lines indicate a single cell within the tissues. In b,d,f and h, data shown are mean ± s.e.m.; the statistical significance was determined by two-sided Mann–Whitney test; the numbers of cells are shown beneath the bars. The genotypes of the flies are presented in Supplementary Table 1. Numerical data are available as Source data. Source data
Fig. 5
Fig. 5. Tmem63 mutant flies display progressive motor deficits and synaptic loss.
a, Percentage of viable fly embryos. b, Developmental time of pupariation. c, Percentage of viable pupae. d, Lifespan curves of adults. e, Climbing activities of adults. f,g, Images (f) and quantifications (g) of adult NMJ. Scale bar, 20 µm. h,i, Immunoblots (h) and quantifications (i) of Ref2P proteins in adult neuronal tissues. n = 3 independent experiments. Data shown are mean ± s.e.m. (e, g and i). n.s., not significant. Statistical significance was determined by two-sided log-rank test (d), one-way analysis of variance (ANOVA) (ac and e) or one-way ANOVA adjusted with two-sided Dunn–Šídák test for multiple comparisons (g and i). In ac, boxes edge the interquartile range, lines represent the mean, and whiskers indicate the range of standard error. The numbers of animals (ae) or tissues (g) are shown. The fly genotypes in eg are indicated in Supplementary Table 1. Numerical data and unprocessed blots are available as Source data. Source data
Fig. 6
Fig. 6. Evolutionary conservation of TMEM63 homologues.
a, Phylogenetic relationship between TMEM63 homologues. Dendrogram was generated using the Phylogeny tool at EMBL-EBI. b, Expressions of TMEM63A in mammalian cells. The result is representative of three independent experiments. c, Expression patterns of MsTMEM63 proteins in N2a cells with lysosomal marker LAMP2. d, Quantification of co-localization of LAMP2 and MsTMEM63 proteins. e,f, MS currents (e) and quantifications (f) of lysosomal recordings. Grey bars indicate time duration of the pressure clamp. g, Sequence alignment of the sixth transmembrane domains of TMEM63 proteins. Conserved amino acids are highlighted. Arrows indicate the disease-associated sites. h, Expression patterns of TMEM63 mutant proteins in cells with ER markers. i, Climbing activities of adult flies. All data shown are mean ± s.e.m. n.s., not significant. Statistical significance was determined by one-way analysis of variance (ANOVA) (f) or one-way ANOVA adjusted with two-sided Dunn–Šídák test for multiple comparisons (i). The numbers of cells (d and f) or animals (i) are shown. Scale bars, 5 µm (c and h). The fly genotypes in i are indicated in Supplementary Table 1. Numerical data and unprocessed blots are available as Source data. Source data
Extended Data Fig. 1
Extended Data Fig. 1. Subcellular localization patterns of mechanosensitive channel DmPiezo, NompC, and Iav.
Representative images showing the expression patterns of DmPiezo (a), NompC (b), Iav (c) proteins and organellar markers. Each mCherry-tagged channel protein was co-expressed with LAMP1-GFP, Mito-YFP or GFP-SKL in S2 cells. The co-localization between the channel protein and organellar marker was quantified by Pearson’s correlation coefficient (PCC). Data shown are mean ± s.e.m. The numbers of cells are shown beneath the bars. Scale bar, 5 µm. Numerical data is available as source data. Source data
Extended Data Fig. 2
Extended Data Fig. 2. Drosophila Tmem63 is broadly expressed in many tissues.
a, Tissue expression patterns of Tmem63-Gal4 reporter (UAS-mCD8-GFP driven by Tmem63-Gal4). The images are representatives of three independent experiments. Scale bar, 50 µm. b, Transcriptional profile of the Tmem63 gene. Each red dot represents a cell expressing Tmem63 mRNA. The single-cell RNA sequencing datasets are from previous studies, and are available in the Fly Cell Atlas repository.
Extended Data Fig. 3
Extended Data Fig. 3. DmTMEM63 is a high-threshold mechanosensitive channel with small conductance.
a, Representative current traces (left) and I-pressure curves fitted with the Boltzmann equation (right) of the NompC-GFP and DmTMEM63-GFP channel proteins. b, Quantification of the pressure for half-maximal activation (P50) of NompC (n = 4 cells) and DmTMEM63 (n = 7 cells). Data shown are mean ± s.e.m. Statistical significance was determined by two-sided Mann-Whitney Test. c, Noise analysis of the fluctuations of the DmTMEM63 currents. The variance of the current traces shown is plotted against the current amplitudes and fitted with σ2=i·I−I2/N. The obtained fitting parameters were i = -0.154 pA and N = 247 channels. So, the single-channel conductance is 1.93 pS at a holding potential of -80 mV. Numerical data is available as source data. Source data
Extended Data Fig. 4
Extended Data Fig. 4. Generation of Tmem63 knock-out flies.
a, Tmem631 null mutant was generated through CRISPR-Cas9 mediated genome editing. The coding sequence of Tmem63 was replaced with coding sequences of GFP and mini white. The GFP was not expressed in this line possibly due to a deletion in 5’ UTR (shown as dashed lines). Arrowheads indicate cleavage sites of Cas9. b, PCR validation of Tmem631 allele. c, Tmem632 null mutant was generated by ends-out homologous recombination. The coding sequence of Tmem63 was replaced with Gal4 and mini white. The GAL4 was expressed in this line under the control of the native promoter of Tmem63. d, PCR validation of Tmem632 allele. The images in b and d are representatives of three independent experiments. The locations of the primers in b and d are shown in a and c, respectively. The sizes of the PCR fragments are indicated below the DNA bands. Unprocessed gels are available as source data. Source data
Extended Data Fig. 5
Extended Data Fig. 5. The native DmTMEM63 currents were not detected in recordings from the plasma membranes of the fat-body cells.
Representative current traces of the fat-body plasma membranes in response to negative pressure in the cell-attached patch-clamp configuration. Fat bodies were dissected from wild-type (WT) and Tmem63 mutant larvae. Grey bars indicate time duration of the pressure clamp.
Extended Data Fig. 6
Extended Data Fig. 6. DmTMEM63 channel activity correlates with lysosomal morphological remodeling.
a, Representative time-lapse images showing the lysosomal morphologies (mCherry) and lysosomal calcium signals (GCaMP6f) in S2 cells expressing DmTMEM63-mCherry-GCaMP6f. The heat maps of the masked images exhibit the membrane curvature and the intensity of Ca2+ signals of a lysosome. Scale bar, 1 µm. b, A positive correlation between membrane curvature and normalized Ca2+ signal (GCaMP6f fluorescent intensity divided by mCherry fluorescent intensity). The lysosome shown in inset was used for analysis. Blue line marks the boundary of the lysosome for calculating curvature and the Ca2+ intensity measurement was carried out in the white region (for details, please see Methods). Pearson correlation coefficient (r) was used to determine the correlation between the curvature and Ca2+ signal. Each dot represents a correlation value of a segment of the lysosomal periphery at a specific timepoint. c, Group data of the Pearson correlation coefficient between the membrane curvature and intensity of Ca2+ signals. n = 19 lysosomes. Data shown are mean ± s.e.m. Statistical significance was determined by one-sample two-sided student’s t-test. Scale bars, 1 µm (a, b). Numerical data is available as source data. Source data
Extended Data Fig. 7
Extended Data Fig. 7. Increased lysosomal size in Tmem63 mutants.
Representative images (a) and quantifications (b) of lysosomes (labelled by LysoTracker-red dye) in the fat bodies of the mid-L3 wild-type (WT) or Tmem63 mutant larvae under 4 h starved conditions. Scale bars, 10 µm. n = 15 cells per group; data shown are mean ± s.e.m. Statistical significance was determined by two-sided Student’s t-test. Numerical data is available as source data. Source data
Extended Data Fig. 8
Extended Data Fig. 8. Tmem63 mutant flies are vulnerable to starvation.
a, Schematic showing the starvation stress treatment starting from the third-stage larvae (L3). b, Percentage of viable larvae for wild type (WT), Tmem63 mutants, and Tmem63 mutants re-expressing the Tmem63 gene (Tmem63 rescue). c, Climbing activities of young adult flies at day 4. All data shown are mean ± s.e.m. Statistical significance was determined by two-sided Student’s t-test (b, c). The numbers of animals are shown beneath the bars. The fly genotypes in b and c are indicated in Supplementary Table 1. Numerical data are available as source data. Source data
Extended Data Fig. 9
Extended Data Fig. 9. Lysosomal recordings and CRISPR-mediated gene disruption in N2a cells.
a, Enlarged lysosomes (LAMP1-YFP-positive intracellular vesicles) in N2a cells. Scale bar, 5 µm. b, Schematic of the experimental procedure for patch-clamp recordings on lysosomes of N2a cells. Lysosomes are shown as grey vesicles. N, cell nucleus. c, DNA sequences of the Cas9-targeted segments in wild-type (WT) and MsTmem63a knock-out (KO) N2a cells. Guide RNA and protospacer adjacent motif (PAM) sequences are highlighted in red and blue, respectively. d, The deletion in the MsTmem63a gene results in a pre-mature stop codon of the MsTMEM63A proteins in KO cells. e, The mRNA level of MsTmem63a in WT and KO cells. Data shown are mean ± s.e.m. Statistical significance was determined by two-sided Mann-Whitney test. n = 6 independent experiments. f, The MsTMEM63A protein level in WT and KO cells. The results in a and f are representatives of three independent experiments. Numerical data and unprocessed blots are available as source data. Source data
Extended Data Fig. 10
Extended Data Fig. 10. Model illustrating the proposed role of DmTMEM63-mediated lysosomal mechanotransduction.
Left, the lysosomal membrane harbors the DmTMEM63 protein, a mechanosensitive cationic channel. Right, the interplay between DmTMEM63 channel activity and lysosomal dynamics. The lysosomal morphological remodeling alters the membrane curvature and surface tension (i) and cytoskeletal elements, such as kinesin-microtubule complex that drives lysosomal tubulation, exert mechanical forces on the lysosomal membrane (ii). These changes in mechanical state of the lysosomal membrane may activate the DmTMEM63 channel and cause lysosomal Ca2+ efflux which in turn regulates lysosomal remodeling and mobility. The model was created with BioRender.com.

References

    1. Arsenovic PT, et al. Nesprin-2G, a component of the nuclear LINC complex, is subject to myosin-dependent tension. Biophys. J. 2016;110:34–43. doi: 10.1016/j.bpj.2015.11.014. - DOI - PMC - PubMed
    1. Gurel PS, Hatch AL, Higgs HN. Connecting the cytoskeleton to the endoplasmic reticulum and Golgi. Curr. Biol. 2014;24:R660–R672. doi: 10.1016/j.cub.2014.05.033. - DOI - PMC - PubMed
    1. Cason SE, Holzbaur ELF. Selective motor activation in organelle transport along axons. Nat. Rev. Mol. Cell Biol. 2022;23:699–714. doi: 10.1038/s41580-022-00491-w. - DOI - PubMed
    1. Valm AM, et al. Applying systems-level spectral imaging and analysis to reveal the organelle interactome. Nature. 2017;546:162–167. doi: 10.1038/nature22369. - DOI - PMC - PubMed
    1. Lipowsky R. Spontaneous tubulation of membranes and vesicles reveals membrane tension generated by spontaneous curvature. Faraday Discuss. 2013;161:305–331. doi: 10.1039/C2FD20105D. - DOI - PubMed

Publication types