. 2024 Jun;46(3):2901-2913.
doi: 10.1007/s11357-024-01102-6. Epub 2024 Feb 22.

Age associated susceptibility to SARS-CoV-2 infection in the K18-hACE2 transgenic mouse model

Affiliations

Age associated susceptibility to SARS-CoV-2 infection in the K18-hACE2 transgenic mouse model

Varun Dwivedi et al. Geroscience. 2024 Jun.

Abstract

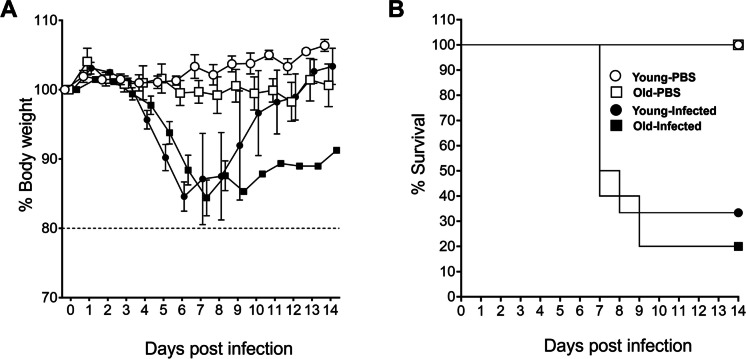
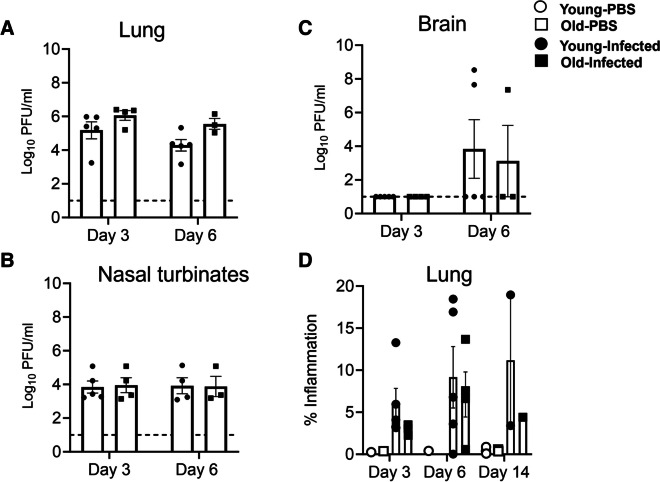
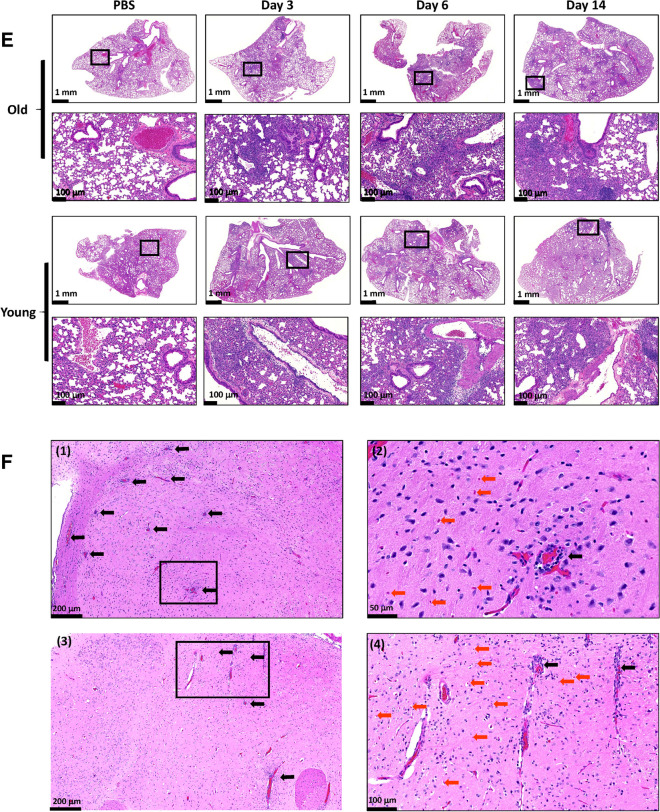
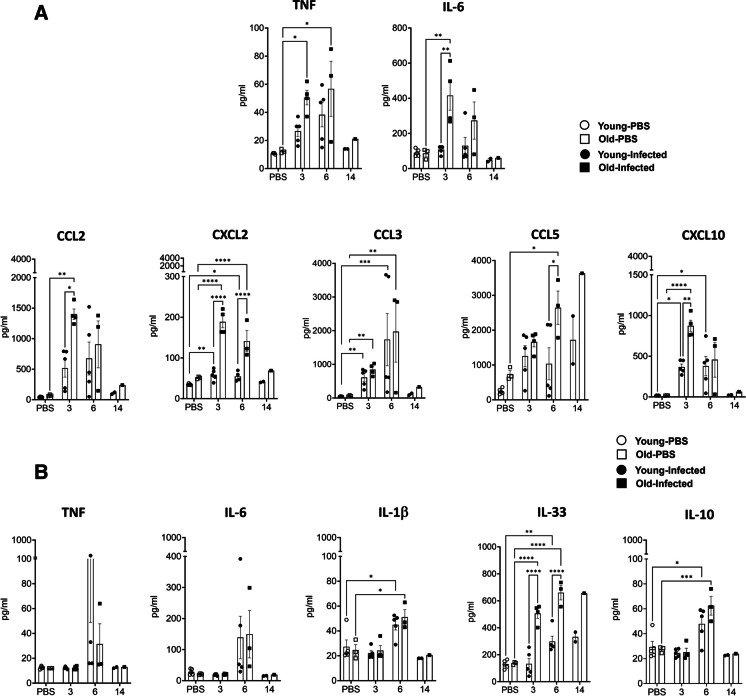
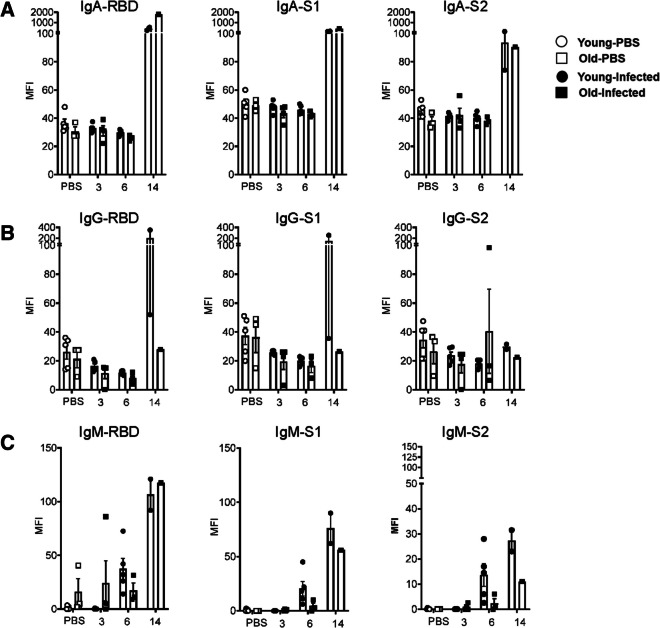
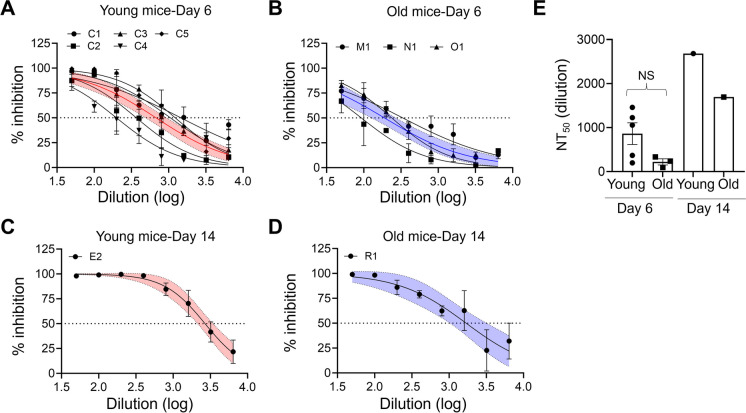
Coronavirus disease 2019 (COVID-19) caused by severe acute respiratory syndrome coronavirus 2 (SARS-CoV-2) is still an ongoing global health crisis. Clinical data indicate that the case fatality rate (CFR) is age dependent, with a higher CFR percentage in the elderly population. We compared the pathogenesis of SARS-CoV-2 in young and aged K18-hACE2 transgenic mice. We evaluated morbidity, mortality, viral titers, immune responses, and histopathology in SARS-CoV-2-infected young and old K18-hACE2 transgenic mice. Within the limitation of having a low number of mice per group, our results indicate that SARS-CoV-2 infection resulted in slightly higher morbidity, mortality, and viral replication in the lungs of old mice, which was associated with an impaired IgM response and altered cytokine and chemokine profiles. Results of this study increase our understanding of SARS-CoV-2 infectivity and immuno-pathogenesis in the elderly population.

Keywords: Aging; COVID-19; Cytokine storm; K18-hACE2 transgenic mouse; SARS-CoV-2 infection.


Conflict of interest statement

The authors declare no competing interests.

Figures

Fig. 1
Fig. 1
SARS-CoV-2 infection in young and old K18-hACE2 transgenic mice. Young (1.75 months) and old (19 months) male K18-hACE2 transgenic mice were mock (PBS)-infected (n = 3/group) or SARS-CoV-2-infected (1 × 103 PFU) (n = 5/group, old mice; n = 6/group, young mice) by the intranasal route. Animals were monitored for A morbidity (change in body weight) and B mortality (% survival) up to 14-days post infection. Each data point represents the mean ± SE for each mouse group. Welch’s t test was used to compare Young-infected and Old-infected mice at each time point (when n ≥ 3). The median survival for young is 7.5 days and 7 days for the old mice. The log-rank test has a p value of 0.74. The dotted line represents end-point weight loss criteria
Fig. 2
Fig. 2
Old K18-hACE2 transgenic mice show increased viral replication in the lungs. Young (n = 3/group) and old (n = 5/group) K18-hACE2 transgenic mice were mock (PBS)-infected or infected with 1 × 10.3 PFU of SARS-CoV-2 by the intranasal route. SARS-CoV-2 infected mice (n = 3 to 5/group/time point) were euthanized on days 3 and 6 post infection. Viral titers in the A lung, B nasal turbinate, and C brain were determined by standard plaque assay. Data represent the log transformed mean ± SE of 3–5 mice in each group at each time point. The normality was assessed using the QQ plot on the log transformed data and the data was normally distributed. Welch’s t test was performed to determine statistical significance between Young-Infected and Old-Infected mice. LOD, limit of detection; N.D., not detected. D Caudal lung lobes were quantified for pulmonary inflammation and expressed as a percentage of tissue involved. Average pulmonary inflammation score at days 3, 6, and 14 post infection is shown. Percent affected area was quantified by calculating the total area of the involved tissue over the total area of the lobe for each individual mouse and graded as 0, 1, 2, 3, 4, and 5 which corresponded to no inflammation, < 10%, < 25%, 50%, < 75%, > 75% of affected tissue, respectively. E Representative images of the H&E-stained lungs of old and young mice mock (PBS)-infected or infected with SARS-CoV-2 at 3-, 6-, and 14-days post infection. The first and third row images are low magnification images of the entire right lung lobe, (scale bars = 1 mm). The second and fourth row are higher magnification images of the areas marked in black boxes (scale bar = 100 µm). F Brain lesions in mice infected with SARS-CoV-2. (1) Low magnification image of brain from a young mice 6 days post infection, showing diffuse gliosis and perivascular cuffing (black arrows) around multiple blood vessels (scale bar = 200 µm). (2) Higher magnification of image A highlighting perivascular cuffing (black arrows) and few necrotic neurons (red arrows) (scale bar = 50 µm). (3) Low magnification image of the brain from a young mice 14 days post infection, showing diffuse gliosis and perivascular cuffing (black arrows) (scale bar = 100 µm). (4) Higher magnification of image A highlighting perivascular cuffing (black arrows), gliosis and few necrotic neurons (red arrows) (scale bar = 50 µm)
Fig. 2
Fig. 2
Old K18-hACE2 transgenic mice show increased viral replication in the lungs. Young (n = 3/group) and old (n = 5/group) K18-hACE2 transgenic mice were mock (PBS)-infected or infected with 1 × 10.3 PFU of SARS-CoV-2 by the intranasal route. SARS-CoV-2 infected mice (n = 3 to 5/group/time point) were euthanized on days 3 and 6 post infection. Viral titers in the A lung, B nasal turbinate, and C brain were determined by standard plaque assay. Data represent the log transformed mean ± SE of 3–5 mice in each group at each time point. The normality was assessed using the QQ plot on the log transformed data and the data was normally distributed. Welch’s t test was performed to determine statistical significance between Young-Infected and Old-Infected mice. LOD, limit of detection; N.D., not detected. D Caudal lung lobes were quantified for pulmonary inflammation and expressed as a percentage of tissue involved. Average pulmonary inflammation score at days 3, 6, and 14 post infection is shown. Percent affected area was quantified by calculating the total area of the involved tissue over the total area of the lobe for each individual mouse and graded as 0, 1, 2, 3, 4, and 5 which corresponded to no inflammation, < 10%, < 25%, 50%, < 75%, > 75% of affected tissue, respectively. E Representative images of the H&E-stained lungs of old and young mice mock (PBS)-infected or infected with SARS-CoV-2 at 3-, 6-, and 14-days post infection. The first and third row images are low magnification images of the entire right lung lobe, (scale bars = 1 mm). The second and fourth row are higher magnification images of the areas marked in black boxes (scale bar = 100 µm). F Brain lesions in mice infected with SARS-CoV-2. (1) Low magnification image of brain from a young mice 6 days post infection, showing diffuse gliosis and perivascular cuffing (black arrows) around multiple blood vessels (scale bar = 200 µm). (2) Higher magnification of image A highlighting perivascular cuffing (black arrows) and few necrotic neurons (red arrows) (scale bar = 50 µm). (3) Low magnification image of the brain from a young mice 14 days post infection, showing diffuse gliosis and perivascular cuffing (black arrows) (scale bar = 100 µm). (4) Higher magnification of image A highlighting perivascular cuffing (black arrows), gliosis and few necrotic neurons (red arrows) (scale bar = 50 µm)
Fig. 3
Fig. 3
SARS-CoV-2 infection caused a strong local cytokine response in the elderly mice. The lung (A) and brain (B) tissue lysates from viral titer determinations at days 4 and 6 post-infection (Fig. 2) and morbidity and mortality (survivors at 14 days post infection, including PBS inoculated mice) (Fig. 1), were used to measure levels of cytokines and chemokines by Luminex assay and ELISA. Data represent the mean ± SE of 1–5 mice in each group at days 3, 6, and 14 post infection. Two-way ANOVA followed by multiple comparisons with Bonferroni correction was performed to determine statistical significance between the experimental groups. *p < 0.05; **p < 0.01; ***p < 0.005; and ****p < 0.001. For some cytokines/chemokines log transformation of the data was done to satisfy the assumptions of normality
Fig. 4
Fig. 4
Old mice show reduced antibody response in the lungs post SARS-CoV-2 infection. Tissue lysates from mice used to determine viral titers at days 4 and 6 post-infection (Fig. 2) and morbidity and mortality (survivors at 14 days post infection, including PBS inoculated mice) (Fig. 1), were used to measure IgA (A), IgG (B), and IgM (C) responses against SARS-CoV-2 RBD (left), S1 (center), and S2 (right) by Luminex assay. Data represent the mean ± SE of 1–5 mice in each group at days 3, 6, and 14 post infection. Two-way ANOVA was performed to determine statistical significance between the experimental groups; ns, non-significant
Fig. 5
Fig. 5
Old mice show lower neutralizing antibody titers in serum post SARS-CoV-2 infection. Neutralizing antibodies in serum samples collected at days 6 and 14 post infection were determined by PRMNT assay. Nonlinear regression curve of % viral inhibition with overall fit is plotted against serum dilution (log) for young mice (red line) at days 6 (A, R2 = 0.77, C1 to C5: individual young mice) and 14 (C, E2 a given young mouse) and old mice (blue line) at days 6 (B, R2 = 0.8, M1, M1, and O1, individual old mice) and 14 (D, R1 a given old mouse). Different symbols indicate individual mice, illustrating n = 1 at day 14. E The 50% neutralizing concentration (NT50) in sera from young and old mice at days 6 and 14 post infection. The Mann–Whitney test was performed to determine statistical significance between the experimental groups (day 6); NS, non-significant

Similar articles

Cited by

References

    1. (WHO) WHO. WHO Coronavirus (COVID-19) Dashboard - https://covid19.who.int/ Geneva, Switzerland: WHO; 2023 .
    1. Remelli F, Volpato S, Trevisan C. Clinical features of SARS-CoV-2 infection in older adults. Clin Geriatr Med. 2022;38(3):483–500. doi: 10.1016/j.cger.2022.03.001. - DOI - PMC - PubMed
    1. Oladunni FS, Park J-G, Pino PA, Gonzalez O, Akhter A, Allué-Guardia A, et al. Lethality of SARS-CoV-2 infection in K18 human angiotensin-converting enzyme 2 transgenic mice. Nat Commun. 2020;11(1):6122. doi: 10.1038/s41467-020-19891-7. - DOI - PMC - PubMed
    1. Park JG, Pino PA, Akhter A, Alvarez X, Torrelles JB, Martinez-Sobrido L. Animal models of COVID-19: transgenic mouse model. Methods Mol Biol. 2022;2452:259–289. doi: 10.1007/978-1-0716-2111-0_16. - DOI - PMC - PubMed
    1. Flurkey K, Currer JM, Harrison DE. Mouse models in aging research. In: Fox JG, Barthold SW, Davisson MT, Newcomer CE, Quimby FW, Smith AL, editors. The Mouse in Biomedical Research. 2nd Ed. New York; Elsevier. 2007;3:637–72.

Publication types