. 2024 Feb 22;25(1):54.
doi: 10.1186/s13059-024-03186-x.

Structured 3' UTRs destabilize mRNAs in plants

Affiliations

Structured 3' UTRs destabilize mRNAs in plants

Tianru Zhang et al. Genome Biol. .

Abstract

Background: RNA secondary structure (RSS) can influence the regulation of transcription, RNA processing, and protein synthesis, among other processes. 3' untranslated regions (3' UTRs) of mRNA also hold the key for many aspects of gene regulation. However, there are often contradictory results regarding the roles of RSS in 3' UTRs in gene expression in different organisms and/or contexts.

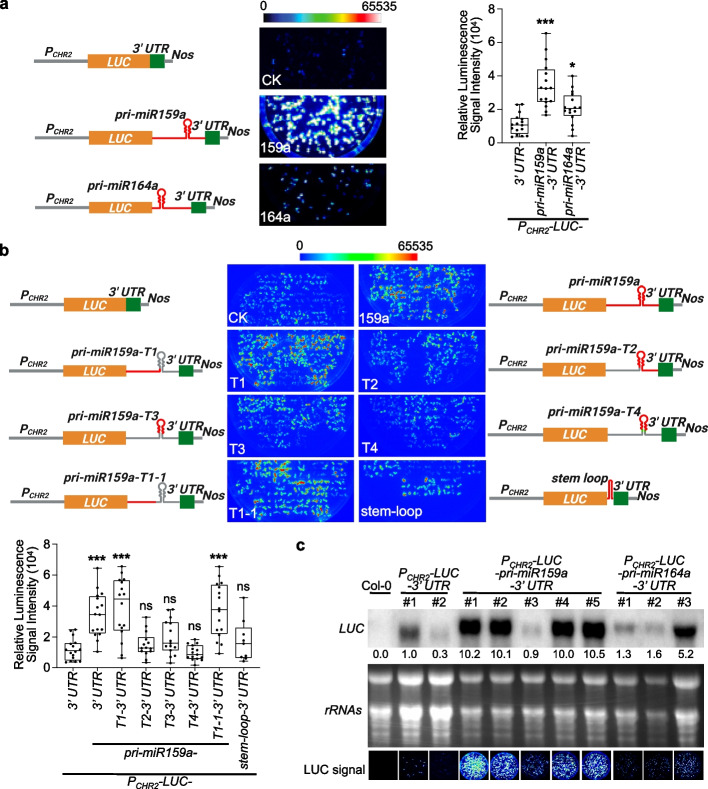
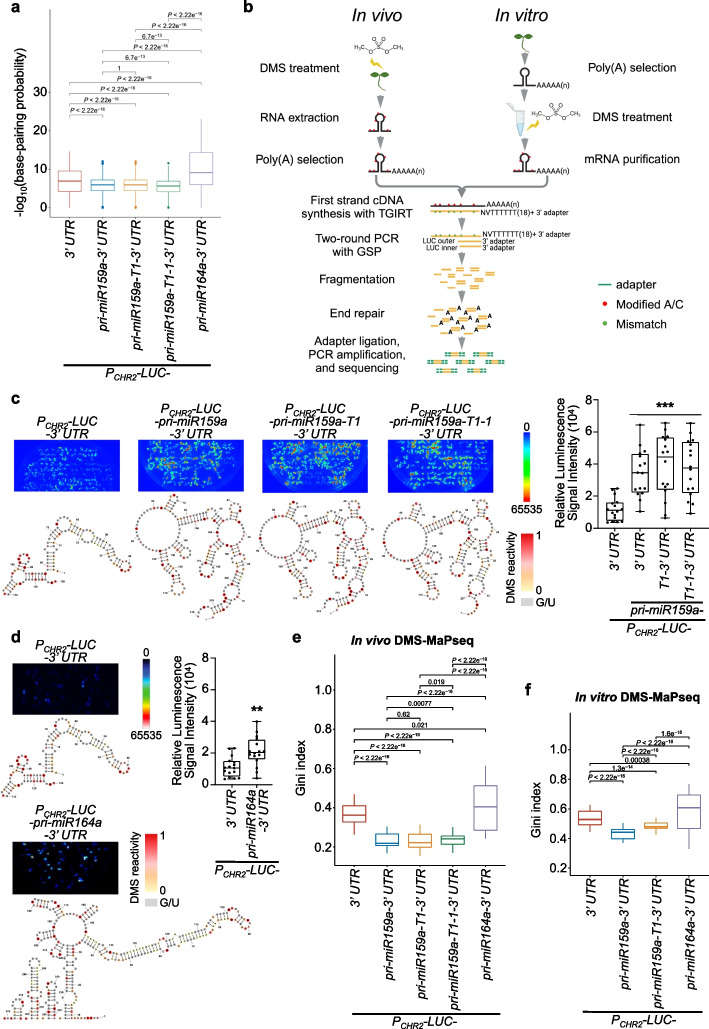
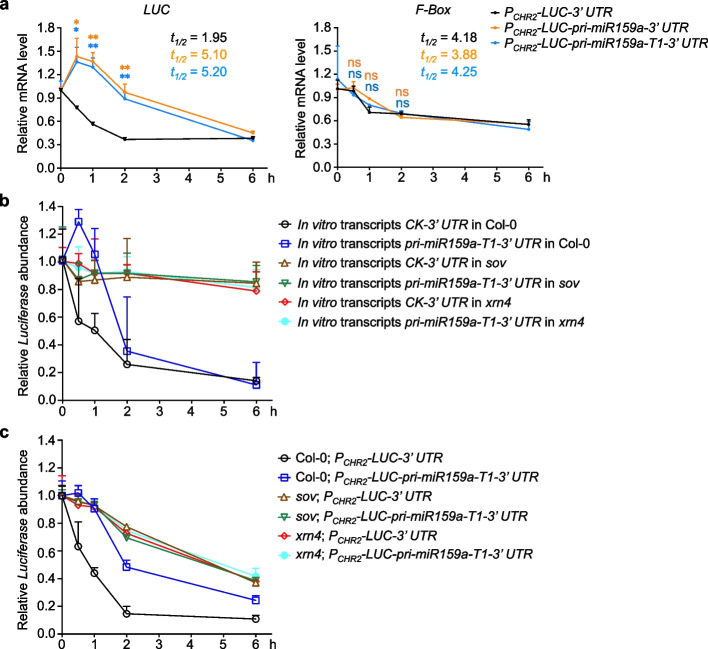
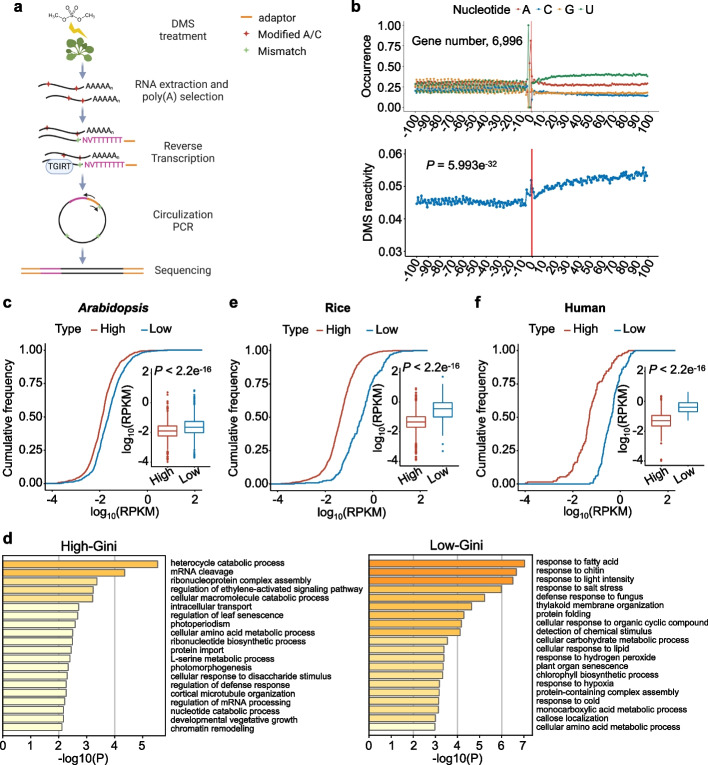
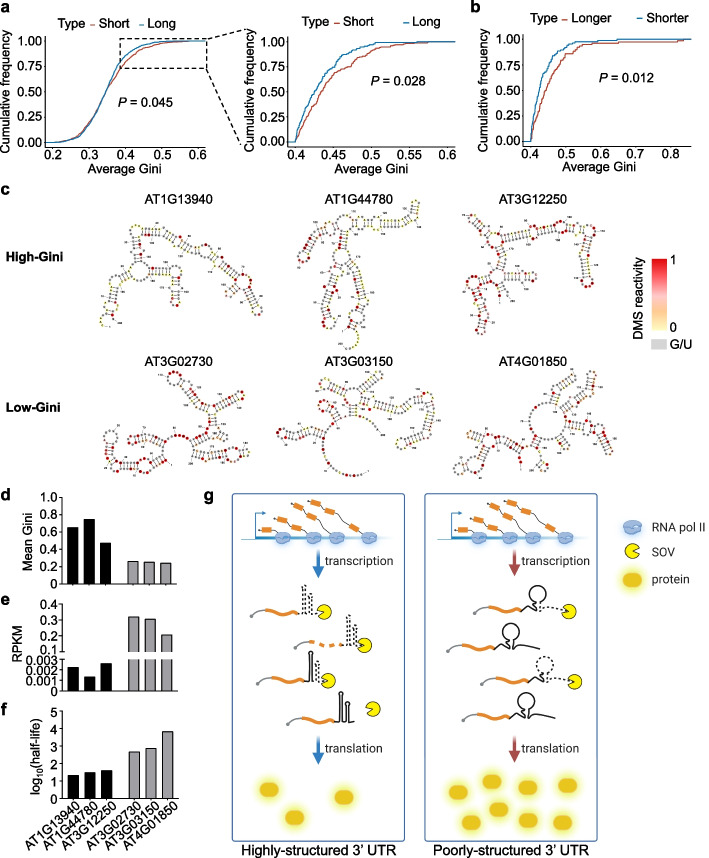
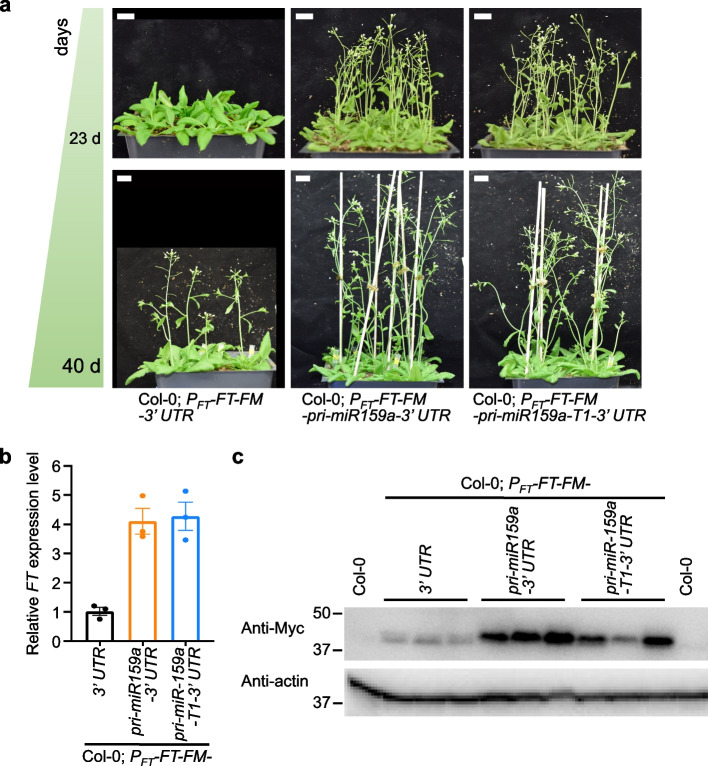
Results: Here, we incidentally observe that the primary substrate of miR159a (pri-miR159a), when embedded in a 3' UTR, could promote mRNA accumulation. The enhanced expression is attributed to the earlier polyadenylation of the transcript within the hybrid pri-miR159a-3' UTR and, resultantly, a poorly structured 3' UTR. RNA decay assays indicate that poorly structured 3' UTRs could promote mRNA stability, whereas highly structured 3' UTRs destabilize mRNA in vivo. Genome-wide DMS-MaPseq also reveals the prevailing inverse relationship between 3' UTRs' RSS and transcript accumulation in the transcriptomes of Arabidopsis, rice, and even human. Mechanistically, transcripts with highly structured 3' UTRs are preferentially degraded by 3'-5' exoribonuclease SOV and 5'-3' exoribonuclease XRN4, leading to decreased expression in Arabidopsis. Finally, we engineer different structured 3' UTRs to an endogenous FT gene and alter the FT-regulated flowering time in Arabidopsis.

Conclusions: We conclude that highly structured 3' UTRs typically cause reduced accumulation of the harbored transcripts in Arabidopsis. This pattern extends to rice and even mammals. Furthermore, our study provides a new strategy of engineering the 3' UTRs' RSS to modify plant traits in agricultural production and mRNA stability in biotechnology.

Keywords: 3′ UTR; 3′ end target-specific DMS-MaPseq; DIM-2P-seq; RNA secondary structure (RSS); mRNA stability.


Conflict of interest statement

The authors declare that they have no competing interests.

Figures

Fig. 1
Fig. 1
Insertion of MIR159a in 3′ UTR enhances the expression of transgene. a, b LUC signals of reporter lines expressing different constructs. (Left part) schematic constructs. PCHR2, the native promoter of CHR2 locus; Nos, nopaline synthase terminator. For different truncated segments of pri-miR159a, the red lines represented the retained regions of pri-miR159a, while the gray regions were removed in the constructs. Be noted that pri-miR159a-T4, but not pri-miR159a-T3 contained the miR159/159* duplex (labeled in green). (Middle part) Six-day-old T2 seedlings of 16 randomly selected independent lines were photographed under charge-coupled device (CCD) camera for LUC signals. Exposure time for CCD camera was 30 S. (Right part in a and lower part in b) Quantification of luminescence results from different transgene lines. Each data point represented the mean of 10–12 plants from individual lines. For most constructs, 16 individual lines were utilized except for PCHR2-LUC-stem-loop-3UTR where only 9 lines were available. Whiskers represent the minimum and maximum values whereas horizontal lines in the boxplots display the 75th, 50th, and 25th percentiles, respectively. Statistical test was performed between different transgenic lines and PCHR2-LUC-3UTR. ns, no significance; *P < 0.05; **P < 0.01; ***P < 0.001; unpaired two-tailed Student’s t test. c RNA blot analyses of randomly selected lines showed LUC transcripts significantly accumulated in PCHR2-LUC-pri-miR159a-3UTR, but not PCHR2-LUC-pri-miR164a-3UTR, compared to PCHR2-LUC-3UTR. Ribosomal RNAs served as control. LUC signals of the sampled materials were shown in the bottom panels (Exposure time of 30 S under CCD camera). The relative signals of LUC blot were first normalized to that of rRNAs, and then to that of #1 of PCHR2-LUC-3UTR sample where the ratio was arbitrarily assigned a value of 1.0. Be noted that LUC pictures in a and c were taken under a CCD camera (Olympus DP70) different from the one used in b (Schneider Kreuznach), with each experiment having its own CK (PCHR2-LUC-3UTR) lines
Fig. 2
Fig. 2
LUC transgene expression is inversely correlated with RSS of 3′ UTRs. a Predicted base-pairing probabilities of the 3' UTRs for different transgene lines (PCHR2-LUC-3UTR, PCHR2-LUC-pri-miR159a-3UTR, PCHR2-LUC-pri-miR159a-T1-3UTR, PCHR2-LUC-pri-miR159a-T1-1-3UTR, and PCHR2-LUC-pri-miR164a-3UTR) via RNAstructure [23]. P values by Wilcoxon test. b Schematic pipeline of 3′ end target-specific DMS-MaPseq for both in vivo and in vitro conditions. See Methods for details. GSP, gene specific primer; TGIRT, thermostable group II intron reverse transcriptase. c, d RSS of the 3′ UTRs for different transgene transcripts in a. The DMS signals of A and C residues were color-coded and U/G bases were marked in gray. Quantification of luminescence results of the representative samples was shown in the right part. LUC pictures in c and d were taken under different CCD cameras, with each experiment having its own CK (PCHR2-LUC-3UTR) lines. Whiskers represent the minimum and maximum values whereas horizontal lines in the boxplots display the 75th, 50th, and 25th percentiles, respectively. Statistical test was performed between different transgenic lines and PCHR2-LUC-3UTR. ns, no significance; *P < 0.05; **P < 0.01; ***P < 0.001; unpaired two-tailed Student’s t test. ef Gini index of in vivo (e) and in vitro (f) DMS reactivities of the 3′ UTRs for different transgene lines. P values by Wilcoxon test. In a, e, and f, horizontal lines in the boxplots display the 75th, 50th, and 25th percentiles, respectively. The upper fence is 75th percentile + 1.5 * interquartile range. The lower fence is 25th percentile − 1.5 * interquartile range. Dots represent the outliers
Fig. 3
Fig. 3
Poorly structured 3′ UTRs increase RNA stability to enhance transcript accumulation. a qRT-PCR assays showed the relative expression of LUC (left) and F-box (right) in different transgenic samples (PCHR2-LUC-3UTR, PCHR2-LUC-pri-miR159a-3UTR, and PCHR2-LUC-pri-miR159a-T1-3UTR) collected at indicated times after the treatment with 50 μM Act D. Half-life t1/2 (h) is shown. LUCCK t1/2 < LUC159a/159a-T1 t1/2. F-boxCK t1/2 ≅ F-box159a/159a-T1 t1/2. RNA was extracted from 10-day-old seedlings of each line. The relative expression of tested genes was normalized to that of 18S rRNA. b qRT-PCR showed the relative mRNA abundance of in vitro transcribed 3′ end region of LUC transcripts of PCHR2-LUC-3UTR (CK-3UTR) and PCHR2-LUC-pri-miR159a-T1-3UTR (pri-miR159a-T1-3UTR) delivered into Col-0, sov, and xrn4. The same level of in vitro transcripts was infiltrated into 10-day-old Col-0, xrn4, and sov seedlings, respectively. Infiltrated plants were collected at indicated time points for qRT-PCR. A different in vitro transcribed segment of LUC transcript was co-infiltrated as a reference for normalization. c qRT-PCR showed that the decay of LUC transcripts with highly structured 3′ UTRs is through SOV and XRN4. Ten-day-old seedlings were treated with 50 μM Act D for indicated times before sampling. The relative expression of LUC was normalized to that of 18S rRNA. Data from ac are shown as means ± SE from three independent biological replicates. ns, no significance; *P < 0.05; **P < 0.01; unpaired two-tailed Student’s t test
Fig. 4
Fig. 4
3′ UTRs’ RSS is inversely related to transcript accumulation in Arabidopsis, rice, and human. a Schematic of DIM-2P-seq used for in vivo probing 3′ end RSS of polyadenylated transcripts. See “Methods” for details. b DMS reactivity profile of stop codon regions (lower panel, CDS, 100 nt upstream of the stop codon, and 3′ UTR, 100 nt downstream of the stop codon). mRNAs were aligned by their stop codons (vertical red lines). 6996 genes were used in this analysis. P value = 5.993e−32 by Wilcoxon test between DMS reactivities of CDS and 3′ UTR. Nucleotide frequency around the stop codon regions was also shown (upper panel). c, e, f Comparison of gene expression level (RPKM) between the high-Gini and low-Gini genes for Arabidopsis (c), rice (e), and human (f). P value < 2.2e−16 by Wilcoxon test. Horizontal lines in the boxplots display the 75th, 50th, and 25th percentiles, respectively. The upper fence is 75th percentile + 1.5 * interquartile range. The lower fence is 25th percentile − 1.5 * interquartile range. Dots represent the outliers. d Biological processes of GO analysis for the high-Gini and low-Gini genes. P value cutoff, 0.01
Fig. 5
Fig. 5
Transcripts with poorly structured 3′ UTR are more stable in Arabidopsis. a Comparison of Gini index between the short half-life and long half-life genes in WT for Arabidopsis (RNA decay data, GSE86361). P value by Kolmogorov-Smirnov test. b Comparison of RSS of 3′ UTRs (Gini index) between the longer half-life (the top 10% of log2(sov/WT)) and shorter half-life (the bottom 10% of log2(sov/WT)) genes in sov compared to WT in Arabidopsis (RNA decay data, GSE86361). P value by Kolmogorov-Smirnov test. c RSS modeling for randomly selected transcripts with the high-Gini and low-Gini 3′ UTRs. The DMS signals of A and C residues were color-coded and U/G bases were marked in gray. df Mean Gini index (d), expression level (RPKM) (e), and half-life (log10(min)) (f) of the gene examples in c. g A proposed model for RSS of 3′ UTR in regulating gene expression. This model shows that RNA transcripts possessing highly structured 3′ UTR are susceptible to degradation by 3′–5′ exoribonuclease SOV. Conversely, transcripts with less structured 3′ UTR could evade from the degradation, thereby exhibiting enhanced stability and expression
Fig. 6
Fig. 6
Engineered poorly structured 3′ UTRs of FT induce early flowering. a Flowering phenotype of the indicated stages in different T2 transformants with selected poorly structured or highly structured 3′ UTRs in Col-0 background. At least three individual lines were employed for each transgenic construct to observe the flowering phenotype, with 40–50 plants cultivated for each individual line in two independent sets of experiments (upper and lower panels). Consistent results were obtained across the two independent sets. Plants were grown under long-day (LD, 16 h: 8 h, light: dark) photoperiod conditions. Scale bar, 2 cm. b Relative expression of FT levels in T2 transgenic lines. The data were presented as means ± SE (n = 3) biologically independent replicates. The relative FT expression was normalized to that of UBQ10. c Western blot analysis showed increased FT protein levels in T2 transgenic lines with the poorly structured 3′ UTRs (Col-0; PFT-FT-FM-pri-miR159a-3UTR and Col-0; PFT-FT-FM-pri-miR159a-T1-3UTR) vs the highly structured ones (Col-0; PFT-FT-FM-3UTR). Anti-Myc antibody was used to detect Myc-tagged FT protein. Col-0 samples served as negative controls. Actin was a loading control

Similar articles

Cited by

References

    1. Gosai SJ, Foley SW, Wang D, Silverman IM, Selamoglu N, Nelson AD, Beilstein MA, Daldal F, Deal RB, Gregory BD. Global analysis of the RNA-protein interaction and RNA secondary structure landscapes of the Arabidopsis nucleus. Mol Cell. 2015;57:376–388. doi: 10.1016/j.molcel.2014.12.004. - DOI - PMC - PubMed
    1. Wu X, Bartel DP. Widespread influence of 3’-end structures on mammalian mRNA processing and stability. Cell. 2017;169:905–917.e911. doi: 10.1016/j.cell.2017.04.036. - DOI - PMC - PubMed
    1. Zhang M, Lam TT, Tonelli M, Marzluff WF, Thapar R. Interaction of the histone mRNA hairpin with stem-loop binding protein (SLBP) and regulation of the SLBP-RNA complex by phosphorylation and proline isomerization. Biochemistry. 2012;51:3215–3231. doi: 10.1021/bi2018255. - DOI - PMC - PubMed
    1. Trappl K, Polacek N. The ribosome: a molecular machine powered by RNA. Met Ions Life Sci. 2011;9:253–275. - PubMed
    1. Bhaskaran H, Rodriguez-Hernandez A, Perona JJ. Kinetics of tRNA folding monitored by aminoacylation. RNA. 2012;18:569–580. doi: 10.1261/rna.030080.111. - DOI - PMC - PubMed

Publication types

LinkOut - more resources