

HDL levels modulate the impact of type 2 diabetes susceptibility alleles in older adults
- PMID: 38389069
- PMCID: PMC10882764
- DOI: 10.1186/s12944-024-02039-7
HDL levels modulate the impact of type 2 diabetes susceptibility alleles in older adults
Abstract
Background: Type 2 Diabetes (T2D) is influenced by genetic, environmental, and ageing factors. Ageing pathways exacerbate metabolic diseases. This study aimed to examine both clinical and genetic factors of T2D in older adults.
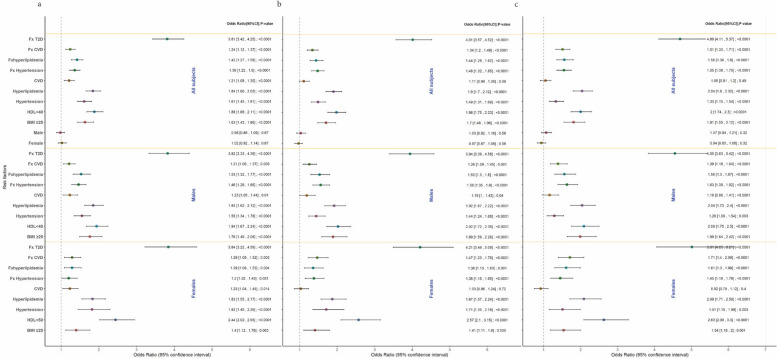
Methods: A total of 2,909 genotyped patients were enrolled in this study. Genome Wide Association Study was conducted, comparing T2D patients to non-diabetic older adults aged ≥ 60, ≥ 65, or ≥ 70 years, respectively. Binomial logistic regressions were applied to examine the association between T2D and various risk factors. Stepwise logistic regression was conducted to explore the impact of low HDL (HDL < 40 mg/dl) on the relationship between the genetic variants and T2D. A further validation step using data from the UK Biobank with 53,779 subjects was performed.
Results: The association of T2D with both low HDL and family history of T2D increased with the age of control groups. T2D susceptibility variants (rs7756992, rs4712523 and rs10946403) were associated with T2D, more significantly with increased age of the control group. These variants had stronger effects on T2D risk when combined with low HDL cholesterol levels, especially in older control groups.
Conclusions: The findings highlight a critical role of age, genetic predisposition, and HDL levels in T2D risk. The findings suggest that individuals over 70 years who have high HDL levels without the T2D susceptibility alleles may be at the lowest risk of developing T2D. These insights can inform tailored preventive strategies for older adults, enhancing personalized T2D risk assessments and interventions.
Keywords: Diabetes risk; Genetic variants; HDL; Older age groups.
© 2024. The Author(s).
Conflict of interest statement
The authors declare no competing interests.
Figures

Similar articles
-
R230C but not - 565C/T variant of the ABCA1 gene is associated with type 2 diabetes in Mexicans through an effect on lowering HDL-cholesterol levels.J Endocrinol Invest. 2020 Aug;43(8):1061-1071. doi: 10.1007/s40618-020-01187-8. Epub 2020 Feb 3. J Endocrinol Invest. 2020. PMID: 32016916
-
Cholesteryl Ester Transfer Protein Genetic Variants Associated with Risk for Type 2 Diabetes and Diabetic Kidney Disease in Taiwanese Population.Genes (Basel). 2019 Oct 8;10(10):782. doi: 10.3390/genes10100782. Genes (Basel). 2019. PMID: 31597401 Free PMC article.
-
The Association of Type 2 Diabetes Loci Identified in Genome-Wide Association Studies with Metabolic Syndrome and Its Components in a Chinese Population with Type 2 Diabetes.PLoS One. 2015 Nov 24;10(11):e0143607. doi: 10.1371/journal.pone.0143607. eCollection 2015. PLoS One. 2015. PMID: 26599349 Free PMC article.
-
Genetic markers of type 2 diabetes: Progress in genome-wide association studies and clinical application for risk prediction.J Diabetes. 2016 Jan;8(1):24-35. doi: 10.1111/1753-0407.12323. Epub 2015 Sep 15. J Diabetes. 2016. PMID: 26119161 Review.
-
Genetic predisposition in type 2 diabetes: A promising approach toward a personalized management of diabetes.Clin Genet. 2020 Dec;98(6):525-547. doi: 10.1111/cge.13772. Epub 2020 May 25. Clin Genet. 2020. PMID: 32385895 Review.
References
-
- Lyssenko V, Almgren P, Anevski D, Perfekt R, Lahti K, Nissén M, et al. Predictors of and longitudinal changes in insulin sensitivity and secretion preceding onset of type 2 diabetes. Diabetes. 2005;54(1):166–174. - PubMed
-
- Molina-Ayala MA, Rodríguez-Amador V, Suárez-Sánchez R, León-Solís L, Gómez-Zamudio J, Mendoza-Zubieta V, et al. Expression of obesity- and type-2 diabetes-associated genes in omental adipose tissue of individuals with obesity. Gene. 2022;815:146181. - PubMed
MeSH terms
Substances
LinkOut - more resources
Full Text Sources
Medical
