Comment
. 2024 Feb 22;25(1):53.
doi: 10.1186/s13059-023-03113-6.

CAGI, the Critical Assessment of Genome Interpretation, establishes progress and prospects for computational genetic variant interpretation methods

Collaborators
Comment

CAGI, the Critical Assessment of Genome Interpretation, establishes progress and prospects for computational genetic variant interpretation methods

Critical Assessment of Genome Interpretation Consortium. Genome Biol. .

Abstract

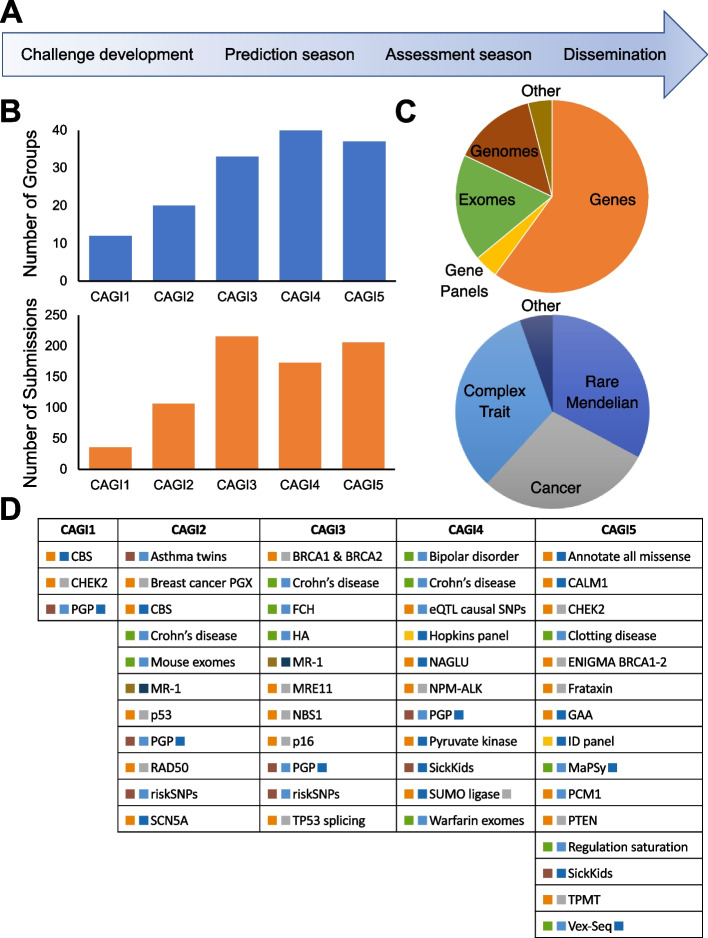
Background: The Critical Assessment of Genome Interpretation (CAGI) aims to advance the state-of-the-art for computational prediction of genetic variant impact, particularly where relevant to disease. The five complete editions of the CAGI community experiment comprised 50 challenges, in which participants made blind predictions of phenotypes from genetic data, and these were evaluated by independent assessors.

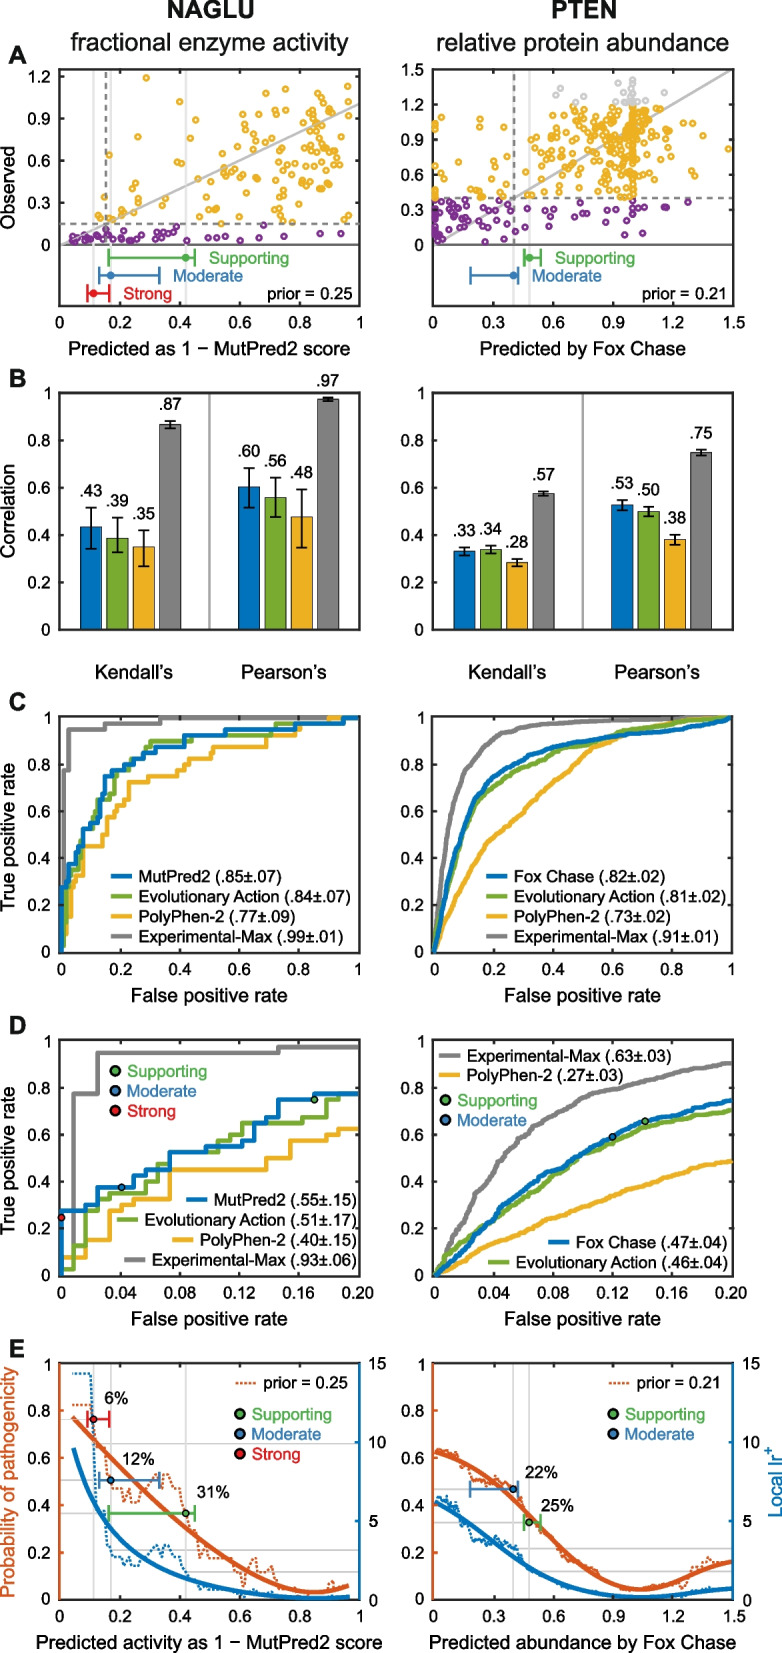
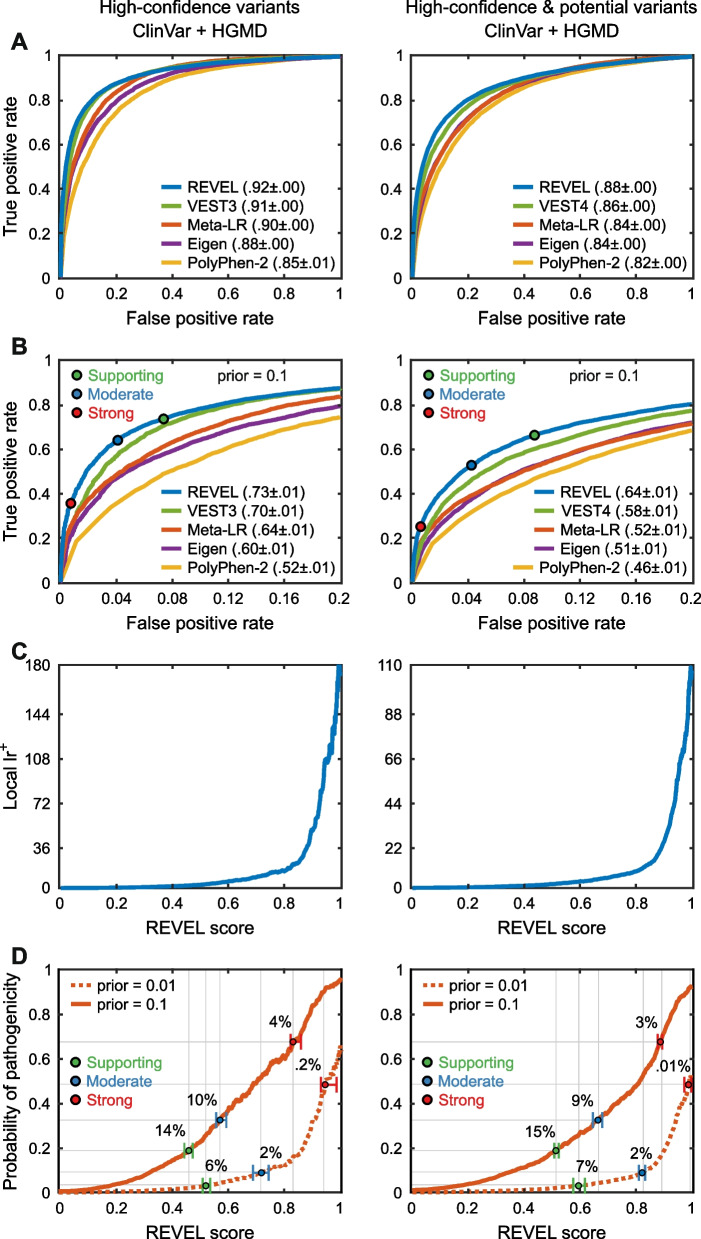
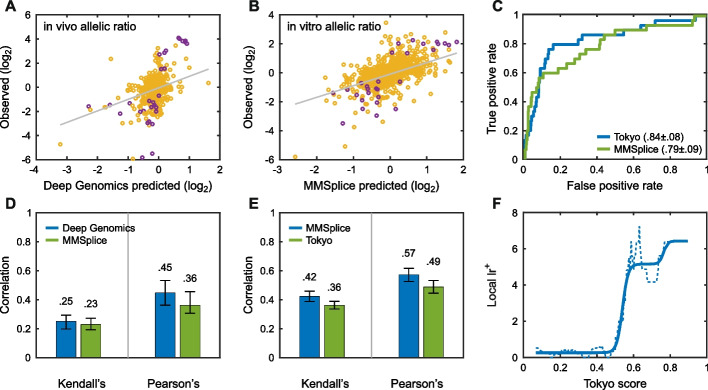
Results: Performance was particularly strong for clinical pathogenic variants, including some difficult-to-diagnose cases, and extends to interpretation of cancer-related variants. Missense variant interpretation methods were able to estimate biochemical effects with increasing accuracy. Assessment of methods for regulatory variants and complex trait disease risk was less definitive and indicates performance potentially suitable for auxiliary use in the clinic.

Conclusions: Results show that while current methods are imperfect, they have major utility for research and clinical applications. Emerging methods and increasingly large, robust datasets for training and assessment promise further progress ahead.


Conflict of interest statement

Principal authors of this paper participated as predictors in many of the CAGI challenges reported. The unified numerical framework employed for reanalysis of the challenges yields results that are consistent with those obtained by the independent assessors of each challenge and in particular selected methods are the highest ranked in the independent assessments. Nevertheless, while every care was taken to mitigate any potential biases in this work, the authors’ participation in CAGI may have affected the presentation of findings, including the selection of challenges, metrics, assessment criteria, and emphasis given on particular results.

VBG is a current employee and shareholder of AstraZeneca; RB is a shareholder of enGenome; AJB is a co-founder and consultant to Personalis and NuMedii as well as a consultant to Samsung, Mango Tree Corporation and in the recent past, 10 × Genomics, Helix and Pathway; Carles Corbi-Verge is a computational scientist at the drug discovery company; Cyclica INC and is compensated with income and equity; KC is one of the Regeneron authors and owns options and/or stock of the company; DD is Chief Scientist at Geneyx Genomex Ltd; CD is a consultant to Exact Sciences and is compensated with income and equity; GAG receives research funds from IBM and Pharmacyclics and is an inventor on patent applications related to MSMuTect, MSMutSig, MSIDetect, POLYSOLVER, and SignatureAnalyzer-GPU, and is a founder, consultant, and holds privately held equity in Scorpion Therapeutics; NG is an employee and stockholder at Pacific Biosciences; RH is a paid consultant for Invitae and Scientific Advisory Board member for Variant Bio; AK is a consultant at Illumina Inc., Scientific Advisory Board member of OpenTargets; KK is one of the Regeneron authors and owns options and/or stock of the company; IL is an employer and stockholder of enGenome; MSM owns stock in PhenoTips; GN is an employee of enGenome; AOD-L is a member of the Scientific Advisory Board of Congenica; ER is a shareholder of enGenome; PKR is the founder of CytoGnomix; FPR is a shareholder in Ranomics and SeqWell, an advisor for SeqWell, BioSymetrics, and Constantiam BioSciences, and has received research sponsorships from Biogen, Alnylam, Deep Genomics, and Beam Therapeutics; PCS is the co-founder and shareholder of Sherlock Biosciences, a board member and shareholder of Danaher Corporation, and has filed patents related to this work; PLFT is an employer and stockholder in AccuraGen; RT has filed patents related to this work; MHW is a shareholder of Beth Bioinformatics Co., Ltd.; CMY is an employee and shareholder of Vertex Pharmaceuticals; JZ is an employee of AstraZeneca; SEB receives support at the University of California, Berkeley from a research agreement from TCS.

Figures

Fig. 1
Fig. 1
CAGI timeline, participation, and range of challenges. A Stages in a round of CAGI, typically extending over 2 years. Each round includes a set of challenges with similar timelines. B Number of participating unique groups (in blue) and submissions (in orange) across CAGI rounds. C Scale of the genetic data (top) and phenotypic characterization (bottom) of CAGI challenges. Some challenges belong to more than one category and are included more than once. D CAGI challenges, listed by round. Coloring is by scale of genetic data and phenotypic characterization according to C. See Supplemental Table 1 for more details
Fig. 2
Fig. 2
Predicting the effect of missense variants on protein properties: Results for two example CAGI challenges. Each required estimation of continuous phenotype values, enzyme activity in a cellular extract for NAGLU and intracellular protein abundance for PTEN, for a set of missense variants. Selection of methods is based on the average ranking over four metrics for each participating method: Pearson’s correlation, Kendall’s tau, ROC AUC, and truncated ROC AUC; see “Methods” for definitions. A Relationship between observed and predicted values for the selected method in each challenge. “Benign” variants are yellow and “pathogenic” are purple (see text). The diagonal line represents exact agreement between predicted and observed values. Dashed lines show the thresholds for pathogenicity for observed (horizontal) and predicted biochemical values (vertical). For NAGLU, below the pathogenicity threshold, there are 12 true positives (lower left quadrant) and three false positives (upper left quadrant), suggesting a clinically useful performance. Bars below each plot show the boundaries for accuracy meeting the threshold for Supporting (green), Moderate (blue), and Strong (red) clinical evidence, with 95% confidence intervals. B Two measures of overall agreement between computational and experimental results, for the two selected performing methods and positive and negative controls, with 95% confidence intervals. An older method, PolyPhen-2, provides a negative control against which to measure progress over the course of the CAGI experiments. Estimated best possible performance is based on experimental uncertainty and provides an empirical upper limit positive control. The color code for the selected methods is shown in panel C. C ROC curves for the selected methods with positive and negative controls, using estimated pathogenicity thresholds. D Truncated ROC curves showing performance in the high true positive region, most relevant for identifying clinically diagnostic variants. The true positive rate and false positive rate thresholds for the Supporting, Moderate, and Strong evidential support are shown for one selected method. E Estimated probability of pathogenicity (left y-axis) and positive local likelihood ratio (right y-axis) as a function of one selected method’s score. Predictions with probabilities over the red, blue, and green thresholds provide Strong, Moderate, and Supporting clinical evidence, respectively. Solid lines show smoothed trends. Prior probabilities of pathogenicity are the estimated probability that any missense variant in these genes will be pathogenic. For NAGLU, the probabilities of pathogenicity reach that needed for a clinical diagnosis of “likely pathogenic.” For predicted enzyme activity less than 0.11, the probability provides Strong evidence, below 0.17 Moderate evidence, and below 0.42, Supporting evidence. The percent of variants encountered in the clinic expected to meet each threshold are also shown. Performance for PTEN shows that the results are consistent with providing Moderate and Supporting evidence levels for some variants
Fig. 3
Fig. 3
Performance of computational methods in correctly identifying pathogenic variants in the two principal rare disease variant databases, HGMD and ClinVar. The left panels show data for variants labeled as “pathogenetic” in ClinVar and “DM” in HGMD together with “benign” in ClinVar. The right panels add variants labeled as “likely pathogenic” and “likely benign” in ClinVar as well as “DM?” in HGMD. Meta and single method examples were selected on the basis of the average ranking of each method for the ROC and truncated ROC AUCs. See Additional file 1 for more details and selection criteria. A ROC curves for the selected metapredictors and single methods, together with a baseline provided by PolyPhen-2. Particularly for pathogenic variants alone, impressively high ROC areas are obtained, above 0.9, and there is a substantial improvement over the older method’s performance. B Blowup of the left-hand portion of the ROC curves, most relevant to high confident identification of pathogenic variants. Clinical thresholds for Supporting, Moderate, and Strong clinical evidence are shown. C Local positive likelihood ratio as a function of the confidence score returned by REVEL. Very high values (> 100) are obtained for the most confident pathogenic assignments. D Local posterior probability of pathogenicity; that is, probability that a variant is pathogenic as a function of the REVEL score for the two prior probability scenarios. For a prior probability of 0.1, typical of a single candidate gene situation (solid line) and database pathogenic and benign variants (left panel) the highest-scoring variants reach posterior probability above 0.9, strong enough evidence for a clinical assignment of “likely pathogenic.” In both panels, variants with a score greater than 0.45 provide Supporting clinical evidence (green threshold), and scores greater than 0.8 provide Strong evidence (red threshold). The estimated % of variants encountered in a clinical setting expected to meet each threshold are also shown. For example, about 14% of variants provide Supporting evidence. Dotted lines show results obtained with a prior probability of 0.01
Fig. 4
Fig. 4
Performance of computational methods in identifying variants that affect splicing in the MaPSy challenge. Methods were selected based on the average ranking over three metrics: Pearson’s correlation, Kendall’s tau, and ROC AUC. Scatter plots, Kendell’s tau, and Pearson’s correlation results are shown for in vivo (A, D) and in vitro assays (B, E) separately. The small number of purple points in the scatter plots represent splicing fold changes greater than 1.5-fold. The ROC curve (C) shows performance in variant classification for the two selected methods. The maximum local positive likelihood ratio (lr+, F) may be large enough for use as auxiliary information, see “ Discussion” (solid line is smoothed fit to the data)
Fig. 5
Fig. 5
Performance on the regulation saturation expression challenge. The two left columns show performance in predicting increased (left) and decreased (right) expression in a set of enhancers (purple points represent variants that significantly change expression). The right pair of columns show equivalent results for promoters. The scatter plots (A) show strong performance in identifying decreases in expression (purple points), but weaker results for expression increases. Performance on promoters is stronger than on enhancers. Overlap of changed and non-changed experimental expression points suggests that experimental uncertainty reduces the apparent performance of the computational methods. Panel B shows correlation coefficients for selected methods. Panel C shows ROC curves for predicting under and overexpression. Panel D shows local lr+, where the solid lines are smoothed fits to the data
Fig. 6
Fig. 6
Identifying which of a set of individuals are most at risk for Crohn’s disease, given exome data. Examples were selected on the basis of ranking by ROC AUC. A ROC curves for two selected methods. Statistically significant but relatively low ROC areas are obtained. B Distributions of disease prediction scores for individuals with the disease (red) and without (green) for the method with the highest AUC (kernel density representation of the data). C Local positive likelihood ratio (lr+) as a function of prediction score for the method with the highest AUC. D Relative risk of disease (log2 scale), compared to that in the general population as a function of prediction score. Individuals with the lowest risk scores have approximately 1/3 the average population risk, while those with the highest scores have risk exceeding fourfold the average, a 12-fold total range. Depending on the disease, identifying individuals with higher than threefold the average risk may be sufficient for clinical action

Comment on

References

    1. Claussnitzer M, Cho JH, Collins R, Cox NJ, Dermitzakis ET, Hurles ME, Kathiresan S, Kenny EE, Lindgren CM, MacArthur DG, North KN, Plon SE, Rehm HL, Risch N, Rotimi CN, Shendure J, Soranzo N, McCarthy MI. A brief history of human disease genetics. Nature. 2020;577(7789):179–189. - PMC - PubMed
    1. Gibbs RA. The human genome project changed everything. Nat Rev Genet. 2020;21(10):575–576. - PMC - PubMed
    1. 1000 Genomes Project Consortium. Abecasis GR, Altshuler D, Auton A, Brooks LD, Durbin RM, Gibbs RA, Hurles ME, McVean GA. A map of human genome variation from population-scale sequencing. Nature. 2010;467(7319):1061–1073. - PMC - PubMed
    1. Cutting GR. Cystic fibrosis genetics: from molecular understanding to clinical application. Nat Rev Genet. 2015;16(1):45–56. - PMC - PubMed
    1. Nielsen FC, van Overeem HT, Sorensen CS. Hereditary breast and ovarian cancer: new genes in confined pathways. Nat Rev Cancer. 2016;16(9):599–612. - PubMed